XPT/USD "The Platinum" Metals Market Bull Heist Plan (DAY Trade)🌟Hi! Hola! Ola! Bonjour! Hallo! Marhaba!🌟
Dear Money Makers & Robbers, 🤑 💰💸✈️
Based on 🔥Thief Trading style technical and fundamental analysis🔥, here is our master plan to heist the XPT/USD "The Platinum" Metals Market. Please adhere to the strategy I've outlined in the chart, which emphasizes long entry. Our aim is to escape near the high-risk ATR Zone. Risky level, overbought market, consolidation, trend reversal, trap at the level where traders and bearish robbers are stronger. 🏆💸"Take profit and treat yourself, traders. You deserve it!💪🏆🎉
Entry 📈 : "The vault is wide open! Swipe the Bullish loot at any price - the heist is on!
however I advise to Place buy limit orders within a 15 or 30 minute timeframe most recent or swing, low or high level for Pullback entries.
Stop Loss 🛑:
📍 Thief SL placed at the recent/swing low level Using the 4H timeframe (935.000) Day trade basis.
📍 SL is based on your risk of the trade, lot size and how many multiple orders you have to take.
🏴☠️Target 🎯: 1015.000 (or) Escape Before the Target
🧲Scalpers, take note 👀 : only scalp on the Long side. If you have a lot of money, you can go straight away; if not, you can join swing traders and carry out the robbery plan. Use trailing SL to safeguard your money 💰.
💰💵💴💸XPT/USD "The Platinum" Metals Market Heist Plan (Day / Swing Trade) is currently experiencing a bullishness🐂.., driven by several key factors.👆👆👆
📰🗞️Get & Read the Fundamental, Macro Economics, COT Report, Geopolitical and News Analysis, Sentimental Outlook, Intermarket Analysis, Supply and Demand Factors, Future trend targets with Overall outlook score... go ahead to check👉👉👉🔗🔗🌎🌏🗺
⚠️Trading Alert : News Releases and Position Management 📰 🗞️ 🚫🚏
As a reminder, news releases can have a significant impact on market prices and volatility. To minimize potential losses and protect your running positions,
we recommend the following:
Avoid taking new trades during news releases
Use trailing stop-loss orders to protect your running positions and lock in profits
💖Supporting our robbery plan 💥Hit the Boost Button💥 will enable us to effortlessly make and steal money 💰💵. Boost the strength of our robbery team. Every day in this market make money with ease by using the Thief Trading Style.🏆💪🤝❤️🎉🚀
I'll see you soon with another heist plan, so stay tuned 🤑🐱👤🤗🤩
Xptusdsignals

XPT/USD "The Platinum" Metals Market Heist Plan (Swing/Day)🌟Hi! Hola! Ola! Bonjour! Hallo! Marhaba!🌟
Dear Money Makers & Robbers, 🤑 💰💸✈️
Based on 🔥Thief Trading style technical and fundamental analysis🔥, here is our master plan to heist the XPT/USD "The Platinum" Metals Market. Please adhere to the strategy I've outlined in the chart, which emphasizes long entry. Our aim is to escape near the high-risk ATR Zone. Risky level, overbought market, consolidation, trend reversal, trap at the level where traders and bearish robbers are stronger. 🏆💸"Take profit and treat yourself, traders. You deserve it!💪🏆🎉
Entry 📈 : "The heist is on! Wait for the MA breakout (975.000) then make your move - Bullish profits await!"
however I advise to Place Buy stop orders above the Moving average (or) Place buy limit orders within a 15 or 30 minute timeframe most recent or swing, low or high level for Pullback entries.
📌I strongly advise you to set an "alert (Alarm)" on your chart so you can see when the breakout entry occurs.
Stop Loss 🛑: "🔊 Yo, listen up! 🗣️ If you're lookin' to get in on a buy stop order, don't even think about settin' that stop loss till after the breakout 🚀. You feel me? Now, if you're smart, you'll place that stop loss where I told you to 📍, but if you're a rebel, you can put it wherever you like 🤪 - just don't say I didn't warn you ⚠️. You're playin' with fire 🔥, and it's your risk, not mine 👊."
📍 Thief SL placed at the recent/swing low level Using the 2H timeframe (945.000) Day/Swing trade basis.
📍 SL is based on your risk of the trade, lot size and how many multiple orders you have to take.
🏴☠️Target 🎯: 1004.000 (or) Escape Before the Target
🧲Scalpers, take note 👀 : only scalp on the Long side. If you have a lot of money, you can go straight away; if not, you can join swing traders and carry out the robbery plan. Use trailing SL to safeguard your money 💰.
💰💵💴💸XPT/USD "The Platinum" Metals Market Heist Plan (Day / Swing Trade) is currently experiencing a bullishness🐂.., driven by several key factors.☝☝☝
📰🗞️Get & Read the Fundamental, Macro, COT Report, Quantitative Analysis, Sentimental Outlook, Intermarket Analysis, Future trend targets... go ahead to check 👉👉👉🔗🔗
⚠️Trading Alert : News Releases and Position Management 📰 🗞️ 🚫🚏
As a reminder, news releases can have a significant impact on market prices and volatility. To minimize potential losses and protect your running positions,
we recommend the following:
Avoid taking new trades during news releases
Use trailing stop-loss orders to protect your running positions and lock in profits
💖Supporting our robbery plan 💥Hit the Boost Button💥 will enable us to effortlessly make and steal money 💰💵. Boost the strength of our robbery team. Every day in this market make money with ease by using the Thief Trading Style.🏆💪🤝❤️🎉🚀
I'll see you soon with another heist plan, so stay tuned 🤑🐱👤🤗🤩

XPT/USD "The Platinum" Metals Market Heist Plan🌟Hi! Hola! Ola! Bonjour! Hallo! Marhaba!🌟
Dear Money Makers & Robbers, 🤑 💰💸✈️
Based on 🔥Thief Trading style technical and fundamental analysis🔥, here is our master plan to heist the XPT/USD "The Platinum" Metals market. Please adhere to the strategy I've outlined in the chart, which emphasizes long entry. Our aim is the high-risk Red Zone. Risky level, overbought market, consolidation, trend reversal, trap at the level where traders and bearish robbers are stronger. 🏆💸Book Profits Be wealthy and safe trade.💪🏆🎉
Entry 📈 : "The vault is wide open! Swipe the Bullish loot at any price - the heist is on!
however I advise to Place buy limit orders within a 15 or 30 minute timeframe most recent or swing, low or high level. I Highly recommended you to put alert in your chart.
Stop Loss 🛑:
Thief SL placed at the recent / nearest low level Using the 4H timeframe (970.00) swing trade basis.
SL is based on your risk of the trade, lot size and how many multiple orders you have to take.
Target 🎯: 1025.00 (or) Escape Before the Target
🧲Scalpers, take note 👀 : only scalp on the Long side. If you have a lot of money, you can go straight away; if not, you can join swing traders and carry out the robbery plan. Use trailing SL to safeguard your money 💰.
XPT/USD "The Platinum" Metals Market is currently experiencing a bullish trend,., driven by several key factors.
📰🗞️Read the Fundamental, Macro Economics, COT Report, Seasonal Factors, Intermarket Analysis, Sentimental Outlook, Future trend predict.
Before start the heist plan read it.👉👉👉
📌Keep in mind that these factors can change rapidly, and it's essential to stay up-to-date with market developments and adjust your analysis accordingly.
⚠️Trading Alert : News Releases and Position Management 📰 🗞️ 🚫🚏
As a reminder, news releases can have a significant impact on market prices and volatility. To minimize potential losses and protect your running positions,
we recommend the following:
Avoid taking new trades during news releases
Use trailing stop-loss orders to protect your running positions and lock in profits
💖Supporting our robbery plan 💥Hit the Boost Button💥 will enable us to effortlessly make and steal money 💰💵. Boost the strength of our robbery team. Every day in this market make money with ease by using the Thief Trading Style.🏆💪🤝❤️🎉🚀
I'll see you soon with another heist plan, so stay tuned 🤑🐱👤🤗🤩

XPTUSD Long-term buy opportunity near 1 year Support.Platinum (XPTUSD) is having a strong start to the week following a streak of 2 red 1W candles rejected on both the 1W MA50 (blue trend-line) and 1W MA200 (orange trend-line). Regardless of the obvious 1W Golden Cross pattern that those two are aiming to complete, the price got again near the 895 - 903 Support Zone, which has been closing all 1W candles above since September 2022.
With the 1W RSI on a bottom sequence similar to the February 2023, December 2021 and September 2021 fractals, we consider this an excellent long-term buy opportunity. Our target is the bottom of the Resistance Zone at 1100.
-------------------------------------------------------------------------------
** Please LIKE 👍, FOLLOW ✅, SHARE 🙌 and COMMENT ✍ if you enjoy this idea! Also share your ideas and charts in the comments section below! **
-------------------------------------------------------------------------------
💸💸💸💸💸💸
👇 👇 👇 👇 👇 👇

XPT/USD "Platinum vs US Dollar" Metals Market Bullish Heist Plan🌟Hi! Hola! Ola! Bonjour! Hallo!🌟
Dear Money Makers & Thieves, 🤑 💰🐱👤
Based on 🔥Thief Trading style technical and fundamental analysis🔥, here is our master plan to heist the XPT/USD "Platinum vs US Dollar" Metals market. Please adhere to the strategy I've outlined in the chart, which emphasizes long entry. Our aim is the high-risk Red Zone. Risky level, overbought market, consolidation, trend reversal, trap at the level where traders and bearish robbers are stronger. 🏆💸Be wealthy and safe trade.💪🏆🎉
Entry 📈 : "The vault is wide open! Swipe the Bullish loot at any price - the heist is on!
however I advise Place Buy limit orders within a 15 or 30 minute timeframe. Entry from the most re cent or closest low or high level should be in retest.
Stop Loss 🛑: Thief SL placed at the recent / nearest low level Using the 4H timeframe,
SL is based on your risk of the trade, lot size and how many multiple orders you have to take.
Target 🎯: 1070.000 (or) Escape Before the Target
🔵Scalpers, take note 👀 : only scalp on the Long side. If you have a lot of money, you can go straight away; if not, you can join swing traders and carry out the robbery plan. Use trailing SL to safeguard your money 💰.
📰🗞️Fundamental, Macro, COT, Sentimental Outlook:
XPT/USD "Platinum vs US Dollar" Metals Market is currently experiencing a Bullish trend., driven by several key factors.
🟢Fundamental Analysis
Demand and Supply
- Demand for Platinum is increasing due to its use in catalytic converters and investment appeal.
- Supply disruptions in South Africa, a major Platinum producer, may impact global supply.
Market News
- Platinum prices rose 1.5% yesterday due to increased demand and supply concerns.
- The US dollar index is down 0.2% today, supporting precious metal prices.
⚪Macro Economics
- Global Economic Outlook
The global economy is expected to grow at a slower pace in 2025, with a forecast of 3.0% global GDP growth rate.
- Interest Rates
The US Federal Reserve is expected to keep interest rates on hold in the near term, while the European Central Bank is expected to maintain its accommodative monetary policy stance.
- Inflation
Inflation expectations are muted, with the US Consumer Price Index (CPI) expected to rise by 2.0% in 2025.
- Geopolitics
Geopolitical tensions between the US and China remain a concern, with the potential to impact global trade and economic growth.
🔴Trader Positioning
Institutional Traders
52% short, 48% long
Retail Traders
55% long, 45% short
Hedge Funds
50% short, 50% long
COT Report
Non-Commercials (Speculators)
net long 5,500 contracts
Commercials (Hedgers)
net short 3,500 contracts
🟠Market Sentiment
Retail Sentiment
Bullish (55% of retail traders are long)
Institutional Sentiment
Bearish (52% of institutional traders are short)
Hedge Fund Sentiment
Neutral (50% of hedge funds are short, 50% are long)
🟡Overall Outlook
Based on the analysis, the overall outlook for XPT/USD is bullish in the short term, driven by increasing demand, supply concerns, and a bullish market sentiment. However, the pair may experience a short-term correction due to the bearish sentiment among institutional traders.
⚠️Trading Alert : News Releases and Position Management 📰 🗞️ 🚫🚏
As a reminder, news releases can have a significant impact on market prices and volatility. To minimize potential losses and protect your running positions,
we recommend the following:
Avoid taking new trades during news releases
Use trailing stop-loss orders to protect your running positions and lock in profits
📌Please note that this is a general analysis and not personalized investment advice. It's essential to consider your own risk tolerance and market analysis before making any investment decisions.
📌Keep in mind that these factors can change rapidly, and it's essential to stay up-to-date with market developments and adjust your analysis accordingly.
💖Supporting our robbery plan will enable us to effortlessly make and steal money 💰💵 Tell your friends, Colleagues and family to follow, like, and share. Boost the strength of our robbery team. Every day in this market make money with ease by using the Thief Trading Style.🏆💪🤝❤️🎉🚀
I'll see you soon with another heist plan, so stay tuned 🤑🐱👤🤗🤩

PLATINUM Buy signal on the 1D MA50.Platinum (XPTUSD) is ranged lately within the 1D MA50 (blue trend-line) and 1D MA200 (orange trend-line) but with its 1D RSI rising steadily since the December 30 2024 Low. That was the technical bottom of the Falling Wedge pattern that broke upwards.
As you can see, this has been a very common pattern since September 2023, with all Falling Wedges eventually breaking to the upside to hit at least the 1.618 Fibonacci extension. As a result, our current short-term Target is $999.50.
-------------------------------------------------------------------------------
** Please LIKE 👍, FOLLOW ✅, SHARE 🙌 and COMMENT ✍ if you enjoy this idea! Also share your ideas and charts in the comments section below! This is best way to keep it relevant, support us, keep the content here free and allow the idea to reach as many people as possible. **
-------------------------------------------------------------------------------
💸💸💸💸💸💸
👇 👇 👇 👇 👇 👇

XPT/ USD "PLATINUM" Metals Market Heist PlanHola! Ola! My Dear Robbers / Money Makers & Losers, 🤑 💰
This is our master plan to Heist XPT/ USD "PLATINUM" Metals Market based on Thief Trading style Technical Analysis.. kindly please follow the plan I have mentioned in the chart focus on Long entry. Our target is Red Zone that is High risk Dangerous level, market is overbought / Consolidation / Trend Reversal / Trap at the level Bearish Robbers / Traders gain the strength. Be safe and be careful and Be rich.
Entry 📈 : Can be taken Anywhere, What I suggest you to Place Buy Limit Orders in 15mins Timeframe Recent / Nearest Low Point take entry should be in pullback.
Stop Loss 🛑 : Recent Swing Low using 2H timeframe
Attention for Scalpers : Focus to scalp only on Long side, If you've got a lot of money you can get out right away otherwise you can join with a swing trade robbers and continue the heist plan, Use Trailing SL to protect our money 💰.
Warning : Fundamental Analysis news 📰 🗞️ comes against our robbery plan. our plan will be ruined smash the Stop Loss 🚫🚏. Don't Enter the market at the news update.
Loot and escape on the target 🎯 Swing Traders Plz Book the partial sum of money and wait for next breakout of dynamic level / Order block, Once it is cleared we can continue our heist plan to next new target.
💖Support our Robbery plan we can easily make money & take money 💰💵 Follow, Like & Share with your friends and Lovers. Make our Robbery Team Very Strong Join Ur hands with US. Loot Everything in this market everyday make money easily with Thief Trading Style.
Stay tuned with me and see you again with another Heist Plan..... 🫂

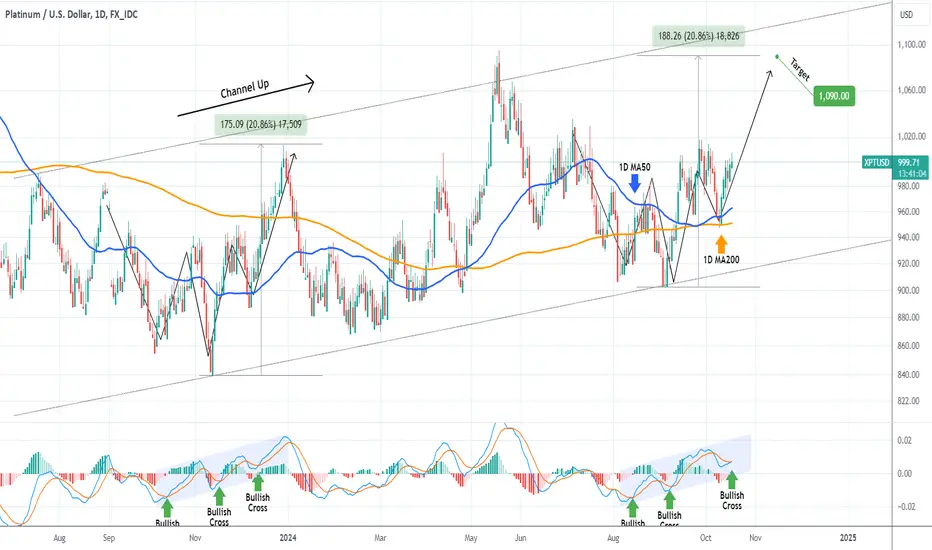
PLATINUM Huge buy opportunity at the bottom of the Channel Up.Platinum (XPTUSD) has been trading within a Channel Up for almost 1.5 year and currently it is testing the pattern's bottom. This process is similar to the Lower Lows bottom sequence of February 12 2024.
As you can see, even the 1D MACD fractals are the same and we are about to post the decisive Bullish Cross that signals the buy. As long as the price remains below the 1D MA50 (blue trend-line), it is a huge long-term buy opportunity.
The previous Bullish Leg hit the 1.236 Fibonacci extension within the Channel Up and peaked above it on the 1.5 Fib ext. As a result, our technical Target is on the modest 1.236 Fib at 1090.
-------------------------------------------------------------------------------
** Please LIKE 👍, FOLLOW ✅, SHARE 🙌 and COMMENT ✍ if you enjoy this idea! Also share your ideas and charts in the comments section below! This is best way to keep it relevant, support us, keep the content here free and allow the idea to reach as many people as possible. **
-------------------------------------------------------------------------------
💸💸💸💸💸💸
👇 👇 👇 👇 👇 👇

XPT/USD "Platinum" Market Money Heist Plan on Bullish SideHallo! My Dear Robbers / Money Makers & Losers, 🤑 💰
This is our master plan to Heist XPT/USD "Platinum" Market Market based on Thief Trading style Technical Analysis.. kindly please follow the plan I have mentioned in the chart focus on Long entry. Our target is Red Zone that is High risk Dangerous level, market is overbought / Consolidation / Trend Reversal / Trap at the level Bearish Robbers / Traders gain the strength. Be safe and be careful and Be rich.
Entry 📈 : Can be taken Anywhere, What I suggest you to Place Buy Limit Orders in 15mins Timeframe Recent / Nearest Low Point take entry in pullback.
Stop Loss 🛑 : Recent Swing Low using 30m timeframe
Attention for Scalpers : Focus to scalp only on Long side, If you've got a lot of money you can get out right away otherwise you can join with a swing trade robbers and continue the heist plan, Use Trailing SL to protect our money 💰.
Warning : Fundamental Analysis news 📰 🗞️ comes against our robbery plan. our plan will be ruined smash the Stop Loss 🚫🚏. Don't Enter the market at the news update.
Loot and escape on the target 🎯 Swing Traders Plz Book the partial sum of money and wait for next breakout of dynamic level / Order block, Once it is cleared we can continue our heist plan to next new target.
💖Support our Robbery plan we can easily make money & take money 💰💵 Follow, Like & Share with your friends and Lovers. Make our Robbery Team Very Strong Join Ur hands with US. Loot Everything in this market everyday make money easily with Thief Trading Style.
Stay tuned with me and see you again with another Heist Plan..... 🫂

XPT Surges as EMAs Align with Bullish Chart PatternH ello!
XPT broke out from a falling wedge (See green trendlines!) formation with strong bull power, as the MACD shows. It wasn't against expectations since falling wedge chart patterns usually break upward. It's often a bullish formation. Thus, MACD and chart patterns align with a bullish outlook. Furthermore, the price is above EMAs (20/50/100/200). EMAs crossed upward on the 24th of September. Seemingly, nothing stands in the path of bulls until the green target circles. However, stay vigilant and don't go all in.
Regards,
Ely

PLATINUM Strong rebound on the 1D MA200.We got a perfect bottom buy entry on Platinum (XPTUSD) last time we analyzed it (August 30, see chart below), with the price already halfway to our 1090 Target:
As you can see, the price action is almost a perfect mirror image of September - December 2023. Now that the price has confirmed the new Bullish Leg with a strong rebound on the 1D MA50 - 1D MA200 zone (blue and orange trend-lines respectively), we can expect it to complete the pattern and complete a +20.86% rise, right where our 1090 Target is.
-------------------------------------------------------------------------------
** Please LIKE 👍, FOLLOW ✅, SHARE 🙌 and COMMENT ✍ if you enjoy this idea! Also share your ideas and charts in the comments section below! This is best way to keep it relevant, support us, keep the content here free and allow the idea to reach as many people as possible. **
-------------------------------------------------------------------------------
💸💸💸💸💸💸
👇 👇 👇 👇 👇 👇
PLATINUM Strong buy opportunity at the bottom of the Channel Up.Platinum (XPTUSD) has been trading within a 1-year Channel Up pattern and on August 05 it priced the latest Higher Low on the pattern's bottom. Having already recovered the 1D MA50 (blue trend-line), we have a confirmed signal of the start of the new Bullish Leg.
The last two major rallies rose by at least +20.86% and as such, our long-term Target is 1090.
-------------------------------------------------------------------------------
** Please LIKE 👍, FOLLOW ✅, SHARE 🙌 and COMMENT ✍ if you enjoy this idea! Also share your ideas and charts in the comments section below! This is best way to keep it relevant, support us, keep the content here free and allow the idea to reach as many people as possible. **
-------------------------------------------------------------------------------
💸💸💸💸💸💸
👇 👇 👇 👇 👇 👇

PLATINUM Massive profit last time. What's the next trade?Straight and plain success of our previous Platinum (XPTUSD) signal (April 24, see chart below), where we caught the exact Bullish Megaphone bottom and hit directly our 1060 Target:
The price could now enter a consolidation phase, the last accumulation, similar to November 15 - December 15 2022, when after it touched the 1D MA50 (blue trend-line), it rallied to the bottom of the Resistance Zone.
As a result, we are turning into buyers again, targeting 1100 (just below the Resistance Zone).
-------------------------------------------------------------------------------
** Please LIKE 👍, FOLLOW ✅, SHARE 🙌 and COMMENT ✍ if you enjoy this idea! Also share your ideas and charts in the comments section below! This is best way to keep it relevant, support us, keep the content here free and allow the idea to reach as many people as possible. **
-------------------------------------------------------------------------------
💸💸💸💸💸💸
👇 👇 👇 👇 👇 👇

PLATINUM XPTUSD Bearish Robbery Plan to make money 🤑💰Hola Platinum Robbers,
This is our master plan to Heist Bearish side of PLATINUM XPTUSD market. kindly please follow the plan i have mentioned in the chart focus on Short entry, New entry traders pls enter only in pullback of smaller timeframe then enter to rob the money. Our target is Green Zone that is High risk Dangerous area Consolidation will happen. Be safe and be careful and Be rich.
Loot and escape near the target 🎯
support our robbery plan we can make money take money 💰💵 Join your hands with US. Loot Everything in this market everyday.

XPTUSD Strong Higher Low buy opportunity. 1D Golden Cross formedPlatinum (XPTUSD) gave us an excellent bottom buy signal last time (March 13, see chart below), as the metal entered a Channel Up pattern following the bottom just below 880.00:
Currently we are on the 2nd Bearish Leg of the Bullish Megaphone pattern that emerged and will complete a Golden Cross on the 1D time-frame today. As per the December 02 2023 Golden Cross, which was formed after a similar rebound, but on a more aggressive Channel Up instead of a Megaphone, we should be expecting another Higher High near the 1.382 Fibonacci extension. Our Target is 1060.
-------------------------------------------------------------------------------
** Please LIKE 👍, FOLLOW ✅, SHARE 🙌 and COMMENT ✍ if you enjoy this idea! Also share your ideas and charts in the comments section below! This is best way to keep it relevant, support us, keep the content here free and allow the idea to reach as many people as possible. **
-------------------------------------------------------------------------------
💸💸💸💸💸💸
👇 👇 👇 👇 👇 👇

Platinum- Can it Bridge the Gap with Gold?For the past 10 months, OANDA:XPTUSD has been trading within a range between approximately 850 to 1000.
However, upon closer examination of this range, it appears to resemble a rounded bottom formation and also after dipping below 900 at the beginning of March, Platinum has been establishing higher lows, suggesting that the price is ready for a strong rise.
Conservative traders may want to consider waiting for a break above 1000.
In such an instance, the price could potentially accelerate and reach 1300 in the medium term.
On the other hand, more aggressive traders could opt to buy dips near 950.
With a stop loss set below 850 and a target of 1300, this strategy could potentially yield a risk-to-reward ratio of more than 1:3.

XPTUSD broke above the 1D MA200 and is ready to rally.Platinum (XPTUSD) broke above the 1D MA200 (orange trend-line), and being on 1D RSI Higher Lows, we may be having a strong rally in its early stages. At least this is what the very same Higher Lows RSI pattern has led to when Platinum made the very same 1D MA200 break-out on October 26 2022.
The result was a +28.50% instant rally from the bottom and then a finaly blow-out just below the 1.382 Fibonacci extension. As a result, we are bullish on Platinum targeting a minimum at 1060 (sub 1.382 Fib), even though it may very well reach the upper (red) Resistance Zone.
-------------------------------------------------------------------------------
** Please LIKE 👍, FOLLOW ✅, SHARE 🙌 and COMMENT ✍ if you enjoy this idea! Also share your ideas and charts in the comments section below! This is best way to keep it relevant, support us, keep the content here free and allow the idea to reach as many people as possible. **
-------------------------------------------------------------------------------
💸💸💸💸💸💸
👇 👇 👇 👇 👇 👇

Platinum Trade Idea: Go Long with a Price Target of $1,100Rationale:
COT sentiment
The last COT report shows that Commercials' net short positions have been decreasing, which could indicate a shift in sentiment towards the bullish side.
The COT report can be used as a tool to gauge the market sentiment of traders. When Commercials' net short positions decrease, it could signal a potential shift in sentiment towards the bullish side. This could be due to factors such as improving economic conditions, increased demand for platinum, or geopolitical events that could impact the price of platinum.
Option Sentiment
There has been a significant increase in insider option activity, with a notable number of calls being purchased at 100$ strike price. This bullish sentiment has been further corroborated by the options open interest, which has also increased.
Technical Analysis
From a technical perspective, Platinum breakthroug range.

Seasonal Long in PlatinumHey guys, there is an annual seasonal setup in Platinum which begins during the middle of December and extends until February/Early-March timeframe. The meat of the move seems to occur from end-December until mid/end-January though. While last years movement was fairly muted due to the weak capital markets, I am aiming for a $150/oz upside move this year. TP range is $1100-$1125 area. I scale into small longs vs. taking a single large position as the ranges in Platinum, can be quite large. You can also refer to this link for more info on the seasonal setup as well:
auctusmetals.com

XPTUSD About to test the 1D MA200. Strong buy above it.Platinum (XPTUSD) is going quite well since our October 25 buy call (see chart below) as we caught the bottom and the price is now rebounding:
The long term pattern is a Channel Up. At the moment the price is supported by the 1D MA50 (blue trend-line) buy restrained below the 1D MA200 (orange trend-line) where it got rejected on November 28. Even though the bottom of the Channel Up was made and the 1D RSI patterns between the two sequences are similar, we need confirmation for upward extension by a break above the 1D MA200.
If you didn't buy lower, you can wait until that level breaks, and then target the +28.55% range at $1100.
-------------------------------------------------------------------------------
** Please LIKE 👍, FOLLOW ✅, SHARE 🙌 and COMMENT ✍ if you enjoy this idea! Also share your ideas and charts in the comments section below! This is best way to keep it relevant, support us, keep the content here free and allow the idea to reach as many people as possible. **
-------------------------------------------------------------------------------
💸💸💸💸💸💸
👇 👇 👇 👇 👇 👇

XPTUSD bottomed and has almost +30% upside potential.Platinum (XPTUSD) is testing (and so far failing to break) the 1D MA50 (blue trend-line) after a rebound on the bottom (Higher Lows trend-line) of the long-term Channel Up structure. A break above the 1D MA50 but mostly the Lower Highs trend-line, would confirm the bullish bias on such a low price action, with considerable upside potential.
As you can see the current bottom formation is very similar to the one that led to the September 01 2022 Low. The 1D RSI fractals are identical and will be confirmed if it continues on Higher Lows.
As a result we do have a low risk buy signal on the current level but it is not confirmed yet and needs to break above the Lower Highs to do so. Our long-term target is the 1100, which represents a +28.55% rise from the bottom, similar to the November 11 2022 peak.
-------------------------------------------------------------------------------
** Please LIKE 👍, FOLLOW ✅, SHARE 🙌 and COMMENT ✍ if you enjoy this idea! Also share your ideas and charts in the comments section below! This is best way to keep it relevant, support us, keep the content here free and allow the idea to reach as many people as possible. **
-------------------------------------------------------------------------------
💸💸💸💸💸💸
👇 👇 👇 👇 👇 👇

XPTUSD Solid buy entry but not confirmed yet.Platinum (XPTUSD) is trading around the 1D MA50 (blue trend-line) after a rebound on the bottom (Higher Lows trend-line) of a potential long-term Channel Up structure. This is the 2nd time it bounces off the Higher Lows and the 4th within the 7-month Support Zone.
The 1D MACD made a Bullish Cross last week and is on Higher Lows since June 30. The very same Triple Bottom formation on a Higher Lows MACD can be seen on the previous bottom. The Lower Highs trend-line break-out didn't confirm the bullish signal, it had to be a break above the 1D MA200 (orange trend-line) to give the confirmation. As you can see on both fractals the price got rejected on the 1D MA200 (August 11 2022 and July 18 2023) before it bottomed.
As a result we may have a low risk buy signal on the current level but it is not confirmed yet and needs to break above the 1D MA200 to do so. Our long-term target is the Top of the Resistance Zone at 1130.
-------------------------------------------------------------------------------
** Please LIKE 👍, FOLLOW ✅, SHARE 🙌 and COMMENT ✍ if you enjoy this idea! Also share your ideas and charts in the comments section below! **
-------------------------------------------------------------------------------
💸💸💸💸💸💸
👇 👇 👇 👇 👇 👇

Platinum- New test of 1k zone?Since the beginning of July, Platinum has been trading in a 100 USD range, between 900 and 1000 USD per ounce (more or less).
The start of September found the price at the bottom of this range and the price has started to rise again.
A first leg up followed and after XptUsd reached 950, a correction started.
Yesterday we had a reversal in price from interim support around 927 and a new leg up could be next.
Bulls are favored as long as the price is above yesterday's low in terms of daily close and, swing traders who target the upper boundary of the race could achieve an impressive 1:3 risk: reward.
As in the case of Silver and Gold, I'm also bullish on Platinum.

