ENJ BEARS WILL BE DISCIPLINEDEnj looks like it has bottomed, it has accumulated sideways out of the downtrend. I think this coin can go crazy, there could be another retest of the downtrend. But it should hold the monthly on the monthly close.
Xrp-btc

XRP PUT IN YOUR 2 WEEKSWhen .26 cents is broken you can put in your 2 weeks. Monthly resistance, the riddlers are right. Target $10

Bullish Divergence| Equilibrium|Resistance| ALT Season? Hello Traders,
Today’s chart update will be on XRPBTC with a probable bullish divergence coming to fruition if local resistance is broken.
Points to consider
- Trend testing key levels
- Local resistance to break
- EMA’s currently support
- Stochastics neutral
- RSI respecting trend
- Increase in volume
Trend is testing technical levels and holding, an evident bullish divergence is diverting XRP to change the current down trend. Local resistance is yet to break, a close above will confirm the bullish divergence.
EMA’s currently support, must hold true when local resistance is broken, worthy to note that it has been weak as of late.
Stochastics is currently neutral; a fall in any direction is probable. The RSI is respecting its trend, diverging from price by putting in higher lows whilst XRP puts in lower lows.
An Increase in volume needs to sustain when a break comes to fruition, this will increase the probabilities of a continuation.
Overall, in my opinion, XRPBTC is trading between two levels where equilibrium may come to fruition from this bullish divergence. Local resistance is a very key level to break as of now.
What are your thoughts?
Please leave a like and comment,
And remember,
“You have power over how you'll respond to uncertainty.”
― Yvan Byeajee,

I DON'T KNOW HOW YOU CAN BE BEARISH ON XRPHi traders today I made the simplest chart I could. Simply stated how could you be bearish on xrp? Two year downtrend was just broken. I purposely didn't add levels just to be simple, but we accumulated for 2 weeks then we had a huge breakout. This could be another fake breakout but i hope not, still bullish until be break below this trend line.

$XRP vs $BTC $XRPBTC (Update) Not A Hero
Weekly (Zoomed Out)
XRP continuing to respect descending channel, stochastic rsi showing momentum to the downside is slowing down. Price is currently testing our uptrend line for confirmation, a closer look will give us a better idea. Every time XRP breaks out of a descending pattern we see a short climb towards the upside.
Weekly (Zoomed In)
Zooming in on our weekly we see this week we see price tested our dynamic resistance of the descending channel. Expecting a follow up with the upcoming week, this is an ideal zone for a double bottom. A push towards the upside from here could lead us to 0.00004000 satoshis. Rejection from this dynamic resistance could send XRP to the 0.00002000 zones.
Daily
Shifting to our pattern timeframe we see our daily candles showing support at 0.00002500, stochastic rsi showing momentum looking to shift towards the upside. The price showing bullish divergence, strong resistance at 0.00002900. Last time XRP was at this price we saw a jump from 0.00002400 all the way up to 0.00003700 giving us a 50% gain. Price action history shows us price tends to have the same behavior when major support/resistance is confirmed.
4Hour
Finally looking at the trigger timeframe we see the price now looking to head towards our dynamic resistance. Stochastic RSI showing momentum in favor of bulls. Firs tp looking like an 18% gain, a 4hour close above 0.00002600 activates trade. Rejection from this level and it could get ugly for XRP Fan Boys & Girls...

XRP on the daily chartXRP is set to test 0.2356 resistance if we fail we are likely to visit sub 0.1782


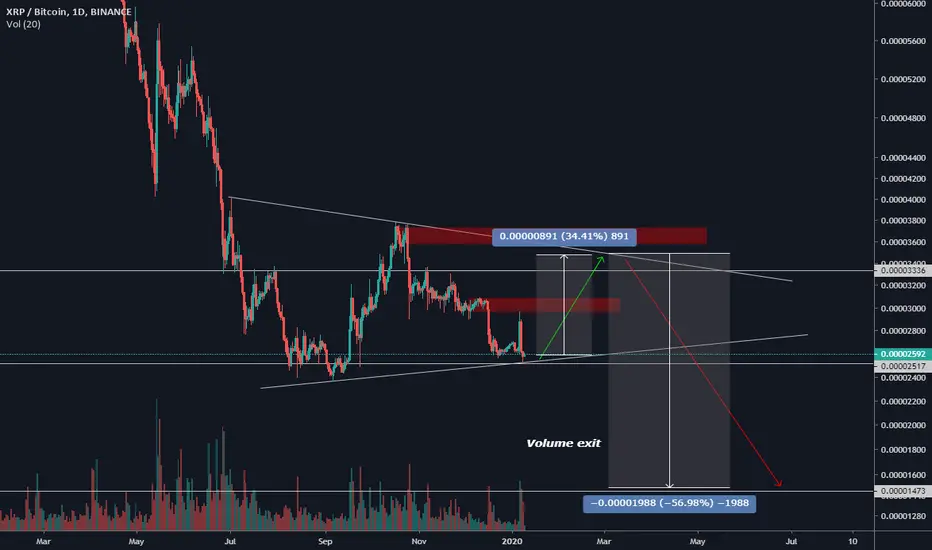
XRP. Symmetrical Triangle with breakout lower.Hello,
XRP formed Symmetrical Triangle.
Volume exit shows big sell of which was absorbed by bids.
Should hit key level before going up.
Bears still in, so be careful while Long bounces.
XRP v.s BTC 2020
Weekly (Zoomed Out)
Higher timeframe showing XRP continues respect it's downtrend since 2018 ATH. Stochastic RSI showing price in favor of the bears with no signs of slowing down. Price now looking to test it's All Time Low (ATL) *close of 0.00001500 satoshis. The trend is your friend until it bends.
Weekly (Zoomed In)
Sticking to our pattern timeframe with a closer look at more recent price action shows XRP now respecting a descending wedge pattern. Price is currently testing what could be the (3rd) bounce of our uptrend or continue falling to our next major support at 0.00001759. Another scenario is a double bottom forming at our current level of 0.0002500, however no signs of reversal just yet.
Daily
Shifting to our pattern timeframe we see XRP formed a higher low at 0.00002800 which could lead to a lower low. Stochastic RSI showing a double top and we should see momentum to continue towards the downside. Our pattern timeframe shows our next following dynamic support is at 0.00002500, however, our next major support isn't until the 0.00001750. Aggressive sell entry is triggered with a daily close below 0.00002550. An aggressive buy entry would be triggered with a daily close 0.00002600. In conclusion, these charts show 2020 will be dominated by BTC, however that can change quickly in the crypto space.
The Content is for informational purposes only, you should not construe any such information or other material as legal, tax, investment, financial, or other advice.

XRP on the daily chartHuge candle to break, if we break this we are in for a ballistic run to a new ATH at 0doubt.


XRP similarities with BTC bear... its nearly timeI try not to post charts making calls for long or short, but this XRP chart looks ripe. We have had that sentiment-obliterating drop and the XRP army looks decimated. Selling pressure has been enormous, and it feels to many like all hope is lost.
This is the time to buy. I see many similarities between the BTC bear market and XRP here, and it seems as though XRP is printing a beautiful bottoming formation, having bounced off 17 cents and holding around 19 cents for the past couple weeks.
Look for XRP to shake things up in January/February.
-Baylor

XRP entry updateBack above major support and back into supply zone for xrp. Target entries have changed. Still waiting for a bit more confirmation before putting physical orders in.

XRP preparing for a move! long term: SHORT, short term: LONGXRP went downwards since July.
XRP and its SMA's behaved similary from July to September '19.
XRP going sideways for the last 2 weeks.
Major support at 0.15$.
50 SMA still under 200SMA.
Momentum at approx. 0.
RSI at around 40 and lower on larger timeframes.
So for the short timeframe i see XRP at around 0.21$ or even 0.25$ (within a week or 10 days) like it did in September but then it all depends on BTC: If BTC decides not to dumb in mid-january like it used to do the last 3 years, we might start a new uptrend.
If BTC dumps we might fall back to 0.15$. We know the (pretty consistent) mid-january pattern so IMO the burden of proof is on the bulls to convince the bears why XRP or BTC or both wont dump.


XRP - Monthly Chart - Bullish Divergence - Plus Token Ponzi - I know it has been really rough holding XRP in 2019 while watching other coins go up. Honestly, most of the charts look horrible for XRP and what I found here is the only hopium I can find for now. Also, I will discuss why the Plus Token ponzi scheme is relevant to XRP as well, which is very important as most people are unaware.
MUST KNOW - PLUS TOKEN PUMP:
- For those that don't know, there was a ponzi scheme called Plus Token that bought over 3 billion dollars worth of BTC, ETH and EOS back in the spring of 2019. This most likely caused the run-up to $14k for the BTC price and the highs in 2019 of ETH & EOS at the time. The ponzi collapsed on the day BTC reached it's 14k ish high. Most people don't know this and it is extremely important to know that the bear market is still very much here. It is also important to know that this reason is why consumer FOMO was created on those said coins while XRP continued its bear market.
MFI TECHNICAL ANALYSIS:
1) Yellow circles, I drew these on the MFI to signify its double bottom, which can be bullish in the long run. As you can see we bounced off this point for now.
2) There is a massive bullish divergence when comparing the MFI and price action on the XRP chart. Bullish divergences play out all the time in long-time crypto charts, so who knows what will happen next. I drew the lines on the MFI and price action to indicate this.

XRP / BTC Potential reversal coming! What's up Cryptoland? (coolest people on the entire planet)
I have been doing som fractal comparing.
I see some similarities between 2018 Bitcoin and XRP's current state of affairs.
I totally expect another dip toward 12 cents (fueling the capitulation similar to when Bitcoin went to 3.2k)
I will be watching for it to making an accumulation pattern and higher low higher high pattern ( Just like bitcoin did) and buy when I see strength coming back.
The pure fear in this market should produce some nice profits!
(THIS IS NOT A EXACT MAP OF WHAT WILL HAPPEN BUT RATHER A POTENTIAL TRADING PLAN FOR FUTURE PRICE ACTION)
- Stay profitable out there.
- Dalin

Bitcoin forcast into 2020Created demand around 7000 allowing retracement into unfilled supply zone at 9000. from there we are going to continue down trend into mass demand range of 5000

INTERESTING DAYS FOR RIPPLE..BEARS LOOSE DRIVE, BULLS ARE HIDDENTHIS WEEKEND IS END'S PERFECT CUP FORMATION.
RIPPLE MISSED TO RECOVER IN PRICE $ AND SATOSHI VALUE.
COMINGS DAY'S AND WEEKS UNTIL NEW YEAR CAN BE A GOOD TIMING FOR x2-3 for Ripple,xrp.
Else we will see easy COLLAPSE RANGE 0.15$
IF SMALL INVESTORS LOOSE HERE HIS BELIEVENES ON XRP AND WHALES, PUMP GROUPS JUMP IN, YOU WILL SEE ALSO PUMP BUT IT WILL END WITH 0.01-0.05$ XRP PRICE IN COMING YEAR.
btw, i'm not a ripple xrp army moon boy. i get rekt many times with xrp.

DON'T GET RICH WITH BUYING XRP, STAY RICH WITH SELLING ITXRP IS NOW A HUGE SELL FOR ANY HOLDER!
IT'S BETTER HOLDING BTC UNTIL SUMMER 2020 HALVING.
EASIER x2-5 opp. with btc and xrp will loose more value!
SELL IT AND STAY RICH!
RIPPLE CTO, CEO everyone selling now.


XRP Ripple - Success or Disaster?Historically XRP has acted as a hedge against BTC. But in more recent times, Ripples movement has left us hesitant. In this chart we can see XRP at support in this 4H channel. A move up could indicate a push to test the 4000 Satoshi range. And a break down of support can send us down another leg to the mid 2500 Sats range. We must wait for continuation up for us to enter, or we may enter and use SL at a breach of support here shown in this chart. I stand neutral until confirmation.

Example of cryptocurrency market infancyWe are currently still in the infancy of the cryptocurrency market, as the market matures more coins will die off, fundamentals will become more prominent during evaluation and new trends within culture will emerge, including cryptocurrency. Often this infancy is compared to the dot com bubble which it is very much alike. This infancy is a direct contributor to the volatility and unpredictable nature of many coins, and most of the time this volatility is dependent on speculation. Once VERY clear leaders emerge (bitcoin, Eth, XRP at the current time) volatility will slow, and more growth will be seen as more confident investors enter the space.
Leave comments below I would love to hear your feedback, (what else I could have included).
