XRP WeeklyHere there is just one thing to consider, how the market is doing. How the market is doing now and what is doing now reveals what comes next.
XRP went bullish in late 2024. It reached a new level in November 2024 and then stopped growing. It did not start a bearish impulse nor bear market but simply stopped growing.
This pause is the market consolidating, building up strength before additional growth. Pretty simple right? I think we can all easily agree.
Up and down. Up in December, up in January and then down until April.
Come 7-April, the action has been bullish. Prices have been rising ever since, week after week. What is happening now reveals what will happen next.
The market went from a peak to sideways, to slow and steady growth. Building up strength before the next major bullish jump. XRPUSDT is going up. It will grow, mark my words.
Namaste.
Xrp

Ripple Potential UpsidesHey Traders, in today's trading session we are monitoring XRP/USDT for a buying opportunity around 2.50 zone, XRP/USDT is trading in an uptrend and currently is in a correction phase in which it is approaching the trend at 2.50 support and resistance area.
Trade safe, Joe.

Just get the crypto $total to 10T alreadybig grid shows massive upside inbound, cryptoad says we just had nearly all of 2025 to accumulate before a massive liquidity injection that will push the entire crypto market towards 10T mcap!

XRP to $11XRP has a lot of patterns and things to show us the price about $11.
The first pattern is the double bottom on weekly from 2018 till now, and the target of that is $11. The second thing is the Fibonacci extension for the 100% movement of the recent movement on XRP from November 2024, and that is $11.
The last pattern is the bull flag that XRP made recently and the target of that is $11.

"XRP - Time to buy again!" (Update)Finally, this pattern was broken and had a positive impact, leading to significant growth. Now, with a slight price correction, higher price levels can be reached.
PREVIOUS ANALYSIS
Stay Awesome , CobraVanguard

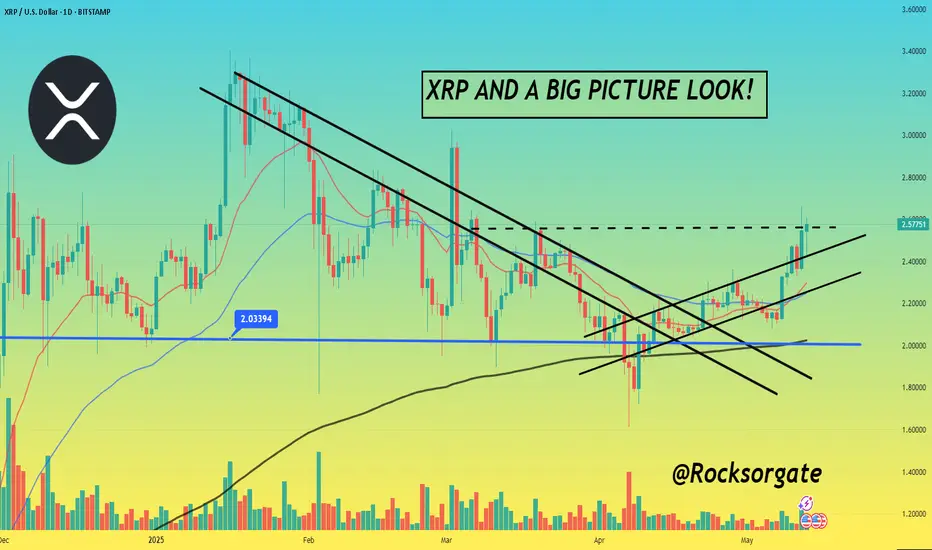
XRP AND A BIG PICTURE LOOK!🥂 Hey hey, hope everyone's doing well! Great to see how things have been moving this week for the market as a whole, especially for digital assets with XRP leading the pact, been a while since we did a big picture look at our technical so figured we'd do a quick update and as always thanks for giving me a few minutes of your day.
🥂 First thing off the bat is XRP breaking $2.5, in our latest idea we spoke on XRP and we're watching for a retest of that $2.48-5 level which proved to be successful and we kept within our ascending channel even breaking out of it as I'll show in the chart below on the hourly time frame:
🥂 So not only did we keep within the ascending channel but we broke out of it and have kind of formed this new channel which is gonna gave a much better look on the shorter time frames now that we know we can watch this for bullish or bearish trends, pivots.
🥂 Main challenge on the hourly is to keep above that channel and if we do retrace and enter the channel next goal would then be to avoid falling out of that channel, keep pushing much like we did with our ascending channel that helped us get the confirmation we wanted and see that $2.5 successfully get retested and beat.
🥂 Next thing up is our chart below, I went ahead and added a Fib. Retracement to give us some clarity on where we stand right now for a big picture view and we can see that as we stand right now, we're at this pivot basically. $2.5 is that make or break it point so now we'll have to see if bulls can sustain enough pressure to keep above $2.5.
🥂 One good thing to note is that each time we retest these levels we have more and more support and positive sentiment behind XRP and Ripple which continues to build and form partnerships thus every time we hit these levels there are more and more people and financial institutions that believe in XRP and the coin only grows stronger with every retest and with each and every single day.
🥂 Whether we keep the pressure and break, keep pushing upwards or retrace and fall back the same fact will stand true, XRP will continue to build it's backing and continue working towards it's goals and cementing itself in the future as we know it. I can definitely see XRP hitting $3-5 within the next few months if the company keeps playing it's cards right and the SEC approves a Spot XRP ETF which would be a solid win to say in the least.
🥂 Definitely keep all this in mind and feel free to add to your own charts, we're at a pivot point on the daily and for the hourly I would watch those channel's and that EMA, that's about the main things for right now.
🥂 And as always, thank you so much for the support, really appreciate it and hope everyone's having a great day, and many blessings, let's keep at it and stay tuned for more!
Best regards,
~ Rock'
XRP Inverted Head and Shoulders – Watching for Resistance!🚀 CRYPTOCAP:XRP Inverted Head and Shoulders – Watching for Resistance! 📈
CRYPTOCAP:XRP has formed an inverted head and shoulders pattern and has broken out of the neckline (purple zone). However, we’re approaching a red resistance zone, and when the price reaches this level, there could be some retracement before continuing upward. 📊
Let’s monitor this move closely! 💼💸

Spotlight on the 2.30 SupportXRP is currently exhibiting signs of upward momentum. The 2.30 zone has acted as a valid support area, with notable price reaction around this level. If the current structure holds, a movement toward the 2.50 region is possible.

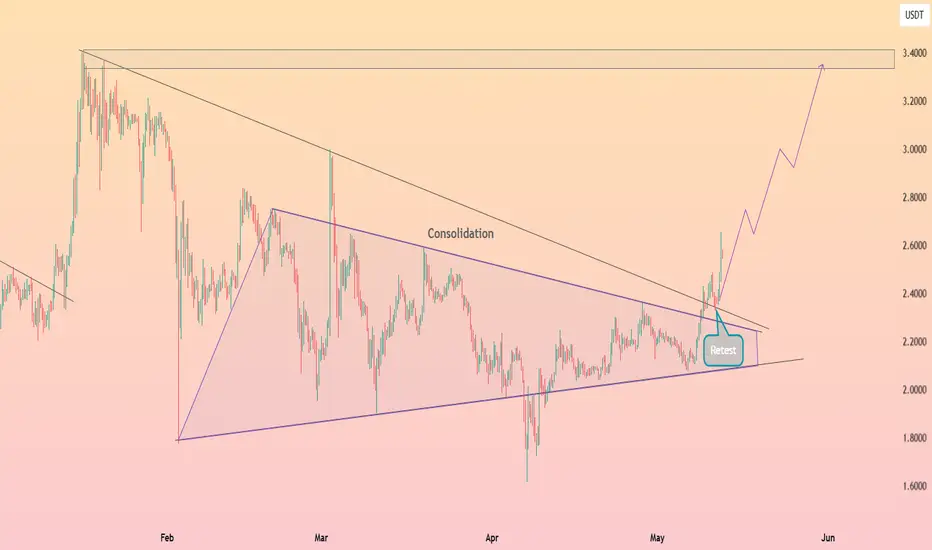
HolderStat┆XRPUSD broke the downtrend📈 XRP compressed for weeks inside a contracting triangle, posting a series of higher lows beneath a stubborn down‑sloping ceiling. Early May produced the decisive break, with price flipping the 2.3‑2.4 zone and immediately returning for a clean retest that held on a dime. The pattern implies energy is stored for a measured move toward the 3.4 resistance band highlighted on the chart; invalidation rests beneath the reclaimed trendline, keeping risk tight.
Ripple is Nearing an Important Support!!! Hey Traders, in today's trading session we are monitoring XRPUSDT for a buying opportunity around 2.17 zone, Ripple is trading in an uptrend and currently is in a correction phase in which it is approaching the trend at 2.17 support and resistance area.
Trade safe, Joe.

XRP Next Target, How To Approach The Targets, Resistance TradingThe action never happens in just one go it happens step by step. The next advance is confirmed, XRPUSDT today resumes growing (bullish continuation).
The first target is a very easy target but there can still be a stop at this level. This target sits at $3.01 and remains within a lower high compared 16-January 2025. This would be the "easy target" for this current advance.
The main target 2-6 weeks in is $4.50. But there will definitely be some resistance around $3.40. This level was challenged only once and a strong correction followed. This means that on the way up XRPUSDT will make a pause and likely produce several attempts before breaking higher. This is good for two reasons:
1) The pause will give us time to open new positions and adapt to market conditions.
2) We know the $3.40 resistance will break beforehand so we can prepare and act accordingly. So it is a huge advantage knowing that this resistance level is strong.
The question mark though is how long it takes for the resistance to break. It doesn't matter. What matters is the right entry, later on the market can take as long as it wants to reach our targets. It is all good as long as it grows; all is well that ends well.
Everything is easy now because the bullish bias is fully confirmed. Before the recovery and breakout, we would have to make predictions and guess, doubt was still in the air. Currently, we simply buy and hold, we know that any retraces or corrections are just temporary and will always end up resulting in additional growth, for this reason, when prices move down we take it as an opportunity to rebuy and reload.
A portion should be sold each time a resistance level is hit. The market will always give time to buy back lower. This should only be done by those with experience and only when the resistance level is strong. Weak resistance levels should be ignored because the trading pairs can move straight up when challenging those.
We are ready, we are live —Crypto is going up.
The 2025 bull market is here. Wait until late May and see how positive-crazy everything will become. It will be the equivalent of a mini bull run, and it will continue go, on and on and on... It will seen like it has been going forever so much that we will become complacent at some point. When we become complacent and start counting our paper profits, the market will drop. But we know beforehand that this drop will end as a higher low followed by additional growth. Buy and hold.
Thanks a lot for your continued support.
Namaste.

XRP DISTRUPTS AND TAKES ON HEALTHCARE!⚕️ Hey hey, hope everyone is doing well, before I start just want to give thanks as always, appreciate the support and let's keep at it.
⚕️ First thing right off the bat is a pretty exciting development I'd say! In a crazy development Wellgistics Health made the announcement to integrate and incorporate the use of XRP into their company and infrastructure utilizing the digital currency as a treasury reserve as well as a form of real-time payments.
⚕️ This is the first time we're seeing a publicly traded company, not to mention a healthcare company integrate XRP this much into their infrastructure and system in such a manner highlighting their faith and confidence in the asset, In the announcement they highlighted many benefits and incentives such as the speed, noting XRP's settlement time of just 3-5 seconds as compared to traditional methods such as ACH and wire transfers which can take days.
⚕️ I could continue listing but I'll share the bullet points they made:
Speed: XRP settles transactions in 3-5 seconds vs. 1-3 days for ACH or wire transfers, allowing for near real-time settlement among pharmacies, suppliers, and manufacturers.
Cost: Less than $0.0002 per transfer vs. $10-$30 for standard bank wires.
Transparency: All transactions are logged on the XRP Ledger for real-time compliance, rebate tracking, and auditability.
Scope: Supports global vendor payouts with significantly low foreign exchange and wire transfer fees.
Flexibility: Allows for XRP-backed lines of credit to support independent pharmacy liquidity.
⚕️Welligstics Health then went on to add and highlight the use cases across the ecosystem as they put it:
Real-time settlement between pharmacies, suppliers, and manufacturers
Smart rebates calculated automatically based on real-world data
XRP-backed credit lines to enhance liquidity for independent pharmacies
Global vendor payouts with near-zero foreign transaction and wire costs
Immutable compliance layer supporting DSCSA reporting and pricing validation
“We’re working to unlock capital velocity with surgical precision,” said Mark DiSiena, CFO of Wellgistics Health. “We believe that our XRP-powered infrastructure will allow us to run leaner, faster, and with more control than any of our peers in pharma infrastructure.”
⚕️ I'll share the reference to the announcement for any that want to read more on it but just off these points alone we can see just how much the benefit and incentive is for the company to incorporate XRP into their infrastructure which would put them ahead of the competition, essentially making them the first movers. No doubt others will be looking to Wellgistics Health to see the impact this makes in the next few months for the company, especially for their balance sheets and should things play out well I don't see why other companies won't follow in suit. So definitely excited by this development. Now we're seeing real utility kick in and XRP's purpose and use case being put to the test on a real scale.
⚕️ For reference NASDAQ:WGRX is essentially a middleman and provider that supports a wide range of categories and services in the pharmaceutical sector, the main being pharmaceutical distribution, prescription technology, as well as clinical fulfillment in which Wellgistics connects over 150 direct manufacturer contracts to a network of over 6,000 independent pharmacies nationwide. So we've basically got this huge player in the industry picking XRP as an alternative and essentially reworking their infrastructure completely around this digital asset. There's no doubt they did their due diligence and I'm sure the results will be noticeable for the quarterly reports, especially when you consider how much the company will save on transaction fees for a company that primarily deals in transactions the difference is incalculable to say in the least against traditional methods.
⚕️ Here's a reference link to the announcement as well for anyone who would like to read further into things.
www.globenewswire.com
⚕️ We've spoken many times on XRP and how it's real use case and utility has yet to really be put to the test so seeing this will really give us some good data and insight on the asset's real use case and what kind of role it'll play in the future, as I noted, I'm sure other companies will be looking as well to see how everything plays out and more than likely, we'll get positive results and start seeing other companies in other sectors begin to incorporate XRP into their own infrastructures.
⚕️ That's the wonderful thing, XRP doesn't just work for one sector or one company, it has so many use cases and utility it can be scaled in many ways for many industries and I think the next few years will have us seeing this come into play without a doubt and XRP's real utility and role taking place and shape. After all, we're still basically just starting off still funny as it may sound.
⚕️ For technical we'll keep things quick first using the charts below for reference:
⚕️ Used a Fibonacci Retracement picking our lowest and highest price points which honestly gave some pretty good insight, we can see just how accurate price action matches our Fib and those horizontal levels giving us a clear picture of things.
⚕️ For this chart I simply changed the Fib to blue and added in our ascending and descending channel's to simplify things, we had that ascending channel help Bull's keep pushing but once we lost that channel and hit the $2.5 resistance we can see just how quick traders we're to take profit and in turn we fall out that chanel and formed the current descending channel we're in.
⚕️ For the last chart we took away the Fib and this is the barebone of stuff. Can see how we moved up within this channel and then started retracing once we tested that horizontal resistance level at $2.48-5 putting us in our current position in which Bull's will have to keep price above that Fib. level of $2.32 which would help us avoid falling back into that descending channel and losing the 200 EMA. So basically if we stay within the channel we'll fall further and if we can break out of it and avoid losing that 200 EMA then we get another shot to retest $2.48.
⚕️ I have to run but If you've made it this far I appreciate it as always and hope the read was a productive update and informative, feel free to follow and keep tuned for more as always and don't just make it a good day, make it a great one.
Best regards,
~ Rock '

Strange XRP SignalI say it is a strange signal but not in a bad way... Give me a few minutes of your time and just let me explain, ok?
The first peak happened in early December and then right away the candles are big. As the first low is hit in early December, the candles become big and prices move up.
Then there is a second peak mid-January and the candles become super big. "Big candles" as in high volatility, enormous price swings. With the market bearish, these swings continued until 7-April.
On the chart, there is a fair recovery and some growth and then comes this very strange signal, the candles become really small. 13-April through 21-April very small candles, low volatility; prices continue to grow.
Then again, 28-April, the last peak and volatility is almost zero. Seven days XRPUSDT moves lower but there is no new lows, the price remains strong. This is a bullish signal.
When the market was bearish, prices were moving down with force. Now the market is bullish confirmed because when resistance is hit, there is no bearish force, no bearish action no bearish momentum; just consolidation before additional growth.
A strange signal but in a good way.
Hold easy, XRP will resume growing in a matter of days.
Namaste.

Breakout Confirmed: XRP on the Move Toward $4+🚀 XRP Breakout Alert – 70% Potential Incoming?! 👀🔥
Hey Traders! If you're all about high-conviction plays and real alpha, smash that 👍 and tap Follow for more setups that actually deliver! 💹💯
📈 XRP/USDT – Breakout Alert! 🚀
XRP is breaking out from a long-term falling wedge pattern on the 12H timeframe, signaling the potential for a strong bullish move ahead!
🔹 Entry: CMP $2.39 – Add more up to $2.32
🔹 Targets:
• TP1: $2.85
• TP2: $3.32
• TP3: $3.78
• TP4: $4.13
🔻 Stop-Loss: $2.09
⚙️ Leverage: Up to 5x (Trade responsibly)
This structure mirrors the previous 70%+ pump from the same wedge formation. History might just be ready to repeat. 👀
Let’s ride this breakout with tight risk management! 💥

XRP CLIMBS AND A QUICK TECHNICAL🔥 Hey hey, hope all is well, been a few days and figured I'd chime in and we'd do a quick rundown on our technical and look into how our chart's currently playing out, this shouldn't take too long so feel free to join, thanks.
🔥 Right off the bad we can see how this sort of resistance level formed after we last got that channel rejection in April which ended up pushing us further down and down until bulls were able to break that level and get the much sought after breakout which in turn saw our 20,50 day EMA's finally converge which in turn led us to see bulls taking back that 200 EMA which only boosted things propelling us back up into our ascending channel.
🔥 We already know that ascending channel has been doing a lot for us the last few weeks, so it's fair to see that resistance hit again at $2.4 which in itself is a win considering we we're able to establish a higher high versus our last local high on the 28th in which the highest candle closed out at $2.33 so definitely gonna take this latest pull back up as a bullish win.
🔥 Main thing we'll have to watch for now is the bottom of our channel, we already know we'll likely see some price action start trading within the channel as both sides gear up for another tense battle but all of this is excluding a new exciting development for Ripple which I will get into with the next idea.
🔥 Just wanted to keep this idea simple and technical for our technical traders out there, watch that ascending channel and those EMA's. We've already discussed and focused on the fact that the EMA's are lagging indicators but the fact still stands they can give us good confirmation on the trend and it's direction so definitely keep those eyes peeled.
🔥 I've got to run but thanks for tuning in as always for a quick ta, really appreciate it and definitely keep tuned for that next idea with the new development, excited to post on that when I get back and as always, thanks for the support and let's keep our heads up.
Best regards,
~ Rock '

HolderStat┆XRPUSD symmetrical triangle breakout loadingXRP has been compressing in a large symmetrical triangle, with price now testing the upper trendline. A confirmed breakout above $2.40 could trigger a swift move toward the $3.40 zone, reclaiming the highs seen in previous bull runs.
💡 A clean breakout from consolidation signals building strength and renewed investor interest.

This Low Cap Alt will 20-50x (CULT DAO)This crypto cycle has been brutal for alts. There have been massive shakeouts over and over, a relentless onslaught of rug pulls and scams, and the "Pump.fun" casino on Solana that’s drained billions of retail liquidity and transferred it to the few.
The few always seem to win, and the many always seem to lose. Today, if you’re reading this, it might all change.
CULT DAO could easily 20-50x from now until October 2025. Let’s take a look at the MACD divergence.
### Technical Divergence
For 750 days, this bullish divergence has been forming on the histogram MACD. Every new low on price has formed a higher low on the MACD.
Let’s take a look at a case study of what happens when we get this form of divergence.
I traded this exact same pattern in 2022 that resulted in a nearly 425% move. The play function doesn’t work because they rebranded, and that ticker is no longer valid, but you can scroll to the bottom in my comments on that TA and see the move. I’ll post it under this as well.
As you can see, we got that 425% move. Currently, CULT DAO is showing exactly the same histogram divergence.
Here are some examples of zigzag impulses on low-cap alts. You tend not to get 5 waves; instead, you get this zigzag pattern. This is what I predict CULT DAO will do since it’s only a 5 million market cap.
We can also see in the chart that the 0.618 time Fibonacci level hits at the end of October 2025, which is exactly where I think the altcoin market will top. Check out previous TA on that.
This is only scratching the surface of what is to come for CULT DAO. I have presented to you the technical reason why a big move is stirring and why, at the apex of these divergences, the stars align, and you have the catalyst present itself, and boom—the explosive move comes all at once, and it will be extremely volatile because of its low market cap.
### Let’s Start with the Tokenomics
Every time someone sells or buys CULT DAO on Uniswap, there is a 0.40% tax that goes to a treasury. The top 50 stakers get to pass proposals that fund projects/investments. The idea is to remove the centralized component of funding a project.
121 projects have been funded over the last three years with 3 million dollars.
- Total CULT Funded: 479,751,081,214 CULT
- Total ETH Funded: 1,573 ETH
- Proposals Funded: 121
- Total USD Funded: $3,289,596
- Total ETH Burned: 303 ETH
Allocating these funds has been a learning process over the last three years, but every failure has been necessary in preparing the DAO for what’s to come next.
### The Big Catalyst
The creator of CULT DAO has been working on a blockchain that will function on a custom gas token—that’s right, and that custom token will be CULT DAO. You heard correctly.
Every transaction, every deployment on the blockchain will require the CULT DAO token as gas to execute. The implications are massive. There are multiple dApps that are currently being constructed on the Modulus blockchain.
A privacy-first zkEVM blockchain like Modulus means a scalable, Ethereum-compatible blockchain that prioritizes user privacy through zero-knowledge proofs, allowing optional private transactions while maintaining decentralization.
Modulus is a privacy-first zkEVM blockchain and is scheduled to release this year between April and August 2025. I hope now you’re starting to see the picture.
### CULT DAO and ETH Liquidity Pools
So, why does the price of CULT go down if there is currently very little volume? Well, CULT DAO and ETH liquidity pools are tied together, so if the ETH price goes down, so does CULT. In turn, if ETH goes up, so does CULT.
You can see that CULT is nearly at a 1:1 ratio with ETH for now, coming in at a 0.91 ratio.
In other words, if my thesis is correct about ETH and it goes to 15,000 dollars, the price of CULT would be as follows:
- ETH at $10,000:
CULT Price: $0.000005008 (4x increase).
Market Cap: $21.38M (4x increase).
- ETH at $15,000:
CULT Price: $0.000007512 (6x increase).
Market Cap: $32.08M (6x increase).
That’s right—if nobody even bought CULT, not one dollar, the base liquidity increase of ETH would bring the market cap to possibly 32 million, in other words, if you were thinking of buying ETH, why don’t you just buy CULT DAO?
You can buy ETH now; from this price, 15,000 is 7x, or you can buy CULT DAO, get 6x plus whatever extra volume is coming in. It seems like a logical play, really.
Everything you’ve seen so far is why I believe this MACD histogram divergence has been forming for 750 days. As I said, the stars will align at the apex, and the explosion will come.
### Unruggable and No Whales Controlling Supply
As you can see from the bubble map, the largest wallet that is not an exchange has a cluster total of 0.7%. The rest of the clusters you see in the image are basically exchange wallets, which are the red and dark green circles mostly.
Liquidity is also locked for over 200 years.
- Burned Supply = 1.29664T
- Circulating Supply (including staked) = 4.27T
- Staked Supply = 1.07599T
- Remaining Tradable Supply (excluding burned and staked) = 4.27T - 1.29664T - 1.07599T ≈ 1.89737T
So, no whales, and it’s not possible to rug because liquidity is locked.
### Modulus Blockchain Liquidity Injection
The average liquidity injection for DAOs in ZK would be anything from 200,000 to 10 million. Let’s assume it’s a $1M injection that is split 50/50 between CULT and ETH, a common practice for Uniswap-style pools.
- CULT Amount in Pool: At the current price of $0.000001252, $500,000 buys ~399.36B CULT ($500,000 ÷ $0.000001252).
It would increase the price to a 10 million market cap overnight.
### Conclusion
- Liquidity is locked for 200 years
- No whales
- Not possible to rug
- Mainnet launching this year
- ETH pools tied to CULT
- MACD histogram divergence
The target I have for CULT is just based on Fibonacci levels. Honestly, it’s unpredictable what will happen, how high it will go, or the impact the Modulus chain will have. 120 million is my low-end estimate; the macro Fibonacci is much higher.
The last extension puts it at a 1.4 billion market cap and 266x from where we are now.
This is where you want to be for the upcoming alt season—right here, down 98% with this massive divergence and all these factors that come into play. Just the mainnet launch and ETH going to 10,000 basically sends this to a 30-50 million market cap.
Cult DAO and Satoshi Nakamoto share a common ethos of decentralization and anti-centralization. We need to embrace this notion and bring back the power to the many. If CULT DAO hits 1.4 billion dollars, the treasury funds would be in the millions; we fund our own future.
moduluszk.io
cultdao.io
cultdao.io
coinmarketcap.com

XRP: $0.30 ---> $0.20 ---> 14.00 this animal rewards STRONG HANDS since inception or day 1
a weak hand will never make it alive come redemption day
bear in mind that CLINTON FUND and STANFORD group are on board heavily
--
good lucks holders... neophytes just size your entries very well
this is a SLEEPING DRAGON ... or pretending to be sleeping since forver

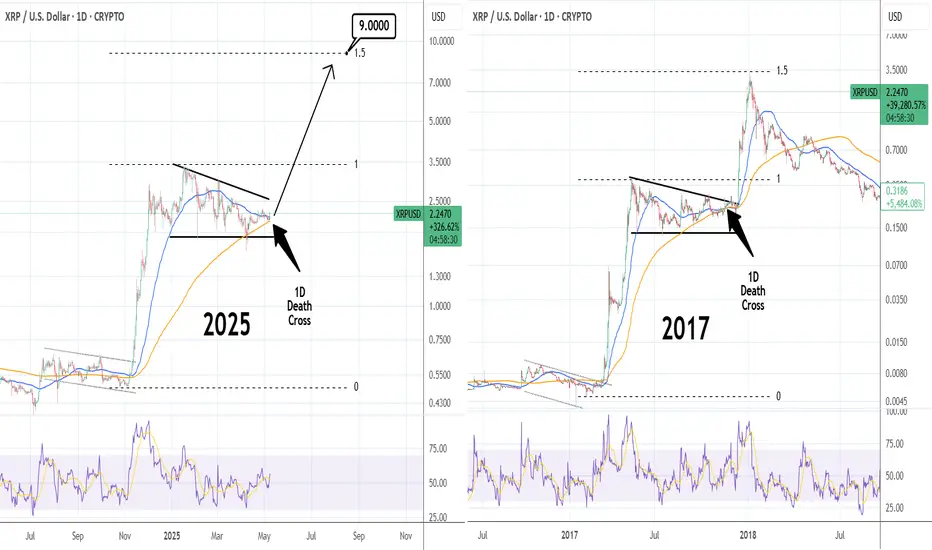
XRPUSD: Can this 1D Death Cross push it to $9.000? XRP is neutral on its 1W technical outlook (RSI = 54.799, MACD = 0.197, ADX = 30.423) which showcases the strong upside potential of the coin. 1D is about to form a 1D Death Cross, the first in over 1 year and even though it is technically a bearish pattern, this time it may work in Ripple's favor. At least that's what happened in November 2017, when the market was coming out of a similar Descending Triangle like this year's (2025). The rally that followed topped on the 1.5 Fibonacci extension. It is possible to see it hit the new 1.5 Fib (TP = 9.000) before the year ends given enough institutional involvement.
## If you like our free content follow our profile to get more daily ideas. ##
## Comments and likes are greatly appreciated. ##
Crypto update for 2025.05.08A quick little technical crypto update for 2025.05.08.
Let us know what you think.
CRYPTO:BTCUSD
CRYPTO:BCHUSD
CRYPTO:ETHUSD
CRYPTO:XRPUSD
CRYPTO:DOGEUSD
CRYPTO:DOTUSD
CRYPTO:TRXUSD
Let us know what you think in the comments below.
Thank you.
77.3% of retail investor accounts lose money when trading CFDs with this provider. You should consider whether you understand how CFDs work and whether you can afford to take the high risk of losing your money. Past performance is not necessarily indicative of future results. The value of investments may fall as well as rise and the investor may not get back the amount initially invested. This content is not intended for nor applicable to residents of the UK. Cryptocurrency CFDs and spread bets are restricted in the UK for all retail clients.

XRP Breaks Down from Rising Wedge – Is a Deeper Pullback Coming?XRP has officially broken down from a rising wedge pattern on the daily chart, closing below its lower trendline support. This could signal the beginning of a short-term bearish phase unless key support levels hold up.
Chart Breakdown
On the daily timeframe, XRP was trading within a rising wedge—a pattern typically considered bearish when it breaks to the downside. The breakdown came after price failed to reclaim the $2.30–$2.35 resistance zone, followed by a sharp move lower toward the $2.00 level.
Key technicals:
200-day EMA (blue line) is now acting as the first major support near $2.00
50-day EMA (purple) has turned into resistance
Price is hovering around $2.15, retesting the wedge from below
Bearish Price Targets
With the wedge breakdown confirmed, here are potential downside levels to watch:
$2.00 – Psychological level and strong dynamic support from the 200 EMA
$1.89 – Horizontal support from late March
$1.64–$1.61 – A critical support zone that marked the low before the last rally
If XRP fails to hold above $2.00 and closes below it, momentum could shift strongly in favor of the bears.
Bullish Scenario?
While the pattern suggests bearish momentum, bulls could still regain control if XRP closes back above $2.20 and re-enters the wedge. That would invalidate the breakdown and potentially open the door back toward $2.35 and higher.
Final Thoughts
The wedge breakdown is a warning sign for short-term traders. Unless XRP reclaims key levels quickly, it could be headed toward the $1.89–$1.64 support range. Keep an eye on volume and EMA support—these will likely determine if this is just a dip or the start of a larger correction.

XRPUSDT on the Edge: Is a Major Breakdown Coming? Yello Paradisers! Are you ready for what could be a huge bearish trap unfolding right now on XRPUSDT?
💎Currently, XRPUSDT is flashing serious warning signs. The formation of a rising wedge pattern is significantly increasing the probability of a bearish move. When analyzing the broader market structure, it appears this recent uptick is merely a retracement within the larger bearish trend—keeping the probability on the bearish side still very high.
💎If XRPUSDT bounces, grabs liquidity and starts forming clear bearish patterns from that resistance area, it could set up an excellent opportunity with a high risk-to-reward (RR) ratio for shorts.
💎However, if the price breaks out and closes a candle clearly above the resistance zone, our bearish thesis will be invalidated. In that case, it would be much smarter to stay patient and wait for a more reliable price action setup before considering any new trades.
🎖Remember Paradisers, the key to surviving and thriving in this market is to stay disciplined, patient, and smart. Trade what you see, not what you feel! Stick to the plan, and never rush decisions under emotional pressure. Play it safe, and stay focused—our time will come!
MyCryptoParadise
iFeel the success🌴

XRP Daily Analysis | Key Levels and Market Outlook 👀 Welcome to my Trading View Analysis and Trading Channel Here , we share the latest market analysis, trading signals, and key insights together .
Ready for smarter trades ? ⭐️
⚡️Today , we're going to analyze the XRP( Ripple ) coin together on the daily timeframe and find triggers for our positions .
🔺 XRP Daily Chart – Resistance Test Ahead
On the daily timeframe, XRP is currently facing a significant resistance zone near $2.30. A confirmed breakout above this level could signal a strong opportunity for a long position. Keep an eye out for volume confirmation and price structure validation. 📈
📉 Moving Averages & Pullback Watch
Currently, the price is closing below the 50 & 100 MAs, which is a bearish signal in the short term. This setup suggests a potential pullback before any continuation upward.
Key support to monitor: $2.06 — a likely bounce zone if bearish pressure increases. 🧭
📊 Volume Strength & Fundamental Momentum
One positive signal is the increasing trading volume, hinting at growing interest and potential volatility. On the fundamental side, recent news surrounding Ripple has been encouraging and may support bullish sentiment moving forward. 📰
🧠 Summary
XRP is at a key decision point. A break and close above $2.30 with strong volume could indicate bullish continuation. If the breakout fails, watch $2.06 as the next strong support.
Stick to your strategy, manage your risk, and stay updated. 📌💼
📰 Weekly XRP News Recap
Here are the major Ripple (XRP) updates you need to know:
💰 $10.5M in weekly inflows, making XRP the 5th most invested crypto last week.
🌐 DFSA License Approved – Ripple becomes the first blockchain firm with approval from the Dubai Financial Services Authority.
📅 CME to Launch XRP Futures starting May 19, 2025, adding more institutional exposure.
⚖️ SEC lawsuit dismissed – removing a key uncertainty for Ripple’s future.
📈 Growing volume & positive sentiment suggest potential price momentum in the short-to-mid term.
I love you all so much . 👀
don't forget about capital management and risk management .
Be careful with your positions . 🥇
