Bullish XRP - XRP/BTC Chart - 1 Month Time FrameThere are 2 chart patterns coinciding on the XRP/BTC chart for the monthly time frame.
Pattern #1:
Falling Wedge pattern with a target of 0.00010612
Target = 398% Increase
Pattern #2:
Double Bottom pattern with target of 0.00007199
Target = 269% Increase
Note: This is very reliable trade since it's the monthly TF, but it could also take very long to play out. Expect XRP to catch up to Bitcoin in the coming weeks or months!
Xrp

XRP Roadmap!!!(Short-term)I hope you had a good weekend .
According to the news about XRP , I decided to share an analysis of it with you today.
So stay with me.
Ripple is planning to launch RLUSD Stablecoin on December 4th , which increased the price of the XRP( BINANCE:XRPUSDT ) token.
" Ripple is set to release RLUSD, a stablecoin backed by NYDFS approval. This strategic move enhances Ripple's foothold in regulated digital finance and strengthens its position in the stablecoin market, challenging giants like USDC.
RLUSD will provide a stable pairing for XRP amid Ripple’s ongoing legal battles.
Partners like Bitstamp, Moonpay, and Uphold are on board, ensuring compliance with top-tier transparency and security standards. "
Of course, we should be careful with this proverb: " Buy the Rumor, Sell the News ", of course, it depends on the cryptocurrency market conditions on December 4th , if the crypto market is bullish on December 4th , we can expect the continuation of the upward trend of XRP.
Now, let's go to the Technical Analysis of XRP .
XRP is currently moving in a Heavy Resistance zone($2.00-$1.50) and has so far failed to make a new All-Time High(ATH) (on the Binance exchange ).
Also, from the point of view of Classic Technical Analysis , it seems that XRP is moving inside an Ascending Triangle .
According to Elliott wave theory , XRP is completing microwave 4 of microwave 5 of main wave 3 .
I expect XRP to drop( -7% ) to at least the Potential Reversal Zone(PRZ) , Uptrend line , and 100_SMA(4H-TF) after breaking the lower line of the ascending triangle pattern .
🙏Please respect each other's ideas and express them politely if you agree or disagree.🙏
⚠️Note: If XRP can break the Heavy Resistance zone($2.00-$1.50), we can expect more XRP pump.⚠️
⚠️Note: If XRP goes below PRZ and Uptrend line, there is a higher possibility of a decrease.⚠️
⚠️Note: If XRP goes below $1.50, we can expect more dumps.⚠️
XRP Analyze (XRPUSDT), 1-hour time frame⏰.
🔔Be sure to follow the updated ideas.🔔
Do not forget to put Stop loss for your positions (For every position you want to open).
Please follow your strategy and updates; this is just my Idea, and I will gladly see your ideas in this post.
Please do not forget the ✅' like '✅ button 🙏😊 & Share it with your friends; thanks, and Trade safe.

XRP Market Cap Creates New All Time High; Likely to ContinueImpressive. Market cap in November alone has gone on to gain 326%. XRP went from the number 8 spot back up to the number 3 spot with extreme swiftness.

XRPUSDWe will see a boost towards the uptrend. we have retest the level. be patience and you will be happy with the result. my upside target is 5$ by the end of the January or maybe more then 8 to 10$.

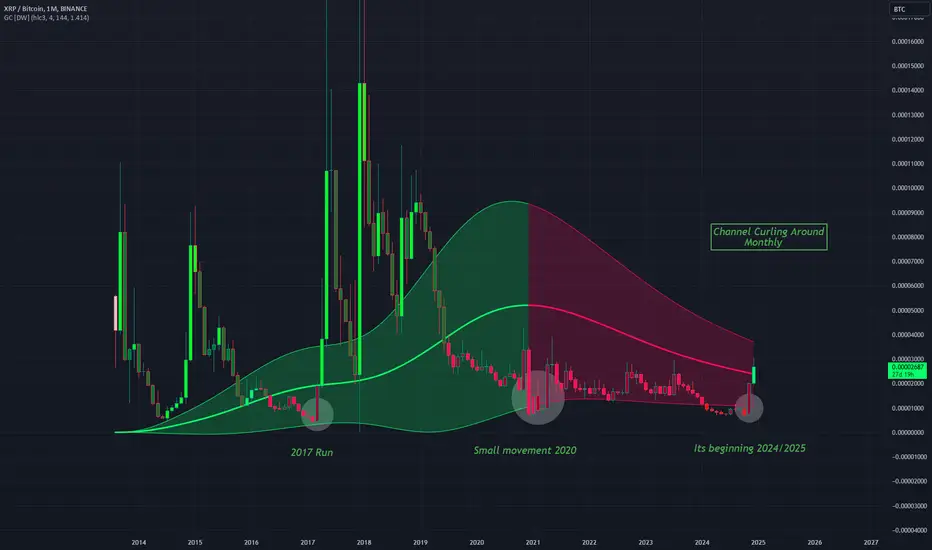
XRPBTC - A Look At the Gaussian ChannelThe Monthly channel is slowly curling itself around as the bulls gain momentum
As this turns green this channel, the bulls will come back with force.
I'm bullish on XRP right now and think we will see the run very soon.
All the significant runs have occurred when the bottom of the Channel has been touched.
XRPBTC - 2802 Day Bear Market As of now we have seen one of the largest moves since the 2017 run on XRP
Price on this chart has barely even moved relatively to the 2017 run, suggesting that XRPUSD has a lot of steam left.
A very bullish state for XRP.
2802 days since we have seen action like this!
I'm not including the 2020 / 2021 run as it was a false run in a way for XRP which is also evident on this chart.


XRP - STATISTICALLY THIS IS IT - CryptoManiac101XRP / USD TA
Here I'm just taking a quick look at the historic time frame of how long XRP takes on its parabolic runs and if you take a look, most bullish hyper cycles only last between 25 - 42 - 77 Days. In short, every hyper lasted between 1 and 2 months.
What does it mean for us today?
Currently we are approximately 28/30 days into the bullish hyper cycle, which, if we were to repeat history again, we only have a maximum of maybe 1 more bullish month before this hyper cycle exhausts itself and goes into a consolidation or retracement.
I believe December to be a very bullish month for crypto, especially XRP and January to possibly be a month of consolidation.
Do I see XRP having a second or third hyper cycle thereafter? Possibly, but it's hard to tell at this time. You hear many scream about a 1 or 2 year bull cycle. I personally, don't see that happening and would be extremely cautious around January to mid March, if not earlier.
With that said, I'm still extremely bullish on the market and will remain so for at least throughout the December month. Let's see what happens next!
This is not financial advice and solely for entertainment purposes only.

XRP/USDT: Local Correction or Springboard to $3?Hi there! 👋
Let’s dive into the XRP/USDT chart, which has been drawing attention with its strong bullish momentum but is now showing the first signs of a possible correction. Let’s break it down! 🧐
🖼 Overall Picture
The chart shows a clear uptrend, which has pushed XRP to a local high of $2.70. However, the market looks slightly overheated, and a correction to key support levels seems likely.
Globally, XRP remains in a bullish trend, supported by positive sentiment and broader crypto market growth.
📈 Technical Analysis (Using Midas Up/Down)
Key Support Levels:
1️⃣ $2.20–2.30 : Local support, a potential zone for entries during a pullback.
2️⃣ $1.80–2.00 : Major support zone, aligned with high volume levels (Volume Profile) and a strong trendline.
Resistance:
$2.60–2.70 : A local profit-taking zone. Price has already rejected this level twice.
$3.00 : The next major target if the current highs are broken.
🛠 What Indicators Say:
RSI (4H) : Still in overbought territory, signaling potential for a correction.
MACD (4H) : Shows slowing momentum as the histogram shrinks, indicating the market is preparing for a pullback.
MACD (1W) : Remains firmly bullish on the weekly timeframe, confirming the strength of the long-term trend.
🗺 Scenarios
1️⃣ Bullish Scenario:
Price holds the $2.20–2.30 support zone and returns to test $2.70.
A breakout above $2.70 opens the path to $3.00 and potentially $3.50.
2️⃣ Bearish Scenario:
Price breaks below $2.20 and tests the $1.80–2.00 support zone.
If this level holds, it presents an excellent low-risk entry point for buyers.
🎯 Trading Strategy
Short-Term (Swing Trading):
Entries:
1️⃣ Around $2.20–2.30 on a local pullback.
2️⃣ Safer entry: $1.80–2.00.
Targets:
1️⃣ $2.60–2.70 — for partial profit-taking.
2️⃣ $3.00 — main target.
Stop-Loss:
Aggressive: Below $2.10.
Conservative: Below $1.80.
Medium-Term:
Buy in the $1.80–2.00 range with the aim to hold until $3.00+.
⚠️ Risks
Breaking below $1.80 could accelerate a drop to $1.50.
The overall market is volatile, so keep an eye on broader trends and adjust positions accordingly.
🚀 Conclusion
XRP continues to delight bulls, but a local correction is likely. The $2.20–2.30 and $1.80–2.00 levels look like great zones for re-entry or scaling in. If the price breaks $2.70, the target of $3.00 becomes realistic. Stay sharp! 💪
💬 What do you think about this scenario? Got any ideas or feedback? Drop your thoughts in the comments, and let’s discuss! 👇
📊 Follow me for more updates and in-depth analysis! 😊

XRP - Journey to $15 or $5 first?Whatever I say may sound dumb, but even $15 is achievable but on a contrast tomorrow? friday? next week? Next year? approx by 17th September 2024, How? You will see it, Squeezed like lemons and followed as said, It follows me alot haha as of now aiming for 3.25

XRP - i think we are close to TOP. XRP - i think we are close to TOP.
In many cases when i saw parabolic move and BIG volume - it was start of big range or trend reversal
In a video you`ll see 2 examples. I called them
BTC scenario and NOT
which one do u prefer?

Potential Path for $XRPIdeally, I would love to see something like this play out for $XRP.
I know it loves to climb without much cooling off, but it does need some healthy retracement to keep the expansion more sustainable.

XRP major multi year breakoutShould be lots of support around $2 or the intermediate high of the symmetrical triangle

XRP MID-TERM AND LONG TERM ANALISYSThere has been significant demand for analyzing Ripple.
Upon examining the chart, it seems that Ripple is currently within a running triangle.
Wave D may complete its movement by hunting the all-time high.
Afterward, we could see a correction for wave E, followed by Ripple's post-pattern movement targeting a level above $15.
Some might question whether Ripple can sustain such a market cap. We should emphasize that we rely on chart analysis and do not focus on fundamental issues, as fundamentals are reflected in the chart itself.
When we reach wave E of the triangle, if we observe a clear and identifiable pattern, we can position ourselves on Ripple for the main move.
For risk management, please don't forget stop loss and capital management
Comment if you have any questions
Thank You

BTC.D More Down and then BOOM!Bitcoin Dominance is going to play this wedge out, it looks like. Then we can see the real push to 100k++!!

XRP to the Moon| Is Gensler Stepping Down the Secret Ingredient?XRP's price broke $1, marking a significant milestone for the cryptocurrency. Its market cap has climbed 26.76%, reaching $59 billion, while trading volume soared to $16 billion
Open interest in XRP derivatives increased by 12% to $1.5 billion, signaling growing speculative interest and potential institutional participation. Notably, over 320 million XRP were purchased within the last 72 hours
This surge follows a breakout from a symmetrical triangle pattern, often indicative of significant price shifts. Analysts have drawn parallels between XRP's current trajectory and its 2017 performance, when it hit an all-time high of $3.3. If the bullish trend persists, The rally may have been partly influenced by XRP’s listing on Robinhood. CryptoQuant's exchange reserves metric highlights growing confidence in the coin's long-term potential.
Ripple to Gensler: Don’t Let the Door Hit You on the Way Out!
Ripple Labs has also made headway in its legal dispute with the US Securities and Exchange Commission (SEC), securing a favorable court ruling and the approval of a joint motion for final judgment, boosting market optimism.With rumors circulating that Gary Gensler may step down—or potentially be ousted by a future Trump administration—Ripple is regaining the spotlight. As speculation about Gensler's possible departure gained traction in the market, XRP's price surged dramatically, reaching its highest level in 16 months.
Further speculation about Ripple’s development of a dirham-backed stablecoin has added to the upward momentum.
This comes after Ripple launched its RLUSD stablecoin, fully backed by the U.S. dollar. At the same time, Bitwise revealed plans to convert its Bitwise 10 Crypto Index Fund (BITW) into an ETF, which would include XRP. Ripple CEO Brad Garlinghouse shared his thoughts on these developments via X, amplifying market excitement.

XRP to $50 As WisdomTree’s Spot ETF Filing Signals a New XRP Surges to $2.50
Breaking News: CRYPTOCAP:XRP soared to $2.50 yesterday, a remarkable milestone that highlights renewed investor confidence. Adding to the excitement, WisdomTree, a leading U.S. financial firm managing $112.6 billion in assets, has officially filed for a spot XRP ETF. This move marks a major step toward institutional adoption and mainstream recognition for XRP.
WisdomTree’s XRP ETF Proposal
The proposed WisdomTree XRP Fund aims to provide investors with exposure to XRP without the complexities of direct ownership. This ETF will trade on the Cboe BZX Exchange and reflect the value of XRP based on an aggregated reference rate.
Key Highlights:
- Objective: The fund will track XRP’s price, less operational expenses.
- Redemption & Creation: Shares are created/redeemed in blocks of 5,000 units, with transactions in cash initially and potentially XRP in the future, pending regulatory approval.
- Institutional Gateway: Authorized Participants will facilitate share creation/redemption without directly handling XRP, enhancing transparency and compliance.
Technical Outlook
XRP’s price surge is supported by robust technical indicators:
- Current Price: $2.31, up 23% in the past 24 hours.
- RSI Overbought: At 76, CRYPTOCAP:XRP is in bullish territory, indicating strong momentum. A slight cooldown could see support at the 38.2% Fibonacci Retracement level ($1.73).
- Key Resistance: The $3 level aligns with the 23.6% Fibonacci mark. A breakthrough here could set XRP on a path toward $10 and possibly $50.
Fundamentals Strengthening XRP’s Case 💡
Since its launch in 2012, the XRP Ledger (XRPL) has proven itself as a scalable, low-cost, and energy-efficient blockchain solution:
- Transaction Speed: 3-5 seconds
- Scalability: 1,500 transactions per second
- Cost-Effectiveness: $0.0002 per transaction
-Eco-Friendly: Carbon-neutral operations
With 70 million ledgers closed reliably, XRPL’s track record enhances its appeal to both retail and institutional investors.
Market Impact
- Market Cap: $131.8 billion, ranking XRP #4 on CoinMarketCap.
- Trading Volume: $34.8 billion in the last 24 hours, showcasing strong market activity.
- Comparative Strength: XRP’s rise outperforms many altcoins, signaling potential dominance in the upcoming memecoin and altseason cycles.
Conclusion
WisdomTree’s spot ETF proposal could usher in a new wave of institutional investments, mirroring trends seen with Bitcoin and Ethereum ETFs. With XRP's robust technical foundation and bullish indicators, the future looks promising for this digital asset.
Stay tuned— CRYPTOCAP:XRP is just getting started! 🚀

02/12/24 Weekly outlookLast weeks high: $98,894.77
Last weeks low: $90,786.17
Midpoint: 94,840.47
Last week was all about altcoins as Bitcoin takes a backseat after a the "Trump pump" rally. Consolidating just under the $100K big even level has seen rotation into Ethereum finally and more surprisingly dino-coins such as XRP, LTC and more.
XRP has rallied to ATH (+300%) in less that 1 month, the news that Gary Gensler will be stepping down and with that the SEC's tirade on Ripple. The momentum and talk of the space is with XRP for now as it overtakes the Mcap of Tether to go 3rd! This comes at a time where typically BTC profits rotate into ETH and yet a lot of the capital has gone into XRP instead and so Ethereum is still way behind, BTC, SOL, XRP are all at ATH.
With the new month beginning we typically see a shaky start to the month, especially after such a strong close. The fear and greed index for BTC is @ 80, that's down from 94 in the week previous (mid November). The drop off is also evident in the BTC.D dropping 3% as alts move up.
This week I'm focused on where we are in the cycle, many alts are climbing and of course the $100K event for BTC. I believe we are not anywhere near the cycle top, any on-chain indicator would support that but that does not necessarily mean we aren't close to a local top. A strong bearish divergence has emerged on the weekly and that is cause for concern, overbought RSI high fear and greed and euphoric sentiment on the TL. Any new longs are extremely risky for now (LTF not HTF) without any fresh bullish news events. Price currently at midpoint, hard to tell how deep the monthly open sell-off will be, a quick wick with fast recovery will be bullish but a slow bleed would be more worrisome.

Symmetrical Triangle on the XRP Monthly chart ready to breakout?This Triangle can also be seen well on the weekly…and also valid on the daily chart but you have to scroll over to see the whole triangle on the daily. I chose the monthly chart for this idea though because it’s the easiest one to see all the key valid touches on both the bottom and top trendlines of the triangle.That bottom trendline has been holding for 3 years now and is super strong support. We just had a flash crash on the daily dip down below it and threaten to trigger what looks like a h&s on the daily chart (not shown here) however that was quickly bought up and with very little volume to show is looking to be a classic fakeout breakdown/bear trap. Still a decent amount of hours left in todays daily candle but as long as that candle closes green it is a very good sign that this triangle will likely be breaking upwards. *not financial advice*

Current price retracement on xrpusd is creating right shoulderWe can see the current price retracement on xrpusd is starting to form the right shoulder of an inverse head and shoulders pattern.This means that once price bounces and gets firmly above 95 cents or so then maintains that level as support it could trigger a breakout from this inverse head and shoulders pattern. At that point the target would be around $1.55-$1.60 and if we can get tot hat level and maintain that level as strong support thats when the real fireworks can start to begin. Could take multiple weeks for this right shoulder to find its bottom and head back towards the neckline, but hopefully sooner rather than later. *not financial advice*

XRPUSD Weekly chart suggests a triangle breakout is nearingWe can see here how the bottom trendline of this brown symmetrical triangle has held support since early 2020 and will likely continue to do so. We can also see that we are on the verge of a weekly golden cross with the weekly 50ma (in orange) looking like it will cross above the weekly 200ma(in blue) shortly after the next bullish impulse in price action. Those MAs are currently serving as support for current price action and could easily maintain that support. If so then the place I arbitrarily put the dotted breakout measured move line is likely to be close to where the actual breakout occurs in which case the price target should be similar to what you see here. There is also a chance that we are given some sort of Black Friday or holiday discount, in which case price action dips below the weekly MAs momentarily….if so I personally think a retest of the bottom trendline of the brown triangle will be an optimal place for me to buy such a dip if I’m lucky enough for price action to retest it. If that were to happen the spot where the breakout eventually happens will have to be changed but it shouldn’t effect the price target too dramatically. Of course as always this is not financial advice and simply my strategy for my own holdings. Thanks for reading. Excited to see how this one pans out.

Monthly chart triangle XRP is reaching apex We can see this monthly triangle that xrp has been forming since 2020 is nearing an apex. We can also see that, barring some sort of black swan, XRP is fairly unlikely to stay above 40 cents based on the extremely solid support of the triangles bottom trendline and the fact that the monthly 100 ma is now overlapping that trendline for double reinforced support. The top trendline has the 3 touches needed to be a valid line so it is suggesting a measured move of over $2. Of course being a monthly chart pattern it would likely take may months to reach the full target. *not financial advice*

Legendary Golden Cross on XRP happening right at triangle apexThis chart screams bullishness. We are just a few weeks max from the apex of this symmetrical triangle on the xrpusd weekly chart and we are also about to have a weekly golden cross(where the orange line goes above the blue line) Doesn’t take a TA expert to see on this chart what tends to happen when this weekly Goldencross occurs on xrp. Obviously this isn’t financial advice but if I had to take a mildly educated guess of what the outcome with the highest probability of happening here is I’d simply say:UP!!!
