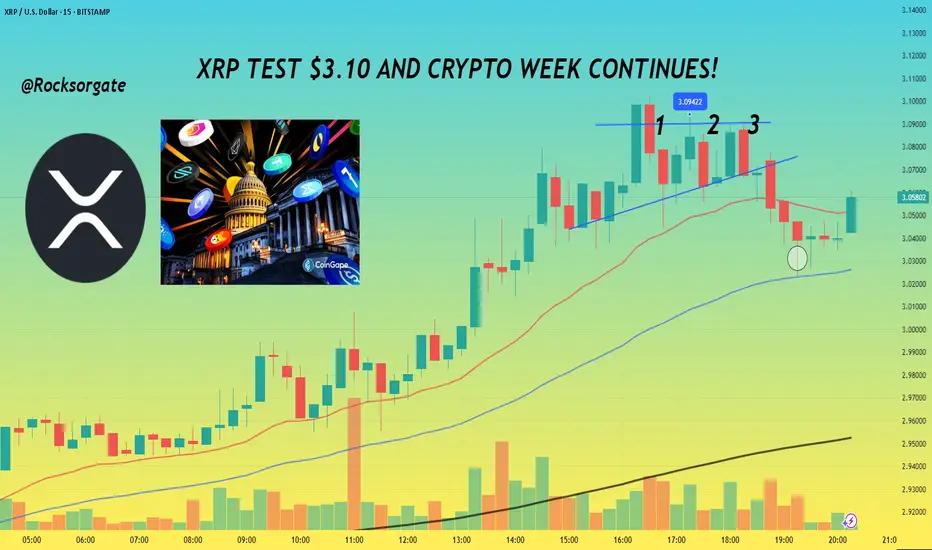
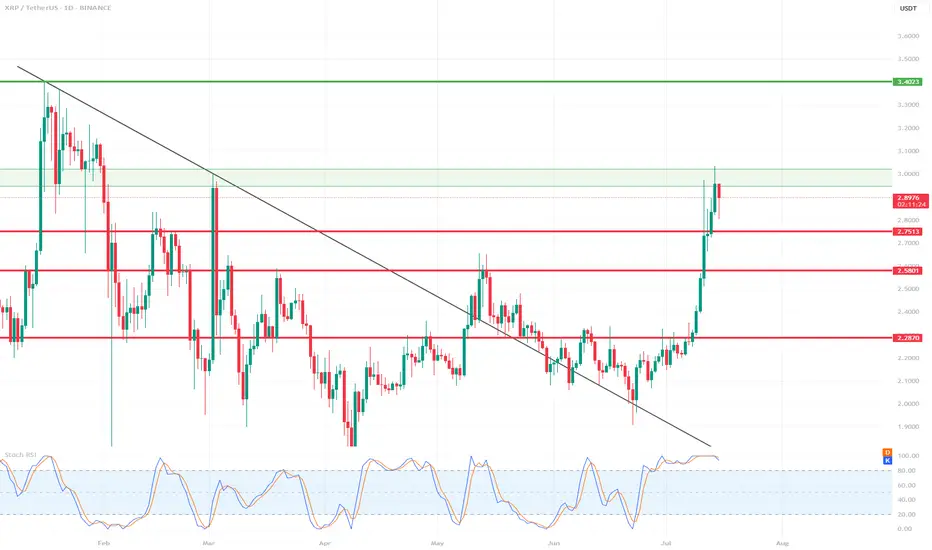
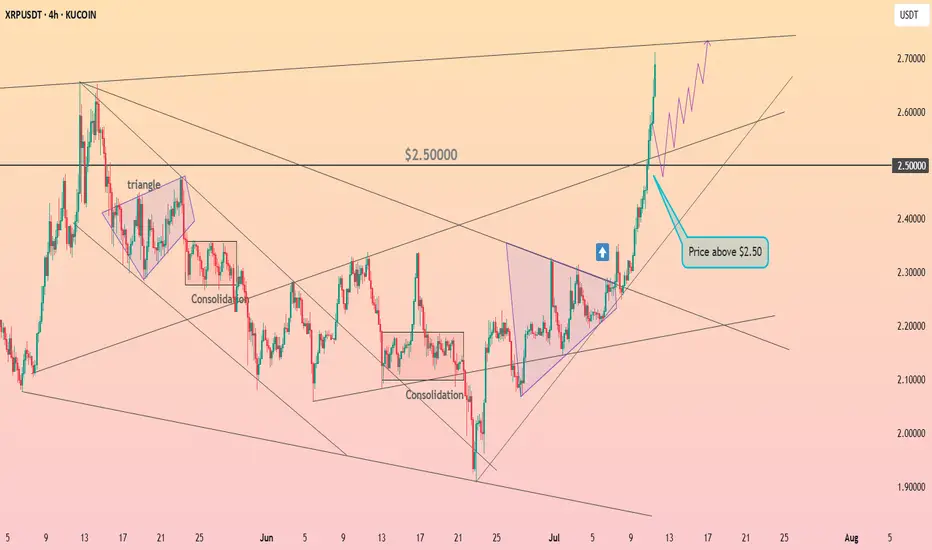
XRP TEST $3.10 AND CRYPTO WEEK CONTINUES!📊 Hey hey, hope all is well, gonna keep this idea pretty short and concise for the day, have a lot to do but thanks for joining as always.
📊 With Crypto week ongoing and the House of Representatives considering the Guiding and Establishing National Innovation for U.S Stable coins or GENIUS for short. Alongside that there's the Digital Asset Market Clarity Act or Clarity for short which is being considered as well. The last bill being considered is one which would be directed towards blocking the Federal Reserve from issuing a central bank digital currency directly to individuals.
📊 For summary CBDC is fiat money, just in digital form and that fiat money is issued and regulated by a central bank of a country.
📊 GENIUS has already made the rounds and passed through senate but is facing a snag, in limbo as House lawmakers as some lawmakers like Marjorie Taylor Greene and Chip Roy who themselves we're looking to get anti-CBDC language in with 12 republicans voting no on Tuesday's vote. Least to say things are still in flux, so we'll have to see if lawmakers can come to an agreement and sort things out simply put.
📊 If passed GENIUS would require stable coins to be fully backed by U.S dollars or similar liquid assets. Along with this you'd have annual audits for issuers with a market cap of more than $50 billion and guidelines would be established for foreign issuance.
📊 the Clarity Act takes a full on approach to crypto and would create a clear regulatory framework for crypto, this would function through the U.S Securities and Exchange Comission and Commodity Futures Trading Commission will regulate the crypto space. Digital asset firms would also have to provide retail financial disclosures and separate corporate from customer funds. More than likely in a nod to the collapse that FTX brought about for money when the company took advantage and started using customer funds.
📊 Overall these bills and acts alongside the CBDC bill would be a significant change for the digital asset space and give much more clarity for Institutions further allowing more money to enter the space basically.
Reference:
www.coindesk.com
www.theblock.co
📊 XRP itself will be impact by these changes just like the rest of the space with some digital assets making significant jumps or declines based on what bills and changes are ultimately decided so it's a crazy week to say in the least. For Technical I've added a chart below for reference:
📊 Can see how we're facing that horizontal level of resistance at $3.10 now, gonna set an alert for that but more than anything, right now what's gonna make or break things will be the news, we've already seen how much that's done us the last few weeks, grateful and blessed for it as always.
📊 Main thing now is to keep an eye on the news and watch that $3.10 level for resistance or a further breakout. We've also converged with our 200 EMA on the 3 minute chart so no doubt we'll see bulls and bears fight to break or keep that point. Should be an interesting next few days.
📊 Have to go study but as always, grateful for the continued support and those that take the time to read through these and continue with me on this journey, it's taken a few years but things are coming together finally, grateful we've perservered.
Best regards,
~ Rock '
Xrp
Weekly/monthly bullflag on xrpusdAn even higher target than the symmetrical triangles two potential targets materializes when we confirm the breakout up from this bull flag. It will likely have a bullish target somewhere around $5.20. Upon reaching this target it will also be breaking above a big cup and handle that will then have an even higher breakout target which I will post in my next idea *not financial advice*

XRP Price Action – Market Structure BreakdownThis chart illustrates a replication of XRP’s previous bullish move, with key price action and structure aligning closely with historical behavior. Here's the breakdown:
Accumulation Phase:
XRP consolidated between the $1.90–$2.20 range. This zone acted as a monthly bullish fair value gap (FVG), serving as a springboard for accumulation before the breakout.
Massive Breakout:
A large impulsive move occurred just before July 14, 2025, coinciding with the anticipated go-live of ISO 20022 standards, which many believe could support utility tokens like XRP.
Market Replication:
The breakout structure is mirroring a previous bullish cycle, highlighted by the labeled replication arrows on the left side of the chart. This pattern confirmation supports the projection of a move toward $9.99–$10, aligning with a key liquidity target and psychological round number.
Targets and Gaps:
Price is shown aggressively pushing through bearish FVGs and reaching above previous highs, suggesting that liquidity above $10 could be the next target. The $9.99 level is marked as a clear draw on liquidity.

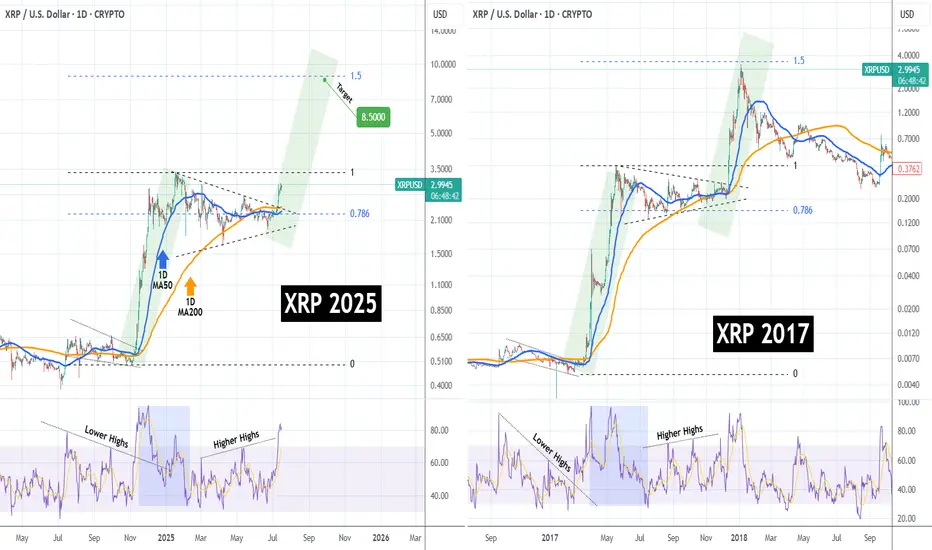
XRPUSD Has it started the mega rally to $8.500??XRP (XRPUSD) has been trading within a Triangle pattern for the past 6 months (January - July 2025) and only recently, it broke to the upside. Ahead of a pending 1D Golden Cross, this pattern is no different than the one of the previous Cycle from May - December 2017.
That setup resulted into the final Parabolic Rally of the Cycle that peaked just below the 1.5 Fibonacci extension. As you can see, both fractals are identical even from their starts, both initiated after a Falling Wedge that produced the first Parabolic Rally (green), which transitioned into the Triangle we described. Even their 1D RSI sequences are similar.
As a result, it is more than probable to see XRP hit $8.500 (Fib 1.5 ext), by the end of the year.
-------------------------------------------------------------------------------
** Please LIKE 👍, FOLLOW ✅, SHARE 🙌 and COMMENT ✍ if you enjoy this idea! Also share your ideas and charts in the comments section below! This is best way to keep it relevant, support us, keep the content here free and allow the idea to reach as many people as possible. **
-------------------------------------------------------------------------------
💸💸💸💸💸💸
👇 👇 👇 👇 👇 👇
XRP/USD (RIPPLE) BUYtitle: XRP/USD (RIPPLE) BUY
Asset: Crypto
Symbol: XRP/USD
Market Entry Price 1: $2.9450
Limit Entry Price 2: $2.7450
Stop Loss: $2.6450
Take Profit 1: $3.145 (close 10%)
Take Profit 2: $3.345 (close 25%)
Take Profit 3: $3.645(close 50%)
Take profit 4: $3.845 (close 75%)
Let any remaining Xrp run risk free
Check support above 2.5102-2.6013
Hello, traders.
If you "Follow", you can always get new information quickly.
Have a nice day today.
-------------------------------------
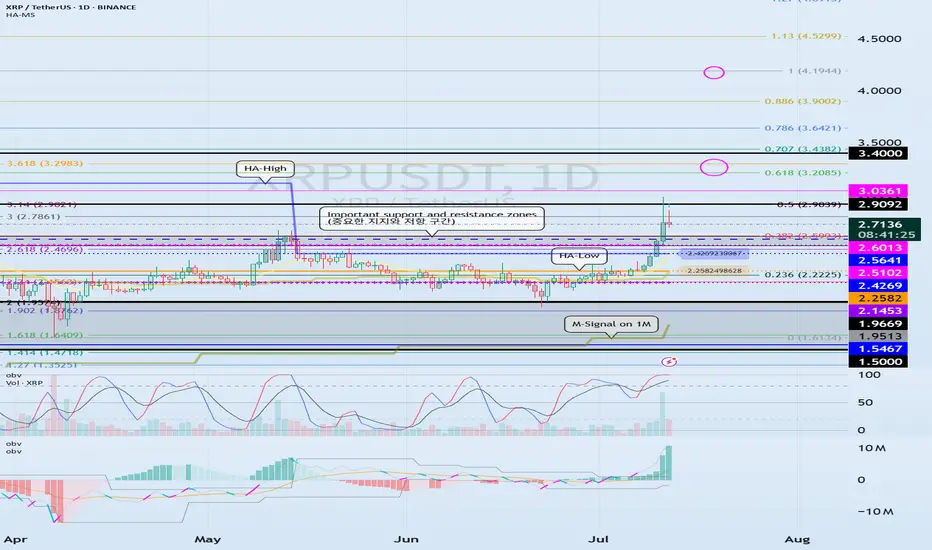
(XRPUSDT 1D chart)
It has broken through the important support and resistance zone.
Accordingly, the key is whether the price can be maintained above 2.5102-2.6013 and rise.
If the price is maintained above 2.5102-2.6013, it is possible that a stepwise rise will occur.
At this time,
1st: Right Fibonacci ratio 0.618(3.2085) ~ Left Fibonacci ratio 3.618(3.2983)
2nd: Right Fibonacci ratio 1(4.1944)
You need to check for support near the 1st and 2nd above.
The strong support area is 1.5-1.9669.
----------------------
The left Fibonacci ratio was drawn in the initial rising wave, and the right Fibonacci ratio was drawn in the recent rising wave.
Therefore, if the price rises above 3.618(3.2983) of the Fibonacci ratio drawn in the initial rising wave and maintains it, there is a high possibility of creating a new wave.
Since the Fibonacci ratio is a tool for analyzing the chart, it is not good to use this point as a support and resistance point.
Therefore, we need to check whether the DOM(60) indicator or the HA-High indicator is newly created and create a response strategy depending on whether there is support.
Currently, the DOM(60) indicator is formed at the 2.5102 point, and the HA-High indicator is formed at the 2.4269 point.
The basic trading strategy is to buy near the HA-Low indicator and sell near the HA-High indicator.
However, if it receives support in the HA-High ~ DOM(60) section and rises, it is likely to show a stepwise upward trend, and if it receives resistance in the DOM(-60) ~ HA-Low section and falls, it is likely to show a stepwise downward trend.
Therefore, trading begins by checking whether there is support in the DOM(-60) ~ HA-Low section and the HA-High ~ DOM(60) section.
-
Thank you for reading to the end.
I hope you have a successful transaction.
--------------------------------------------------
- Here is a description of the big picture.
(3-year bull market, 1-year bear market pattern)
I will explain more details when the bear market starts.
------------------------------------------------------
XRP 1D Chart Review📊 Support and Resistance Levels:
🔼 Resistance:
$2.95 - $3.02 – currently being tested, a local resistance zone. Price slightly rejected.
$3.40 – another strong resistance level from the previous high (visible on the left side of the chart).
🔽 Support:
$2.75 – the closest, recently broken support level.
$2.58 – another local support level.
$2.28–$2.30 – a very strong support zone that has been tested multiple times.
📈 Pattern and Momentum:
A breakout from a wedge-shaped downtrend with very high volume and long bullish candles indicates strong demand.
We are currently observing a correction/rejection at $3.02 – a possible short-term pullback.
🔄 Oscillator – Stochastic RSI:
The Stochastic RSI oscillator is in the overbought zone (near 100) – indicating possible consolidation or correction.
The curves are starting to curve downwards – a potential signal for a slight correction in the coming days.
🧠 Scenarios:
✅ Bullish (continued growth):
If the $2.95–$3.02 level is broken strongly and confirmed (e.g., by a daily candlestick closing above it), the target will be $3.40.
In this case, a quick rally to $3.40 is possible without major obstacles.
⚠️ Bearish (correction):
If the $3.02 zone holds as resistance, the price could retrace to $2.75 (the first local support).
If downward pressure persists, $2.58 could be tested.
📌 Summary:
XRP is in a strong uptrend after breaking out of long-term resistance.
In the short term, overbought prices on the Stoch RSI could trigger a correction to $2.75.
Key resistance: $3.02 – breaking it could signal further gains towards $3.40.
It's worth monitoring price reaction in this zone and candlestick confirmation.
Why XRP Holders Are About to Get Super Rich!I believe XRP is heading into a mass adoption cycle—something even bigger than what Bitcoin saw in 2021. We’re looking at a truly sustainable growth pattern fueled by a longer accumulation phase and crypto being adopted and invested in by major institutions.
This means we could see XRP skyrocket to $22 as my lowest target— and potentially even well over $100 per coin . This coin is truly ready for massive things. Be prepared!
Let me know what you think: Will XRP crash? Or is it heading for mass adoption? Share your thoughts in the comments below.
As always, stay profitable,
– Dalin Anderson

#XRP Update #2 – July 15, 2025#XRP Update #2 – July 15, 2025
XRP had previously completed the correction of its first impulsive move. Now, it has also completed the correction of the second impulsive leg. The current target for XRP stands around the $3.15 zone.
However, before reaching that level, it first needs to break through the $3.00 resistance area, which previously acted as a strong support/resistance zone. If XRP fails to gain enough volume and momentum for a strong breakout, there is a risk it may reverse from this level, potentially forming a double top pattern.
Because of this uncertainty, I do not recommend taking a long or short position on XRP at this stage.

HolderStat┆XRPUSD explosive growthBYBIT:XRPUSDT rallied out of consolidation and triangle formations, driving price quickly toward the $3.20–$3.40 range. The trend remains bullish with structure pointing toward continued upside as long as support holds above $2.80.
$XRP All Tie High After Shallow Pullback?CRYPTOCAP:XRP had a fantastic week smashing all resistances. I am looking for a shallow pull back to test the High Volume Node support at $2.7 at the .236 Fibonacci retracement before continuing to challenge the all time high.
Wave (3) of a motif wave appears complete adding confluence to a shallow retracement for wave (4).
Daily RSI is extremely overbought.
Safe trading

XRP $6.5, $9.5, $12.5 & $15.5 · Which One?XRP broke a small local downtrend and managed to close above a small resistance zone around $2.76. It managed to do this on a full green candle with rising volume.
XRPUSDT weekly is currently trading above all moving averages, extremely bullish: MA200, EMA377, EMA233, EMA89 and the rest.
If we look at a bull market cycle as a series of three steps, we have the first two missing the last one. Compare current action with 2021 while noticing the 1,2,3 numbers on the chart. This leaves us wondering about the next target: How high can XRP go in its next bullish move?
It seems something extraordinary is brewing behind the scenes, I can feel it. What we've been saying all along but rather than just words, a new feeling came up. "It is not the same to live through an event vs talking about it." That kind of feeling.
I can continue to say that market conditions are extremely positive now especially when we compare it to several years ago. But we have not seen the effect this positive conditions will have on the market, the price of the different projects and the charts, but we are getting close.
XRP has big plans and continue to grow, expand and evolve.
The 2021 bull market from bottom to top produced more than 1,800%. In 2025, if we start counting from the July 2024 low, a target of $6.50 would mean a total of ~1,585% growth. Market conditions are better now so we can aim higher, expect more.
A target of $9.51 sounds great, this would mean a nice ~230% from current price and from the same low as before, a total of ~2,400%. This sounds better but we can do more.
The next two targets based on an extension of the current trend would lead to $12.5 and $15.5. I'll let you calculate the potential yourself.
$6.5, $9.51, $12.5 or more; whatever the market ends up giving us, we are happy to be part of this adventure and we are always grateful for the amazing results.
Aim high. I will be here reading the charts live when we are getting close to the top. There will be time to sell, time to adapt, time to decide. There will be enough time for everything if you start now. Prepare now and success is yours.
We are early for the last phase of the XRP 2025 bull market. The first half is in, we are due the second half; it will be great.
Namaste.

XRP SHOOTS UP TO $3! 🌠 Wow, we'll, we've done it. We've hit $3 once again. Before I start this idea just want to give my thanks for tuning in, appreciate it.
🌠 This month has been pretty incredible for Ripple to say in the least from the BNY-Mellon Custodian Deal to Trump's Media company filing for a crypto Blue Chip ETF of which included the likes of XRP. With all the news and positive sentiment around XRP and Bitcoin which itself has hit a new All-Time-High hitting $123,000! Below I'll add a Bitcoin chart for reference:
🌠 To say in the least it's been a golden month for Crypto and Digital Assets. And one important thing to note is that as of today the Fedwire Funds Service is set to go live with the ISO 20022 standard starting July 14, 2025. The implementation will replace Fedwire's dated (FAIM) format with the ISO 20022 message format with the change happening over a single day.
🌠 For those that don't know ISO 20022 is a global messaging standard for financial transactions meant to reduce cost and fraud alongside automate transactions and reduce transactional costs. What this means for XRP is that it could become a much bigger player in cross-border payments now through RippleNet as XRP is one of the selected assets for the ISO 20022 standard.
🌠 ISO 20022 and global institutions will start utilizing XRP and it's ability to process transactions seemingly instantly and efficiently while significantly cutting down on cross border and transaction costs making it a considerably solution for banks and financial institutions. After all, if your objective is to make money, and you can make more money while cutting down on costs and making transactions, record keeping much simpler, then why not? Especially in an age where everyday things are continuously advancing and improving nobody want's to be left behind. Especially the big financial players.
🌠 Curious to see if prices can hold and keep pushing but just going off technical, we already know $3 is a tough point. At $3 just over 95% of XRP holders are in profit which makes a good reason for many to sell and take profit but with all the news and ISO now really kicking in we may not see as much selling, especially as holders are more confident and less likely to be swayed in letting go of their XRP. So it'll definitely be interesting to see how things play out.
🌠 Main thing will be Bitcoin, even if XRP holders hold I can't guarantee the same for Bitcoin, especially should it start to reverse, we know how financial institutions play taking advantage of the news. Just be cautious and set some price level alerts whether your trading XRP or Bitcoin.
🌠 In the long run things look very good regardless of what happens in the next week or two so keep that in mind. I'll be watching XRP to see if we can continue and break $3 but in my experience, with these impulse waves we usually see a big move up followed by some retracement as traders look to test support and liquidity so the waters may turn choppy but again like I said, we're here focused on the long term, whatever happens happens. We'll still be here for that but nonetheless the main objective is the longterm. $3 may seem like a lot but it's nothing compared to what XRP has in store.
🌠 This week is also 'Crypto Week' for lawmakers in DC as U.S lawmakers get ready to potentially pass changes in the regulatory setting when could push even more institutional demand further adding to the hype and optimism the crypto space has been running with as of lately.
🌠 Have to run but thanks as always for tuning in, really appreciate it and hope everyone is doing well! thanks as always and all the best till next. Feel free to keep posted and follow for more as always.
Best regards,
~ Rock '

XRP – Dual Trends Active, Ready to Outperform - $7 Incoming
Two active trends on CRYPTOCAP:XRP right now—monthly and weekly confirmations are in, which significantly boosts the probability of hitting the first target.
Honestly, I see this outperforming CRYPTOCAP:ETH , though both are worth holding.
With both timeframes aligned, I’m expecting a strong move.
Targeting $7 on CRYPTOCAP:XRP and over $7k on $ETH.
Xrp cup and hundleChart Xrp/usdt (4h)
Classic cup&hundle breakout in play. price broke above the neckline $2.5 with strong volume, followed by a clean retest of the breakout zone

$XRP Macro Tiangle Final Thrust ContinuationCRYPTOCAP:XRP completed a macro triangle pattern last year. Triangles proceed a terminal motif wave which already completed a wave 3.
Wave (3) of (5) is underway with a terminal target around $5.7 after price broke out of the pennant / wedge pattern.
Weekly RSI confirmed bullish divergence.
Safe trading
ATH Mode On => Request Your Altcoin Analysis NowThe bulls are back in action, and momentum is building fast! ⚡
To celebrate this major milestone, I’m opening the floor to YOU 👇
Request any altcoin in the comments, and I’ll personally share my technical analysis on it! 📊✅
Let’s make the most of this market together — it’s altcoin season waiting to happen! 🚀
📚 Always follow your trading plan regarding entry, risk management, and trade management.
Good luck!
All Strategies Are Good; If Managed Properly!
~Richard Nasr

XRP Ready To Grow: $4.5 w/ 5X Lev = 475% Profits PotentialThe last time XRP moved above EMA55 daily was in early November 2024, you know pretty well what happened right after. Just a few days after EMA55 was conquered as resistance XRP grew from a price of $0.54 to a peak of $2.90 in less than one month. It continued to rise and peaked again but this time at $3.40. The market turns bullish above EMA55 and this same signal is active, valid, live today.
XRPUSDT has been fighting with EMA55, fluctuating around this level, since late April. Now, this resistance is no more. The bullish bias is fully confirmed after a decisive higher low. This is it... This is all we need, the next target is up.
» 95% is the easy target at $4.50. With 5X lev. we get 475%.
We've done this together many times before... This is not the last target but since this is a strong resistance we can wait for the retrace and enter again once support is found. That is, there will be a stop at this level.
This is a strong chart setup. The price is not the best ever, it would be better to enter lower and that is why we have only 5X. With a lower price we can do 7X, 8X and even up to 10X. Hardly ever I recommend more than 10X, it just isn't necessary and the risk is too high.
I am wishing you great profits and continued success.
This is a friendly reminder to let you know that XRP is ready to grow.
Thank you for reading.
Namaste.

XRP SKYROCKETS AND BREAKSOUT PRICE RANGE! ⭐️In a pretty crazy twist and turn of events we're seeing XRP absolutely skyrocket and breakout with this morning's announcement on behalf of President Donald Trump with his Truth Social media platform announcing it had filed for a Crypto Blue Chip ETF with the SEC.
⭐️ The Blue Chip ETF proposal includes 70% holdings in Bitcoin, 15% in Ethereum, 8% in Solana alongside 5% in XRP and 2% in CRO which is from Crypto.com. This notably has led to the breakout with XRP that we're currently seeing with the crypto already up 12% since the day started and news broke out. It's still early morning too so we'll see how the market reacts as the day continues and traders wake up to the news.
⭐️The past few weeks have seen XRP stuck within this horizontal channel and constant tug a war between $1.90-$2.30 with this breakout and the last week signaling bullish optimism towards the crypto alongside news of the BNY-Mellon deal with BNY Mellon set to become the Custodian for Ripple's RLUSD Stable coin. And for those that don't know BNY-Mellon is America's oldest bank having been founded in 1784 and with an estimated $45.7 trillion in assets under custody and/or administration. To say in the least this is a big step for Ripple showing more institutional growth.
⭐️To note also is this as I'll show below on Bitcoin's chart:
⭐️ It's crazy to say but we've just seen Bitcoin form a new All-Time High at $118,100 alongside the Crypto Blue Chip announcement, more than likely with investors and institutions flocking to buy in before the ETF get's approved and likely in anticipation of a bullish shift.
⭐️ We've already seen the crypto space weather the storm through the last few weeks and months with everything that's happened from global escalations to all the new bills and changes in the government. Through thick and thin the crypto space has proved resilient and investors are taking note.
⭐️ Have to run for work but wanted to get a quick idea out there, especially since this news just broke out. Some pretty crazy stuff and I'll be watching these levels here to see if things continue or if the news has simply given us a breakout, regardless it's a win-win with all this news only pushing the directive and story towards crypto and digital assets for many. I'll attach a link below to an article on the Blue-Chip ETF for reference as well.
⭐️ Thanks so much as always and all the best till then, feel free to keep posted for more updates and ideas as we continue on this journey we've been riding the last few years already. It's been a lot but it's got much more to go. Let's keep at it and keep our heads up.
⭐️ Reference on Crypto Blue Chip ETF:
apnews.com
Best regards,
~ Rock'

HolderStat┆XRPUSD above the $2.5KUCOIN:XRPUSDT has rallied sharply, breaking above the key $2.50 resistance following multiple consolidation and triangle patterns. Momentum remains strong, and price structure supports continuation toward the $2.75 resistance zone.
BITCOIN's PUMPs are Getting LARGER this Bull Market...However, it may take a bit longer to realize those expansionary moves.
If Bitcoin adheres to the established cycle pattern, we can anticipate a minimum surge of 103% that should carry us into the fourth quarter of this year.
Consolidation ----> Fake breakdown ----> then expansion.
Are you ready?

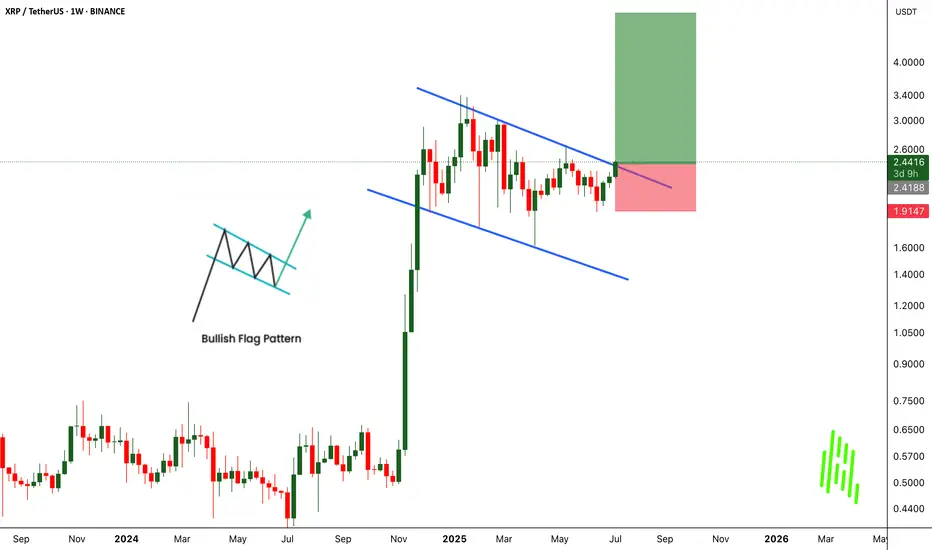
XRPUSDT Breaks Out of Bullish Flag - Big Moves Ahead!BINANCE:XRPUSDT has broken out of a classic bullish flag pattern on the weekly chart, signaling a strong continuation to the upside. This textbook setup is known for its high success rate, and the breakout suggests the potential for significant gains if momentum continues.
The CRYPTOCAP:XRP community remains strong, with long-term holders showing confidence and resilience. With the current market structure and support from loyal investors, there’s a real possibility for the price to double from this breakout zone.
The strategy is simple. Buy and hold for the long term. But as always, traders must manage risk carefully and use a proper stop loss. Let the flag fly high. CRYPTOCAP:XRP could be ready for a major pump from this level.
BINANCE:XRPUSDT Currently trading at $2.43
Buy level : Above $2.4
Stop loss : Below $1.9
Target : $5
Max leverage 3x
Always keep stop loss
Follow Our Tradingview Account for More Technical Analysis Updates, | Like, Share and Comment Your thoughts
XRP/USDT Monthly Chart: History Repeating Itself?Hey traders! Let’s dive into this monthly XRP/USDT chart. I’ll be honest — I’m skeptical about this outcome, but let’s break it down because it could actually happen!
The chart screams déjà vu, with XRP’s price action mirroring the 2014-2018 period. Back then, XRP broke out from its 2014 ATH in 2017, leading to a massive rally. Fast forward to now, and we’re seeing a similar setup, but with a twist. XRP is struggling to break through the 2018 ATH resistance zone around $3.31, which reminds me of the Breakout Consolidation phase we saw in 2017. Historically, this consolidation led to a breakout, and the chart hints at a potential repeat!
If XRP breaks out soon, we could see a parabolic move, potentially targeting much higher levels. However, the current resistance is a tough hurdle, and if it fails, we might see a pullback to lower supports.
Key Levels to Watch:
Resistance: $3.31 (2018 ATH)
Support: $1.643 (previous consolidation low)
Breakout Target: To be determined (potentially parabolic)
Breakdown Risk: $0.650
I’m not fully convinced, but the setup is intriguing — could this be XRP’s moment to shine? What do you think? Let’s discuss below!
