Xrp - The expected rally of +50%!Xrp - CRYPTO:XRPUSD - is still clearly bullish:
(click chart above to see the in depth analysis👆🏻)
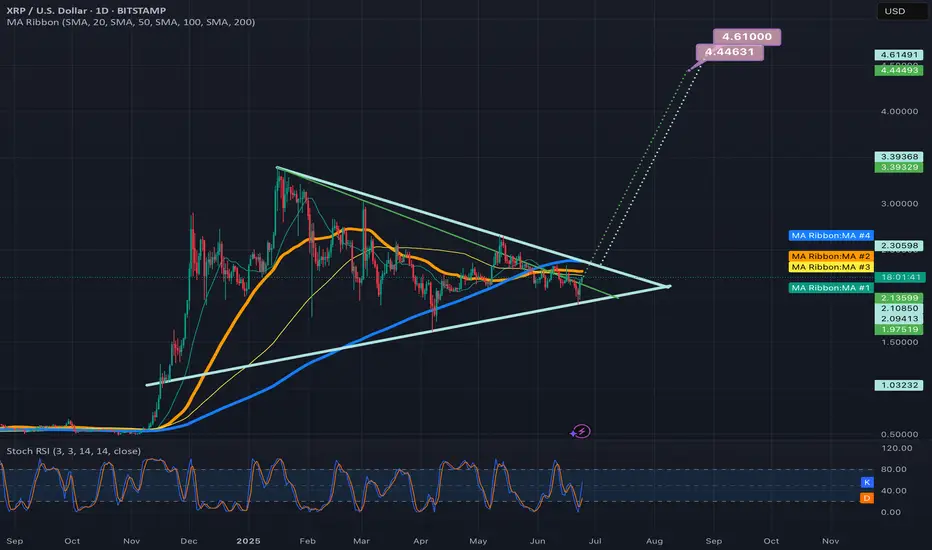
Ever since Xrp rallied more than +550% in the end of 2024, we have been witnessing a quite expected consolidation. However Xrp still remains rather bullish and can easily retest the previous all time highs again. Maybe, we will even see another parabolic triangle breakout.
Levels to watch: $3.0, $10.0
Keep your long term vision!
Philip (BasicTrading)
Xrp

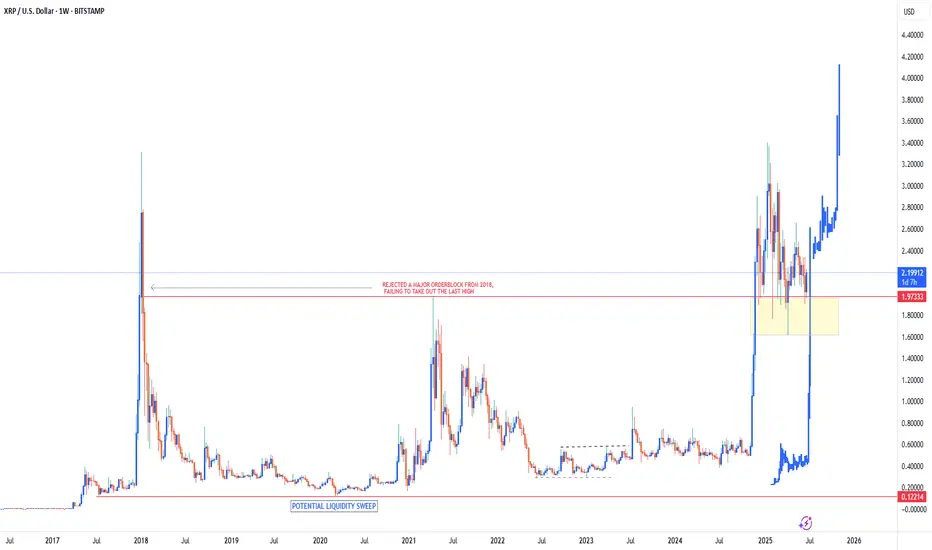
XRP Bullish to ATH of $4.10Since breaking out of its 6 year price range of $0.12 - $1.97 in November 2024, Ripple has remained within a bullish territory, sitting just above its support zone of $1.60 - $1.97.
As long as price can remain above this support zone I do believe that Ripple has much more upside to come in the next few YEARS. This definitely won’t be a fast move as there’s still a lot of legal situations involving XRP which is keeping price limited to the upside. But, as these legal battles come to an end & they will, it will slowly give XRP room to move to the upside.
I definitely see $4.1 as an achievable target for Ripple as the first target in the future. Once this price is reached, market structure & price action will give us a better indication of whether or not we can see high prices above the $4.1 target.
For now just be patient & let XRP play out in accordance with its external macro factors.
HolderStat┆XRPUSD consolidation of the assetBINANCE:XRPUSDT has bounced from the 2.02 level and is approaching the upper edge of a large consolidation structure. Multiple prior consolidation zones have led to breakouts, and the current bounce hints at continuation toward 2.30. A clean close above resistance would confirm bullish intent.

XRP - Do you want to slurp?Yeah who doesnt wants to slurp profits? I shall say the move down shall be taken first before the formation of the pattern to work in accordance with the moves! Hope its understood

XRP UG-ah-LYXRP has been slowly chopping lower in a mess of overlapping candles. Lower highs and lower lows at the Highest degree. The trend is down and the Elliott Is ugly.
There is a chance here for the trend to shift, but that low needs to hold.
In Elliott Wave, ugly can be useful. An ugly pattern often screams correction. That is the working assumption right now. This structure could still be a complex wave four.
Even though the wave count has not been crystal clear, I am not flying blind. I am using support and resistance to track the structure and wait for clarity.
Here are the levels that matter right now:
3.4005 was the major high
3.0257 and 2.2762 are key reaction zones
2.6510 is the median and the first major line bulls need to beat
1.9736 is the old high that price continues to bounce from
1.9015 and 1.5267 are the potential downside reaction zones if the yellow path unfolds
If this is a correction, there is still potential to hold above 1.62 and send. If that level goes, the structure shifts fast to lower targets.
This is not the time to get brave without confirmation, mo.
Ugly price action can still resolve cleanly. But I want to see an impulsive move through one of these levels, followed by a corrective return to that level. That would offer a more ideal continuation in whichever direction price decides.
Let the level reactions speak first. I will act after.

w partners with Ripple XRP.. alt season gemwhen alt season comes Q4 i expect $W to scam pump..
today it pumped 24% on the news with the partnership with Ripple / CRYPTOCAP:XRP
im waiting for a bottom around 3-4c to DCA in..
sell zone around 55-70c Q4

HolderStat┆XRPUSD held the supportBINANCE:XRPUSDT on the 16h chart is showing strength above $2.05 after breaking out from consolidation. The path is clear toward $2.30 and $2.60 as buyers regain control. The bullish pattern sequence continues to develop.

XRP About to Break Out! 3.40 Target.Trading Fam,
It's really this simple. This is a bullish triangle. Three hits in the premium buy zone (bottom of the triangle) and we're done. Once we break, there will be some resistance at that VRVP PoC (2.39) and then we're gone. 3.40 is an easy target.
Stew

Something Like ThisI believe the charts are pointing towards the market gearing up for a play somewhat like this.
The timing may well be off, but the levels and sequence seem broadly predictable.

Xrpusd cup and handle targetIf xrp triggers the current bullflag its in on the daily chart it should take price ell above the neckline of the cup and handleshown here on this chart and trigger its breakout as well which has a breakout target around $6.70. *Not financial advice*

2 potential breakout targets for the symmetrical triangle on xrpDepends on if the green trendline is the more valid top trendline or the light blue one is. *not financial advice*
Get Ready To Load Up For The Upcoming Institutional Altseason! Since the explosive high of $3.40 on Jan 16, 2025 📈, XRP has been sliding inside a persistent downward channel 📉. The trend remains bearish, with bulls struggling to break resistance at every turn.
Today, XRP trades near $2.04, but momentum is weak and the channel shows no signs of reversal yet. If this bearish pressure continues, a drop toward the $1.49 level is on the table—a zone that could offer a textbook buying opportunity for patient bulls! 🛒🔥
🔻 Key Chart Signals:
Downward channel intact since Jan 16, 2025 📆
Lower highs & lower lows dominate the structure 📉
$1.49 is a major support & potential reversal zone 🛑
👀 Strategy: Let the bears do their work. If XRP dips to $1.49, get ready to load up for the upcoming Institutional Altseason! 🚀

XRP M30 Chart Analysis "XRP Short.
Target: 123.01B. Stop: 127.09B.
Let's see if this plays out. 👀
#XRP #CryptoTrading"

XRP road map (Daily)This could be the last chance for Ripple; if the triangle breaks downward, the price could enter a channel below $2.
Best regards CobraVanguard.💚

HolderStat┆XRPUSD correction from the trend lineOKX:XRPUSDT found footing at 2.09 and now grinds beneath descending resistance. Regaining 2.18 should unlock a glide toward 2.25-2.35 inside the larger bull channel, whereas failure to defend 2.05 risks a trip to 1.95 reload territory.

XRPUSDT Forming 2017-Style Flag — Major Breakout Loading! BINANCE:XRPUSDT is currently forming a classic bullish flag pattern, a setup that looks strikingly similar to what we saw back in 2017 before CRYPTOCAP:XRP went on a massive run. The price has been consolidating within a tight range, and this could be the calm before a powerful breakout.
Back in 2017, a similar flag formation led to a parabolic uptrend once the resistance was broken. While history doesn’t repeat exactly, this pattern suggests the potential for a significant upside move if the breakout confirms. Traders and investors should keep a close eye on this structure — a breakout from this flag could reignite bullish momentum and open the door for a sharp rally.
This is a buy and hold scenario for those who believe in XRP’s potential, but remember — risk management is key. Always use a stop loss below the flag support to protect your capital. Momentum could build quickly, so stay alert and watch for volume confirmation on the breakout.

XRP: You Have What it Takes, Success is Yours!It seems XRP has been trading at the same price for more than 7 months. The mean price since XRP broke above $2 back in December 2024.
Can you see what I am referring to? Good if you do.
If you don't, continue reading, everything will be clear in a few seconds.
Price action
Is neutral price action at this point bearish or bullish?
Bullish.
Most of the action has been happening above $2 and this is clearly bullish.
The upswings are bigger than the down-swings.
Buy volume is higher than sell volume.
The main move is an advance that started in November 2024.
The bigger picture and major trend is bullish.
The fundamentals are getting better everyday; there is nothing bearish on this chart.
Where to next?
New all-time high and higher prices.
How to approach the market
Start with 3-5X. When the bullish action is fully confirmed, the market starts to move higher supported by high volume and marketwide wide action, go all-in. That's the only way to win.
Make the winners pay big. Keep the losers small.
If you don't take risk you can't win in this or any other game.
Thanks a lot for your continued support.
Trading tips
Only risk money you can afford to lose and make sure to do a calculated risk. Not crazy risk nor gamblers risk. 2-3X. As the market advances, 3-5X. When the trend is confirmed, go higher and continue to increase until you max everything out. When our target hits sell everything and never look back. You can buy again when there is a crash or a retrace. Opportunities are endless.
If you secure profits and the pair continues to grow; who cares! Buy one that is safe and secure. Buy a new one that is trading low. Don't go back to the same pair just because you won. Detach. Take some time out. Secure profits. Comeback refreshed and the market will bless you with endless opportunities, it is not going away.
Motivation
Just make sure to win-win-win.
If you can win small, you will eventually win big.
Win, win, win. Make a habit of winning.
Go step by step.
Many people overestimate what they can do in a year but underestimate what they can achieve in a decade. Think long-term.
Instead of tomorrow, next week or next month, think how much money you are going to make in a decade if you start preparing now. What if everything you are doing does not need to yield an instant result? Now you can relax your mind. It will all come to you, but let it come, there is no rush.
Even if you hurry, life will continue to give you what you need, what you earned and not what you think is best. Whatever situation you are in right now is the result of past action. Take responsibility and watch everything grow.
Your future can change if you make the right choices today. You can change everything, start now; what can I do today to make my day better? What is the best action to take? Should I go out and get drunk, sniff a bunch of drugs, or, should I exercise and eat clean, do what it takes to reach my goals?
Choose wisely and watch your profits grow.
Whatever results you get when trading is just a reflection of your mind and the choices you make in your day to day live. Belief and take control.
You have what it takes.
Success is yours.
Namaste.

XRP - Straight HorseSight!XRP Vision is quiet clear - The two areas are areas of hold and from this side straight up move can be seen, though slow death move can be seen on the line marked, but its mostly due to liquidity sweeps!

XRP - Trade The Range!Hello TradingView Family / Fellow Traders. This is Richard, also known as theSignalyst.
📈XRP has been trading within a range between $2 and $2.35 in the shape of a flat rising broadening wedge pattern in red.
🏹 The highlighted blue circle is a strong area to look for buy setups as it is the intersection of the green support and lower red trendline acting as a non-horizontal support.
📚 As per my trading style:
As #XRP approaches the blue circle zone, I will be looking for bullish reversal setups (like a double bottom pattern, trendline break , and so on...)
📚 Always follow your trading plan regarding entry, risk management, and trade management.
Good luck!
All Strategies Are Good; If Managed Properly!
~Rich

HolderStat┆XRPUSD reboundBYBIT:XRPUSDT is carving higher lows off 2.03 support through a wedge break, morphing base into bullish momentum. Holding the rising line sustains upside tilt; clearing 2.35 unlocks 2.55 and breakout buzz 🌊

XRP It will grow soon...The XRP chart shows a Triangle pattern, approaching a resistance level at 109k. A breakout above this level could confirm the next bullish target, but watch out for a potential reversal!
Best regards CobraVanguard.💚

xrpusd - fractal from the beginning Everything is fractal: big repeats small, and small repeats big. So if you want to do something big, you start small, then go a little bigger to understand how it works and how forces of nature affect it. As a result, small machines were designed first, then large ones. The same applies to graphs and patterns. Strength lies in simplicity.

XRP 4444 day mega pump/cycleI used geometric progression by cycles to gain a deeper understanding of what is happening on the graph, apart from what can be seen from the fractals. The fact that the graph repeats itself means that it is cyclical. Cyclicality in infinite time is infinite, which means it has no angles. The circle is the only thing in which one thing is known, namely the ratio of the circumference to its diameter, which allows us to extend the graph into the future using the number Pi. This can also be used in our work by applying mirror zones 69 96, calculating them from the circle.
I expect the start of strong growth on day 4444 in this time range and a breakout at zone 4144, followed by a retest with further growth, according to the fractal.
Translated with DeepL.com (free version)
