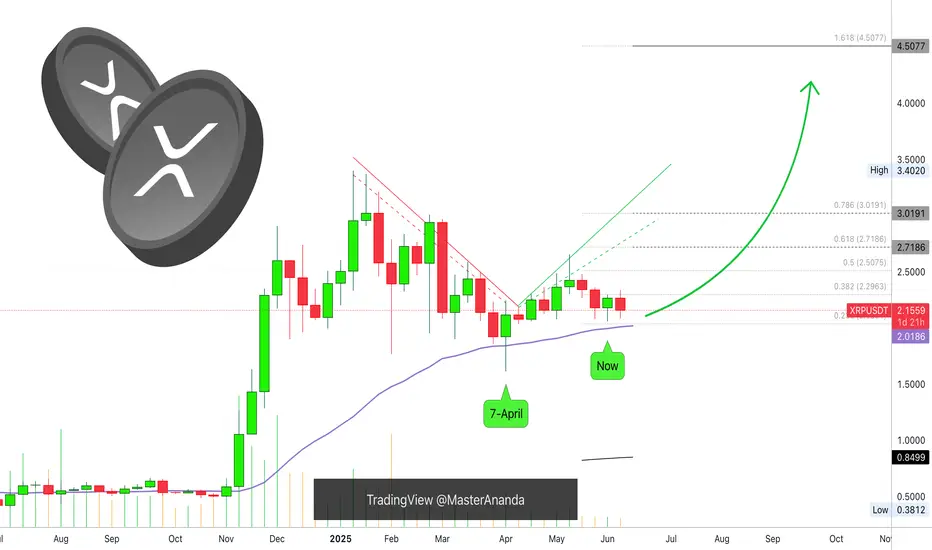
XRP Weekly UpdateThe line on the chart stands for EMA34. Notice two things about this level: 1) It was challenged 7-April but the action closed above. 2) The action "now" remains above this level but it has not been tested again, this is a bullish signal.
When it comes to the weekly timeframe, long-term, XRPUSDT continues bullish, with a bullish bias aiming higher. What we are seeing now is consolidation, accumulation, nothing changes and we can expect more growth.
Yes, the market shakes a little bit but this is the classic short-term noise. Zoom out, what do you see? You see just a few candles, red and green, but no change at all. The market is advancing to the side, after this side-advance, it will advance up; a bullish jump.
EMA34 sits at $2.01. We are strongly bullish above this level. We can expect growth in matter of weeks. Can be 1-3 weeks but it can also happen within days.
The retrace was small, consolidation has been going long enough. We are ready to start the next bullish wave.
Namaste.
Xrp
HolderStat┆XRPUSD narrowing of volatilityCRYPTOCAP:XRP
→ Higher-low ladder pushes into falling-wedge roof
↳ Daily close > 2.40–2.45 = breakout to 2.55–2.65
⇢ Rising base holds at 2.10
⤴ Break < 2.10 opens 2.00–1.95 liquidity pit

#XRPUSDT #4h (Bitget Futures) Descending channel near breakoutRipple just printed a dragonfly doji resting 50MA regained support, looks ready for short-term recovery.
⚡️⚡️ #XRP/USDT ⚡️⚡️
Exchanges: Bitget Futures
Signal Type: Regular (Long)
Leverage: Isolated (8.0X)
Amount: 5.2%
Entry Zone:
2.2438 - 2.2088
Take-Profit Targets:
1) 2.3535
2) 2.4493
3) 2.5450
Stop Targets:
1) 2.1199
Published By: @Zblaba
CRYPTOCAP:XRP BITGET:XRPUSDT.P #4h #Ripple #MadeInUsa xrpl.org
Risk/Reward= 1:1.2 | 1:2.1 | 1:3.0
Expected Profit= +45.7% | +80.1% | +114.5%
Possible Loss= -38.2%
Estimated Gaintime= 1-2 weeks

The Charts Never Lie [Well, almost never]So many reasons to be Bullish on Alts right now.
Historically, BTC will peak first, and then ALTS will have their turn. It looks like they are prime for a run at least to the middle of the range, although why stop there?

XRP Showing Some Weakness But...Here the bearish signals are not as pronounced as they are on Bitcoin or some other pairs which are basically trading near their all-time high, XRP is in a different situation. Still, a lower high is in place and trading volume is really low right now. This low volume always works as a continuation signal, which means it has no value. Whatever the chart is doing that is what is happening for real.
The main high happened 12-May and then a retrace. The lower high happened 9-June but then again today. Today's session wicked higher but it is already full red. Again, the signals are weak but we know the market is all the same. The big cap. projects move together, if Bitcoin goes down, Ethereum goes down, if Ethereum goes down, Cardano goes down, if Cardano goes down XRP is going down, etc. But we can also look at the charts individually.
On the other hand, smaller pairs can be growing strong and thriving, some will grow while others move down, why? Because we are in bull market zone. When the market is bearish, a bear market, Bitcoin goes down and everything follows. When the market is bullish, many can grow while some go down. This is what is happening today.
Wait patiently (SHORT), once support becomes established we can enter again.
We don't know if the market will produce a higher low short-term, vs 5-June or a lower low. But it is wise to secure your position because things can change in a flash. A higher low is possible which would mean a non-event, but, seeing the lower high and the low volume weakness, a market flush is likely to take place.
If we are set to experience new heights in late 2025, the correction must happen now, and with this statement the chart agrees. Down we go. It is still early though for this pair.
We will see how it goes.
Thank you for reading.
Namaste.

XRP's Consolidation with Bullish SignalsXRP has formed a higher low after rebounding from the $2.08 level. This hints at underlying bullish strength, but resistance looms near $2.55 and $2.70, levels that have capped previous rallies.
A breakout above $2.32 could signal renewed momentum, while a drop below $2.27 might test lower support.
The MACD has recently completed a bullish crossover, with the MACD line crossing above the signal line, indicating potential short-term upside. Additionally, the 50 EMA is nearing the 100 EMA, forming a mini-golden cross a pattern often associated with bullish continuation.
Market News:
Several developments are shaping XRP’s outlook. Ripple recently gained regulatory approval from Dubai, a move that could enhance XRP’s adoption and bolster investor confidence. Rumors of a spot XRP ETF, potentially launching in June 2025 with an SEC decision deadline on June 17, are also stirring excitement, approval could drive significant demand. However, the unresolved SEC lawsuit remains a dark cloud.
While Ripple has scored some legal wins, any adverse ruling could spark selling pressure. Regulatory headlines will likely play a pivotal role in XRP’s near-term trajectory.
XRP’s 4H chart presents a cautiously optimistic picture. Technicals lean bullish, with the MACD crossover and EMA alignment suggesting upside potential, especially if $2.32 resistance gives way. Positive catalysts like Dubai’s approval and ETF speculation could fuel gains, possibly targeting $2.55 or higher. That said, the SEC case introduces uncertainty—traders should brace for volatility if legal updates emerge. Key levels to watch: $2.32 for a breakout, $2.27 as near-term support, and $2.08 as a deeper floor.

XRP: Selling Pressure Could Push Price to $2.22FenzoFx—Ripple (XRP) is testing the $2.34 resistance zone, marked as a key level by the Volume Profile Indicator. RSI 14 shows bearish divergence, while the Stochastic oscillator remains in overbought territory, signaling potential selling pressure.
If $2.34 holds, a bearish wave could target $2.26, with further downside to $2.22 if selling pressure persists.

HolderStat┆XRPUSD kept the support trend lineCRYPTOCAP:XRP has successfully consolidated above trendlines that have previously acted as resistance on multiple occasions, but the market could still retest 2.25. A break of 2.35 opens the way to 2.4.

You can't unsee itThere is something to be said for the simplicity.
The historical price action is clear.
The RSI trend/cycles are just as clear.
There is not much space left for compression.
A BIG MOVE IS COMING.
The only question is, are you ready?

Is Bitcoin Ready to Launch? In-Depth Analysis of BTC, ETH, XRP, Hello everyone, I hope you're doing well.
Due to time constraints, I won't be analyzing each asset individually. Instead, I’ll provide a collective technical overview in this post.
This analysis includes the following cryptocurrencies: **Bitcoin, Ethereum, Ripple, Solana, Sui, and Chainlink**.
⚠️ **Please note:** On the **daily timeframe**, most of these assets are forming different patterns. However, the **weekly timeframe** provides a clearer and more reliable outlook.
---
### 🔍 **Technical Overview:**
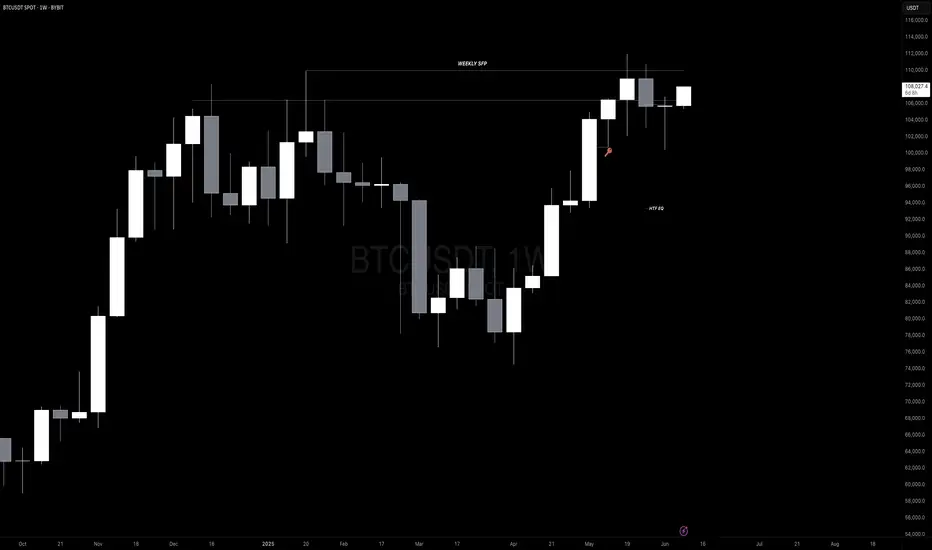
📌 **Bitcoin (BTC)**
Currently forming a **"V" pattern**.
If BTC closes **above \$110,500 on the weekly timeframe**, the first target is **\$131,500**, and the second target is **\$165,000**.
📌 **Ethereum (ETH)**
Also in a **"V" pattern**.
If ETH closes **above \$2,833 on the weekly timeframe**, the first target is **\$4,200**.
📌 **Ripple (XRP)**
Forming a **bullish flag** pattern.
If XRP closes **above \$2.65 on the weekly timeframe**, the first target is **\$4.22**.
📌 **Solana (SOL)**
Forming a **"V" pattern**.
If SOL closes **above \$190 weekly**, the first target is **\$282**.
📌 **Sui (SUI)**
Also forming a **"V" pattern**.
If SUI closes **above \$4.26 weekly**, the first target is **\$6.97**.
📌 **Chainlink (LINK)**
Needs a **weekly close above \$18** to confirm breakout.
First target: **\$25**.
---
### 🧠 **Brief Fundamental Insights:**
* **Bitcoin** is being heavily accumulated by institutional investors and whales. On-chain metrics suggest we are **not at a cycle top**, and the ongoing **supply shock** and **massive exchange outflows** are strong bullish signs.
* **Ethereum** is under **strong accumulation** from both retail and institutional investors, as confirmed by recent **CoinShares reports**.
* **Ripple** is awaiting resolution of its ongoing lawsuit with the **SEC**.
* **Sui** is consistently rolling out updates and shows **unstoppable DeFi ecosystem growth**, giving it strong fundamental support.
* **Solana** is being accumulated by institutional players, including **SOL-specific strategies** and funds.
* **Chainlink** is seeing buying pressure supported by **positive news and strategic partnerships**, some of which are from **anonymous large players**.
---
🧠 Updated Fundamental Analysis (June 2025)
Bitcoin (BTC)
New Investment Record: In May, total investments in crypto funds reached $167 billion, with Bitcoin accounting for $5.5 billion, signaling strong institutional demand.
Institutional Buying Surge: ETF purchases, entries by institutions like Paris Saint Germain, and even countries like Pakistan have contributed to declining exchange reserves of Bitcoin.
Favorable Macro Conditions: Rising bond yields, stock market volatility, and a weakening U.S. dollar have made Bitcoin more attractive as a hedge asset.
Ethereum (ETH)
Consistent Inflows: Ethereum funds have seen seven consecutive weeks of capital inflows, with nearly $296 million added in the past week alone.
Institutional Confidence: Assets under management (AUM) in ETH funds have reached approximately $14 billion, indicating strong long-term faith by institutions.
Solana (SOL)
Strong Institutional Demand: Firms like Société Générale and Siebert Financial have recently invested in Solana.
On the Verge of ETF Approval: Franklin Templeton filed for a spot Solana ETF back in February, potentially boosting demand.
Whale & DeFi Growth: Increased whale activity, growing DeFi ecosystem, and rising developer engagement hint at a potential price rally to $200 and beyond.
Ripple (XRP)
While there is no major new fundamental data recently, the listing of XRP futures on CME and broader access for institutional investors may have a positive impact.
The ongoing legal case with the SEC remains a crucial factor in XRP’s future outlook.
Sui (SUI)
DeFi Expansion: Active daily users have grown by over 14%, and decentralized exchange volume has reached around $34 million per day.
TVL Growth: Suilend’s Total Value Locked (TVL) has hit $700 million, ranking 8th among all blockchains.
Institutional Attention: There are reports suggesting that an ETF for SUI may be under consideration, with on-chain utility continuing to expand.
Chainlink (LINK)
Collaboration with Major Financial Institutions: Chainlink is participating in CBDC pilots between Hong Kong and Australia, working with Visa, ANZ, and the Hong Kong Monetary Authority.
Ecosystem Growth: Development is supported via grants, like the $150K funding provided to Lightchain AI, strengthening Chainlink’s infrastructure.
Strategic Partnerships: Collaborations with JPMorgan, Ondo Finance, and Swift highlight Chainlink’s growing influence in connecting real-world data to blockchains.

BTC Dominance looking real heavy up hereWouldn't be surprised in the least if we see a freefall on BTC Dominance over the next few months.
Of course there is no guarantee, and things may look different in a month, however as it stands, I think there is a potential ALT cycle on the cards for 2025.
RSI needs a reset, amongst other things.

#BTC - Post Weekly Close Update 👉#BTC has deviated from the RLs and has since seen a magnificent recovery into KL, which, if closed above on the daily, can result in higher prices, potentially even a new ATH. The weekly candle itself is a long-legged doji, which, as you know, is an indecisive candle with a very small body representing indecision, and rightly so, as we continue to range on HTF with no resolution above or below the SH and SL.
I also note that despite the recovery, we’ve closed below the weekly resistance at 106400 on HTF. A weekly close above it would be ideal to confirm higher prices
👉On LTF/MTF – We’ve seen a break above the TL as well as 4H & 12H closes above the PSH at 106766, which ought to be sufficient as a signal for an upward move. For better confirmation, I’d like to see a daily close above PSH, followed by a PB into KL, and we can then look for entries on BTC or alts.
If, however, we see a rejection from the CMP and get below ~103K, it suggests a retest of 100K and potentially even 98K. So keep that in mind, even though that’s an unlikely scenario given the strength of the PA atm.
💪I also note that we haven’t left any imbalances in the chart. Every imbalance has been filled by an LH, which suggests we might see a swift move up if it comes. Now we’re just waiting for the daily close to confirm the BO above PSH, which seems likely given the PA.
💪Also, all BVOLs charts are at support atm, suggesting a massive surge in volatility may follow.
HolderStat┆XRPUSD eyes 2.50 breakoutCRYPTOCAP:XRP coils between 2.10 footing and a falling roof after May’s breakout. Ripple price shows serial consolidation; punching through 2.50 unlocks the 2.90 supply block, while failure under 2.00 would stall the bulls’ script.

XRP Moves Forward—How To Maximize Profits, Aim At $4.5 Or Higher5-June gave us the confirmation for a higher low.
8-June is telling us the continuation of the bullish move is true. XRP moves forward.
How are you doing my friend in this beautiful Sunday?
I hope you are doing great.
The bottom happened 7-April, the peak happened 12-May.
24 Days for the retrace to be completed, between 12-May and 5-June.
It's been 27 days since we last saw some bullish action, almost an entire month.
I fully understand how people become bored, it is just too long, the market never moves straight up. But this can be taken in different ways. If the market were to move straight up, there is no chance to adapt, to recover, to plan and to learn. Now that the market made a full pause, we are ready for a new wave of growth and this time we can maximize profits on the way up.
How to maximize profits?
Hold strong. Hold long. Wait for higher targets.
Let's revisit the targets and how to approach them.
The "selling for profits" strategy where we sell a portion at each target is for blind traders. This method is used when we are trading with a high level of uncertainty about the next wave top. This method we can ignore here because we know where prices are headed next. To maximize profits with XRPUSDT, ignore $2.71, ignore $3.02, ignore the new ATH and aim straight at $4.51 with your full position with high lev. That's how to maximize profits.
Take some profits at this level only to buy more when the next retrace shows up. We are going higher, so you can keep on holding and wait for $6 or more. While we ignore the lower targets, when prices are higher we do not ignore them anymore. It doesn't matter how far up it goes, but we have to be careful after reaching $4.4.
Aim high because we are going high. The market is preparing for several months of sustained growth. Some of the older projects, mid-size and small size based on market cap., are showing signals of an entire year of bullish action ahead. It is not yet confirmed, but if it happens, this will be the biggest and best bull market in the altcoins history. A very big one.
For example, XRP peaks early because it started early and we get maximum profits from this pair. When the correction starts for XRP, the rest of the market continues growing. We can move capital from this pair to smaller pairs. And there will be thousands of those.
While XRP can grow 50% in a matter of weeks or months, a small pair can grow 150% in a single day. We have to take advantage of the big and the small ones. Diversification.
If you enjoy the content, consider follow.
Thanks for the continued support.
I'll see you at the top.
Namaste.

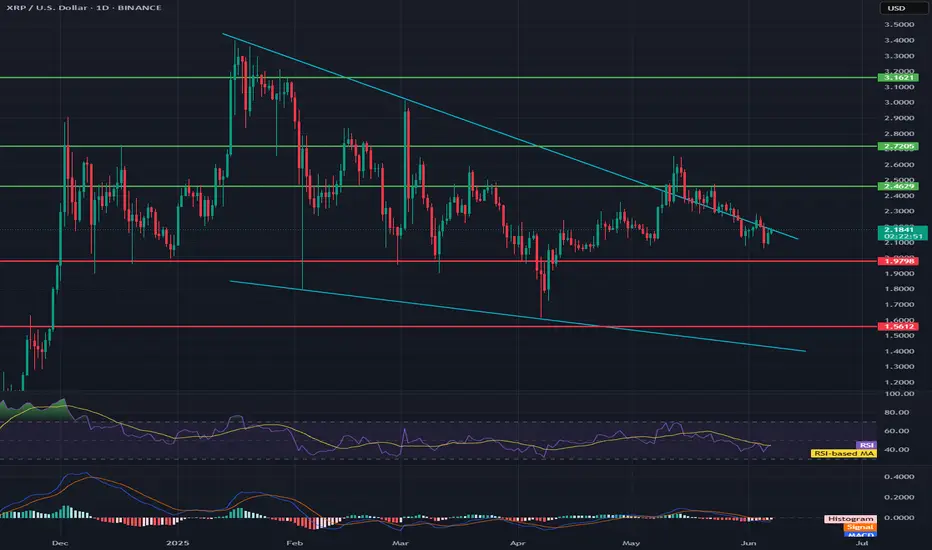
XRP/USD🔍1. Trend and Key Levels
General trend
In the medium term: We see a clear downtrend, marked by two wide blue trend lines (the upper line from the peak around $3.3, the lower from the local lows).
Recent weeks: Consolidation in a wide range between $2.72 and $1.98, with frequent attempts to break out.
📌2. Support and resistance levels
Green lines (resistance):
$3.16 — the historical peak of this wave, very strong resistance.
$2.72 — another strong resistance, around which the price was rejected several times.
$2.46 — local resistance, currently the price is below this level.
Red lines (support):
$1.98 — very important support, tested several times already.
$1.56 — lower support, coinciding with the lower line of the downtrend channel.
3. Market formations and structure
Declining channel: Wide channel marked by two blue lines. Price is moving in its lower half.
Short-term descending triangle: Visible at current levels – local peaks are getting lower, and support is around USD 1.98.
Volume: Volume advantage visible on descending candles.
📊4. Indicators
RSI
Currently around 40 — No clear advantage of the buyer side, slightly below the neutral zone. RSI does not give a signal of overbought or oversold.
RSI-based MA — Oscillates below the level of 50, which confirms the downtrend.
MACD
MAD and signal lines are below zero, without clear divergence.
Histogram: Slight advantage of bears – there is no signal to reverse the trend yet.
🧠5. Near-term scenarios
Bullish
Condition: Breakout above the local downtrend line (~$2.20–$2.25) and return above $2.46.
Target: $2.72 (test of resistance), further move possible to $3.16 in case of strong gains.
Bearish
Condition: Breakout and close below $1.98.
Target: $1.56 (main channel support), and even lower – lower channel line.
Sideways scenario
Further consolidation possible in the range of $2.46–$1.98, until a breakout from this range occurs.
📊6. Sentiment and summary
Medium-term trend: Down.
Buyers are weak, RSI low, MACD does not give a rebound signal yet.
Key level to watch: 1.98 USD – if it falls, the next stop is 1.56 USD.
Only a return above 2.46 USD may give the first signals of a trend change.
🧠Recommendation
For long-term players: Be careful, do not blindly catch the bottom.
For speculators: Play for a rebound only with a short stop below 1.98 USD.
For investors: Wait for a signal confirming a breakout from the channel or a clear divergence on the indicators.
Ripple Analysis - What Shall we Expect !!!If the price can break through this channel's resistance, I expect it to reach $2.5 in a short time.
Stay Awesome , CobraVanguard

XRP Looking Better But... Mixed. Comment, Support Me!XRP is looking much better now. It closed four days green after a higher low but something is off.
I mean, it is good you can see the chart the rising channel but I am sensing some weakness. There is zero volume.
Normally, when the retrace ends and produces a higher low there is always at least a small spike in volume. But, it can happen that there is no volume because it is early and there will be long-term growth and so volume only shows up when resistance is being removed.
Since doubt can creep upon us we focus on the price and the chart.
Higher low the bears showed no strength with several days green we can see prices continue to increase. Let's keep it easy.
Set at stop below $2.07 and go all-in. Do what you think is right already LONG on XRPUSDT since 30-May. We have to wait and see for the market to produce the results.
I mean, what is your take?
You are an expert too give me something, give me something in the comments because it is not an easy chart but it is clearly pointing higher. The problem is that sometimes the chart signals are fake.
Leave a comment with your view.
Thank you for reading.
Namaste.

xrp long idea/classic patternI have been trading this pattern for a long time now, and I am waiting for a 3 top to form, the highest in the 3.55 zone from where a strong decline could occur. We have been preparing for a strong uptrend on the hrp at 40% for quite some time now

XRP Bullish, The Retrace is Over! Aim HighWhat we need to consider here is the size and duration of each move.
The rise from 7-April through 12-May amounts to 64%.
The retrace from 12-May to present week amounts to 24%.
» So the retrace is more than a third part the size of the advance.
The rise lasted 6 weeks.
The retrace so far has 3 weeks.
» So the retrace is half the length of the rise.
Both these readings are super standard for a bull market. A retrace can easily end this week or early next week followed by 2-3 months of growth. Within this new wave of growth, there will be other retraces but a correction only comes at the end of the main wave. After the correction comes another advance and then a bear market.
Ok. We have a higher low and the chart is pointing up.
After three weeks of bearish action there is no sellers pressure, trading volume is really low.
The bears have no steam, no force, no momentum; the bears are gone.
Knowing this, we can aim high...
The retrace is over!
Thanks a lot for your continued support.
Namaste.

XRPUSD: 5 month consolidation ends and targets $8.00 XRP has turned bearish on its 1D technical outlook (RSI = 41.730, MACD = -0.027, ADX = 31.602) as the price has failed to break above the very tight consolidation that started after January's High. This pattern is however very similar to the June - November 2017 consolidation, which was the last accumulation phase before the eventual January 2018 top of that Cycle. That was accomplished a little over the 1.382 Fibonacci extension. This indicates that we should stay bullish on XRP as it can target again the 1.382 Fib, TP = 8.000.
## If you like our free content follow our profile to get more daily ideas. ##
## Comments and likes are greatly appreciated. ##

HolderStat┆XRPUSD triangle coil to 2.38CRYPTOCAP:XRP snaps its descending trendline after a neat 4-h triangle + box consolidation combo, reclaiming 2.15 pivot and pointing to the 2.38 supply—trendline break, bullish continuation pattern, resistance retest and clear upside target.

XRP Eyes $2.22FenzoFx—XRP formed a double bottom at 2.218, aligning with Tuesday’s low. Price action set resistance at $2.22, where untriggered liquidity backed by a bearish Fair Value Gap (FVG) remains.
Stochastic exited oversold territory at 39 and is rising, suggesting bullish momentum may continue. If $2.18 support holds, XRP/USD could surpass $2.22 and form a higher high.
The bullish outlook is invalid if XRP declines and stabilizes below $2.18.

HolderStat┆XRPUSD rebound renaissanceCRYPTOCAP:XRP bounced off a long falling wedge, logged a labeled “rebound”, and now glides within a widening channel. Multiple consolidation pauses plus higher lows keep momentum positive; watch the 740 USDT overhead zone as resistance where breakout traders may aim next.
