XRP Confronts Daily SMA ResistanceFenzoFx—XRP remains bearish, trading below the 50-period daily SMA at around $3.18. The SMA acts as resistance. Immediate support lies at $2.96. A break below this level may trigger further downside toward the $2.66 demand zone.
On the upside, a close and stabilization above $3.27 would invalidate the bearish outlook. In that case, momentum could push prices toward the previous highs at $3.65.
Xrpanalysis

XRPUSD Technical Analysis — Bearish Retracement in PlayXRPUSD Technical Analysis — Bearish Retracement in Play
Overview:
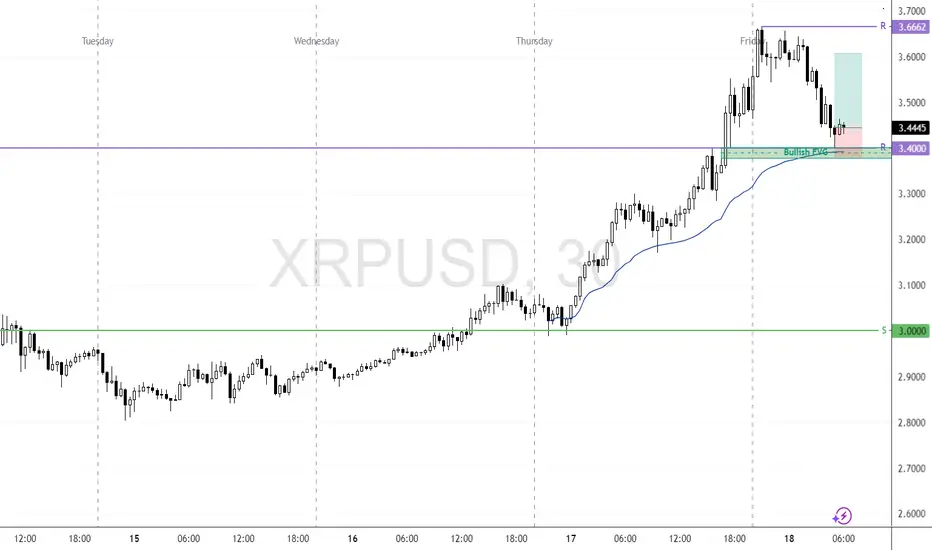
XRPUSD is currently exhibiting signs of bearish momentum after failing to break through a key resistance zone. Price action suggests a potential retracement towards the marked target level of 3.39519, supported by multiple technical indicators and price structure.
Key Technical Levels:
Immediate Resistance: 3.70 – 3.75 (strong supply zone; price rejected here multiple times).
Support Zone: 3.30 – 3.39 (prior demand zone and EMA confluence).
Target: 3.39519 (short-term bearish target as marked on chart).
Current Price: 3.50 (as of chart time).
Indicators & Price Action:
EMA Analysis:
EMA 20/50 (red/orange) are flattening out, indicating weakening short-term momentum.
EMA 100 (cyan) acts as current dynamic support.
EMA 200 (blue) is far below, suggesting room for deeper retracement if sentiment weakens.
Price Structure:
XRPUSD formed a double top near resistance, followed by lower highs.
Recent candle patterns show indecision and possible distribution.
Projected bearish leg toward 3.39519 suggests sellers are in short-term control.
Conclusion:
XRPUSD is likely to retest the 3.395 support level after rejecting the upper resistance zone. The bearish structure is supported by EMA alignment, price action, and repeated failure to break resistance. A break below 3.395 could open further downside towards 3.31. However, a strong bounce from support could invalidate this setup.
Trade Bias: Short-term bearish toward 3.395, watching for reaction at support.

XRPUSD - BEARISH DIVERGENCE DESPITE STRONG BULLISH PRESSUREXRPUSD SIGNALS BEARISH DIVERGENCE DESPITE STRONG BULLISH PRESSURE. WHAT TO EXPECT?👀
Ripple has been moving bullish since July 9, the same as the ETHUSD, reaching the 3.60600 resistance level. Strong bearish divergence on RSI is observed.
What is the bearish divergence?
Bearish divergence is a technical analysis pattern where the price makes higher highs in an uptrend, but a momentum indicator (e.g., RSI, MACD) forms lower highs, signaling weakening bullish momentum and a potential downward reversal. To trade, identify the divergence in a clear uptrend with the indicator showing lower highs (e.g., RSI above 70). Sell or short when the price confirms a reversal (e.g., breaks below a support level or trendline) with increased volume. Set a stop-loss above the recent high. Target the next support level.
Here the closest support level is local support 3.00000. is the price drops below the EMA20 on 4-h chart, there are high chances of reaching this level.

XRP Retests Previous All-Time High as Bullish Setup DevelopsFenzoFx—XRP (Ripple) is tested and has stayed above $3.40, the previous all-time high. This level acts as support, backed by the VWAP from Thursday's low and the bullish FVG.
If this level holds, we expect the cryptocurrency to aim higher, targeting $3.60, followed by $3.66.
XRP: Order Block at $3.40 Could Cap The RallyFenzoFx—Ripple's bullish momentum resumed nonstop, offering no clear pullback for entry. Currently, XRP is testing resistance at $3.40 within an order block. Momentum indicators remain in overbought territory, signaling short-term overpricing.
Volume profile shows limited resistance at present levels, suggesting a likely retest of $3.40. If this resistance holds, a pullback toward support around $3.00 is expected. This level can provide a discount to join the bull market.

XRP Cools Near $3.00 Amid Overbought SignalsFenzoFx—XRP remains bullish after piercing $3.00 earlier this week but cooled near resistance. Trading around $2.90, Stochastic (~84) and RSI 14 (80) indicate overbought conditions, suggesting consolidation.
We anticipate a pullback toward $2.66 support before resuming the uptrend. Alternatively, a decisive break above $3.00 would target $3.21 next.

XRP Pushes Toward Breakout as Momentum BuildsFenzoFx—XRP is bullish, attempting a breakout above the $2.34 resistance. Stochastic at 70.0 and RSI at 63.0 signal strong momentum with room for further upside.
A close above $2.34 could push XRP/USD toward the next target at $2.48. However, the bullish bias remains valid only above the $2.16 support—dropping below this level could reverse the trend.

XRP: Break Above $2.338 Opens Path to $2.480FenzoFx—Ripple (XRP) eased near weekly highs of $2.338, with Stochastic and RSI 14 signaling overbought conditions. The trend stays bullish above the anchored VWAP or $2.165, but consolidation toward $2.2240 is expected before resuming.
A break above $2.338 would target the next supply zone at $2.480.

XRP DAILY CHART ANALYSISXRP DAILY CHART ANALYSIS 📈
🟩Green lines are “inside trendline” having last interactions with price.
Price did a third touch on the bearish inside trend line yesterday 3rd July @ 2.3157
And current interaction with the bullish “inside trendline” today.
Fundamentally, expect short term USD strength with positive US data as catalyst from yesterday’s release.
Market could extend to closest support @2.1714
If bullish “inside trendline” is broken, we expect support and outer trendline (Black) third touch @2.0181.
If there’s a strong bullish signal convicted to positive XRP or Crypto fundamentals, we expect a bullish move back to at least 2.4
Short term - Bearish 🟥
Medium to long term - Bullish 🟩

XRP 4H SHORTPrice did a trend line third touch on the bearish trendline, which in this case acts as the resistance. Price printed a bearish engulfing pattern signaling a pullback to at least 2.1600 and second target is 2.1100.

Ripple Consolidates with Bullish Bias IntactXRP was rejected at the previous week’s high of $2.34 and is currently testing support at $2.22. As long as it holds above $2.16 or the 50-SMA, the bullish trend remains valid, with $2.34 likely to be retested.
On the flip side, a close below $2.16 could trigger a decline toward $2.07.

Bearish Setup Forms for XRP Below $2.21FenzoFx—XRP trades around $2.18 after forming a long-wick bearish candlestick above $2.17 support.
Stochastic reads 83.0, indicating overbought conditions. A close below $2.16 with a bearish engulfing candle could lead to $2.08. A close above $2.21 would invalidate the bearish outlook and open the door to $2.33.

Ripple: Lower Low ExpectedWe still expect magenta wave (2) to conclude within the magenta Target Zone between $1.03 and $0.38 – a range we consider attractive for long entries. That said, there's a 40% probability that magenta wave alt.(2) has already bottomed. If so, a direct breakout above resistance at $3.00 and $3.39 would confirm this alternative scenario and suggest that the corrective phase is already behind us.
📈 Over 190 precise analyses, clear entry points, and defined Target Zones - that's what we do.

XRP: Selling Pressure Could Push Price to $2.22FenzoFx—Ripple (XRP) is testing the $2.34 resistance zone, marked as a key level by the Volume Profile Indicator. RSI 14 shows bearish divergence, while the Stochastic oscillator remains in overbought territory, signaling potential selling pressure.
If $2.34 holds, a bearish wave could target $2.26, with further downside to $2.22 if selling pressure persists.

XRP Eyes $2.22FenzoFx—XRP formed a double bottom at 2.218, aligning with Tuesday’s low. Price action set resistance at $2.22, where untriggered liquidity backed by a bearish Fair Value Gap (FVG) remains.
Stochastic exited oversold territory at 39 and is rising, suggesting bullish momentum may continue. If $2.18 support holds, XRP/USD could surpass $2.22 and form a higher high.
The bullish outlook is invalid if XRP declines and stabilizes below $2.18.

XRP Holds Firm—Will Bulls Push It Higher?FenzoFx—XRP bounced from the $2.08 weekly resistance, aligning with the bullish Fair Value Gap. Currently, XRP consolidates at $2.17, with key resistance at $2.21.
A breakout above $2.21 could trigger bullish momentum toward $2.27. However, if XRP closes below $2.08, the downtrend may resume, targeting $2.00.

XRP's Path Forward: Will the Uptrend Continue?FenzoFx—XRP (Ripple) rose from $2.266, validating this demand zone for the week. The uptrend stalled at $2.360 during the early London session due to profit-taking and new market participants.
We expect XRP/USD to decline toward the FVG area at $2.30–$2.31 before resuming its uptrend. A break above $2.36 could trigger a move toward $2.38, followed by $2.40.
The bullish outlook is invalidated if XRP falls below the $2.26 support level.
Trade XRP/USD swap free and low spread at FenzoFx.

XRP Can Potentially Target $2.50FenzoFx—Ripple found support at $2.12 and began a bullish move, currently trading near $2.197.
Technically, the next target is $2.355, provided the price holds above $2.120. A break above $2.355 could open the way to $2.500.
Bearish Scenario : If XRP/USD falls and stabilizes below $2.120, the next support is at $2.034. A drop below this level may trigger a decline toward $1.924.
***
>>> No Deposit Bonus
>>> %100 Deposit Bonus
>>> Forex Analysis Contest
All at FenzoFx Decentralized Forex Broker

XRP - Bulls Preparing to Push Towards $2.50XRP has maintained a bullish tone after completing a significant gap fill, currently consolidating around $2.18. The previous impulsive move left behind an unmitigated imbalance below, suggesting that the market could be preparing for a controlled retracement. The overall structure remains bullish, but a corrective dip into key demand zones would align with healthy price development before the next leg higher.
Imbalance Structure and Retest Expectation
During the rally from the sub-$2.00 range, XRP formed a sharp move that created an inefficiency between approximately $2.05 and $2.12. This gap between buyers and sellers indicates that liquidity was left behind, often acting as a magnet for price.
Currently, XRP appears to be positioning itself to retest this imbalance, refilling orders and potentially gathering the momentum needed for a stronger continuation. I expect price to sweep into this zone, likely finding responsive buyers as it rebalances the inefficiency and revisits previous structural points of interest.
Reaction Zone and Bullish Confirmation
The primary area of interest lies firmly within the $2.05 to $2.12 range. A reaction from this zone, confirmed by strong bullish price action such as a higher low formation or a bullish engulfing candle, would validate the setup for further upside.
Following the retracement and bounce, the immediate objective will be a clean break above the $2.30 resistance. This level has acted as a cap on recent price action and represents a key liquidity threshold. A decisive move through this resistance would open the path toward higher targets, confirming the strength of the new impulsive phase.
Upside Target Projection
My upside target for this trade idea is located at $2.47. This level coincides with a previous high and clusters near the upper boundary of visible supply zones on the higher timeframes. Reaching this target would represent a continuation of the broader bullish structure while also completing a logical expansion leg relative to the recent price range.
Risk Management and Invalidation
The bullish bias remains valid as long as XRP holds above the lower boundary of the imbalance zone, around $2.05. A sustained breakdown below this level, particularly if accompanied by strong bearish momentum, would invalidate the idea, signaling that a deeper retracement is unfolding.
Until such invalidation occurs, the approach remains to monitor the retracement into the key demand zone and assess the strength of the subsequent reaction for potential long entries.
Conclusion
XRP is showing strong structural signs of bullish continuation but may first revisit the unfilled imbalance below. A clean reaction from this zone, followed by a break above $2.30, would likely set the stage for a rally into the $2.47 target. Patience is key in awaiting the retest and confirming bullish intent before execution.
___________________________________
Thanks for your support!
If you found this idea helpful or learned something new, drop a like 👍 and leave a comment, I’d love to hear your thoughts! 🚀
Make sure to follow me for more price action insights, free indicators, and trading strategies. Let’s grow and trade smarter together! 📈

XRP Short Term Analysis (4H)XRP is exhibiting bullish signals supported by multiple technical indicators.
An Inverse Head and Shoulders pattern has clearly formed on the chart, indicating a potential reversal from the previous bearish trend. Additionally, the downward trendline appears to be breaking out with increasing volume, which reinforces the breakout confirmation.
From an Elliott Wave Theory perspective, we seem to be in wave 3, which is typically the most impulsive and extended leg of the five-wave cycle.
Given the structure and momentum, a conservative price target lies at the $2.30 level, representing the measured move from the neckline of the H&S formation.
Further upside may follow if wave 3 unfolds as expected, but short-term corrections should also be anticipated.
Risk management remains essential, as macroeconomic factors and fundamental news may cause volatility.
— Thanks for reading.

Ripple Trades Sidways: What's Next?FenzoFx—Ripple (XRP) remains above $2.091, trading sideways in a low-momentum market. With support at $2.091 and resistance at $2.218, the trend is bullish as prices stay above the 50-period SMA.
The uptrend could extend if XRP/USD closes above $2.218, aiming for $2.355. However, a correction may begin if prices fall below $2.091, with $1.999 as the next support.
>>> No Deposit Bonus
>>> %100 Deposit Bonus
>>> Forex Analysis Contest
All at F enzo F x Decentralized Forex Broker

XRP Tests Critical Resistance LevelFenzoFx—XRP/USD has gained 23.0% since April 7, testing $1.999 as resistance. A close below this level could trigger a new bearish wave, targeting $1.736.
Conversely, if the price exceeds $2.10, the bullish momentum could potentially extend to $2.218.
Trade XRP Swap Free at FenzoFx Decentralized Broker

XRP Bullish Reversal Opportunity: DCA into the DipCould we see XRP back near $0.60 lows?
The recent developments in the XRP ecosystem, including Ripple's acquisition of Hidden Road, have set the stage for a potential bullish reversal. As we've dipped into the monthly bullish fair value gap (FVG), I'm eyeing a rebalancing opportunity to $0.60, where price may seek to refill sell-side liquidity and shake out weak hands.
As a developing trader, my strategy is to buy the dips and hold onto this asset. Although I initially considered purchasing more at $1.90, I've decided to allocate a portion of my crypto savings wallet to USD, waiting for a more favorable entry point. I'm targeting key levels below $1.50, $1, $0.80, and even $0.60 to split my funds and accumulate more XRP.
This dollar-cost averaging (DCA) approach allows me to capitalize on potential price inefficiencies while minimizing risk. With the current market dynamics and XRP's recent news, I believe we're setting up for a bullish scenario. By DCA'ing into the asset as it dips, I'm positioning myself for potential long-term gains.
Key Levels:
Initial allocation: $1.90 (missed opportunity)
Target allocation levels: $1.50, $1, $0.80, $0.60
Bullish target: Rebalancing to $0.60, followed by potential upside
Thesis:
Ripple's acquisition of Hidden Road signals increased adoption and use cases for XRP
Monthly bullish FVG presents a rebalancing opportunity
DCA'ing into the asset as it dips minimizes risk and maximizes potential returns
This trade idea is based on my analysis and market observations. I'm sharing my thought process to spark discussion and encourage others to share their insights. As always this is not financial advice! Do your own Research!
