XRP short term updateRight now XRP is creating
same short term pattern as gold
and is holding support.
Expect to test target 0.92 soon.
Also i see a beautiful longterm
cup and handle for both.
See my longterm prediction to.
Feel free to share, like and suscribe
- NO FA
- Do your own research
XRPBTC

XRP DAILY ANALYSIS!!- Hope you all are having a wonderful weekend :D
- As you can see on the daily time frame XRP broke to the downside and now is consolidating between the yellow Support and Resistance lines.
- We could potentially touch the $0.60 before a breakout to the upside!

XRP DAILY ANALYSIS!!- XRP can breakout of that triangle and go up or down!
- If it closes above and retest the trend line to the upside then we could see a 200-300% move to the upside!
- If it closes below and retest the trend line to the downside then we could see a massive crash, possibly a BLACK SWAN EVENT what people keep saying may occur!

XRP $0.30 BEFORE WE SKYROCKET!- As YOU can see XRP has always tested its support levels before sky rocketing!
- History doesn't always repeat it self but it often rhymes 0_0
- Be prepared for anything :)

BTC needs to get above 48k, before XRP can break out!Here's a quick Look at XRP daily chart. As we can see, the price has been forming a bigger descending triangle and a break to the upside could be around the corner! The price is very close to a bigger break to the upside. We need BTC to get above 48k to gain some bullish momentum - XRP probably won't break to the upside if BTC doesnt get above 48k.
The best entry would be, when the price breaks above 0.922$ with good amount of volume . Definitely one to keep an eye on.
The market is shifting, and big gains could be coming our way!
-------------------------------------------
The idea is: Buy when the price breaks above 0.922$ and take profits at the levels shown in the chart.
Targets:
1. 1$
2. 1.19$
3. 1.34$
-------------------------------------------
What are triangles when it comes to trading?
Key points:
"1. In technical analysis , a triangle is a continuation pattern on a chart that forms a triangle-like shape.
2. Triangles are similar to wedges and pennants and can be either a continuation pattern, if validated, or a powerful reversal pattern, in the event of failure.
3. There are three potential triangle variations that can develop as price action carves out a holding pattern, namely ascending, descending, and symmetrical triangles."
-------------------------------------------
If you like the content, then make sure to comment and like the post :D
Follow me for daily profitable trading setups
BTC dictates the market. If BTC falls, then Alts will fall as well. Trade safe!

XRP DAILY ANALYSIS!!- The market moves in 3 directions: UP, DOWN OR SIDEWAYS!
- We can get either this is crypto one of the most volatile asset classes out there, so if you trade crypto, trade with caution!

XRP POTENTIAL 1,000% MOVE INCOMING IN THE NEXT 2-3 MONTHS!- I Know my analysis is repetitive but I am going to stay consistent as it may motivate a new investor to invest in XRP (the best digital asset) and change their life!

XRP close to breaking outxrp looking good to break out soon
accumalating at these levels and below
could see a big move coming soon

CHINESE BAMBOO TREE ANALOGY ON XRPThe Story of The Chinese Bamboo Tree
- Like any plant, growth of the Chinese Bamboo Tree requires nurturing – water, fertile soil, sunshine.
- In its first year, we see no visible signs of activity.
- In the second year, again, no growth above the soil. The third, the fourth, still nothing.
- Our patience is tested and we begin to wonder if our efforts (caring, water, etc.) will ever be rewarded.
- And finally in the fifth year – behold, a miracle! We experience growth. And what growth it is! The Chinese Bamboo Tree grows 80 feet in just six weeks!

XRP RIPPLE - Market Analysis 📉📉📉📉 Expecting bullish price action on XRP as price shifted the market strucutre when it made a bullish BOS. We have a lot of buy side liquidity above 0.95000 and 1.0000 price area. I think we will see a retracement back into 0.70000 and from there the price will rocket, i already setted my alarm right there and i will clearly wait for a moment to enter.
What do you think ? Comment below..

Is XRP loading up for a big move? Wait for the breakout!Here's a quick Look at XRP daily chart . As we can see, the price has been forming a bigger descending triangle and a break to the upside could be around the corner! The price is very close to a bigger break to the upside. The best entry would be, when the price breaks above 0.922$ with good amount of volume . Definitely one to keep an eye on.
The market is shifting, and big gains could be coming our way!
-------------------------------------------
The idea is: Buy when the price breaks above 0.922$ and take profits at the levels shown in the chart.
Targets:
1. 1$
2. 1.19$
3. 1.34$
-------------------------------------------
What are triangles when it comes to trading?
Key points:
"1. In technical analysis , a triangle is a continuation pattern on a chart that forms a triangle-like shape.
2. Triangles are similar to wedges and pennants and can be either a continuation pattern, if validated, or a powerful reversal pattern, in the event of failure.
3. There are three potential triangle variations that can develop as price action carves out a holding pattern, namely ascending, descending, and symmetrical triangles."
-------------------------------------------
If you like the content, then make sure to comment and like the post :D
Follow me for daily profitable trading setups
BTC dictates the market. If BTC falls, then Alts will fall as well. Trade safe!

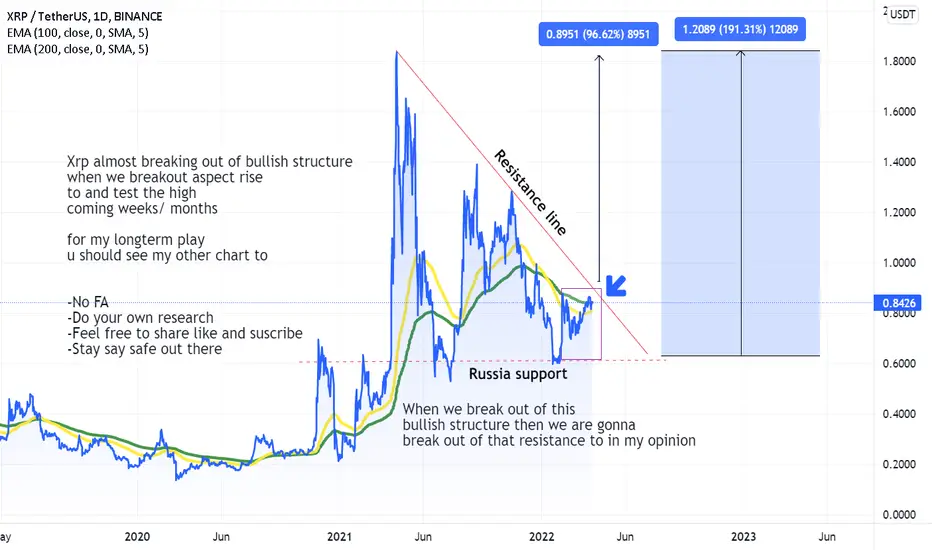
xrp pattern formation bullish biasXrp almost breaking out of bullish structure
when we breakout aspect rise
to and test the high
coming weeks/ months with upcoming news events
for my longterm play
u should see my other chart to
-No FA
-Do your own research
-Feel free to share like and suscribe
-Stay say safe out there
XRP/USD - About to drop, watch out!!! 😱Major rejection at resistance, time to revisit the support.
Be careful, don't FOMO.

XRP is going to explode soon!Good Morning Guys,
Today we take a look at the xrp chart. We are still in the sec case and we all expect a lot of volatility if it ends. But for now, we see a rising in the xrp and xlm price charts and it even performs better then btc.
So take it on your watchlist and remember this coins does NOT have a bull run up until now. So enjoy and take care.
Best Regards

XRP COULD REACH AROUND $100 (£76) BEFORE 2023!!- As we can see XRP is still hovering around the long term trend line!
- Previously when we broke below that trend line we saw a 30,000% move and a 700% even after the lawsuit!
- QUICK REMINDER: KIN COIN ALSO GOT SUED, IT SHOT UP AROUND 12,770% IN 168 DAYS!! LET THAT SINK IN!!
- NOT FINANCIAL ADVICE (PLEASE DO YOUR OWN RESEARCH)


XRPUSD BEARS BACK IN ACTIONLast year August, Down to November and January this year, i bagged XRPUSD using a swing trading strategy, i am not a moon fan, so i did not get in on the Bull run rather i was waiting for entry to retest my sell zone and here we are 2 months later, price seem ready for action and bears are about to take over... ignore social media noise if you trust my analysis and bag with proper risk management..
I wish everyone a successful month ahead, this trade could last for weeks, so bag without FOMO. stay STUCKINPROFIT

BREAKOUT INCOMING FOR XRP!!!- We have way more utility this year than we did back in 2017!
- XRP could explode and melt faces, put your moon boots on lets go!!!!

XRP ARMY GET READY!!- We are so close to breaking out guys, keep holding your bags and as we reach £5, £10, £15 and potentially £20+ sell small portions of your bags to take profits!
- £5 - 5%
- £10 - 10%
- £15 - 10%
- £20 - 10%
- £30 - 10%
- £50-80 (if we go that high) 20-30%
- HOLD the rest of your bags for full blown utility!!

XRP/USD LONG SET UP (HODL)(UPDATE)XRP LONG SET UP
Support: $0.83500/$0.80500/$0.78500/ $0.7460/ $0.72500/ $0.68500/ $0.64500-$0.62500
Resistance: $0.8500/ $0.88500/ $0.92500/ $1.0300/ $1.14500/ $1.29500/ $1.48500/ $1.68500/$1.74500/
XRP price has momentum building for a bullish breakout
XRP price already looked ready for a breakout on Thursday, but the tail risk of Biden being in europe for several meetings around Ukraine weighed on bull’s appetite to perform. Instead, XRP price is continuing its consolidation with lower highs and higher lows as buyers and sellers are pushed towards each other. It is just a matter of time before a breakout happens, and expect that to be in theform of a rally as global markets, particularly the Nasdaq, are on a winning streak that should provide additional support to XRP.
Ripple price will face first $0.8791 on its breakout, a historic pivot level that goes back to the end of November.
It bears specific importance as on previous occasions, the candles have either broken through it quite clearly, or each time only the wick of the candle made it through,
but the actual body of the candle was unable to either close or open above or below it.
From there, the jump to make is not that far anymore towards $0.90, with the 200-day SMA just above at $0.9090.
MAJOR NEWS CAN CAUSE A PULLBACK


XRP LONGS ACTIVE 📉📉📉📉 Expecting bullish price action on XRP as price shifted the market strucutre from bearish into bullish making the bullish BOS above the last high. A good area for me to enter this trade is somewhere around 0.70000 institutional figure when price will make the retracement lower.
What do you think ? Do you agree on that ?

XRP close to breaking outxrp is so close too breaking out
hopefully you bought the bottom on my previous chart
and now just just enjoying the ride up
