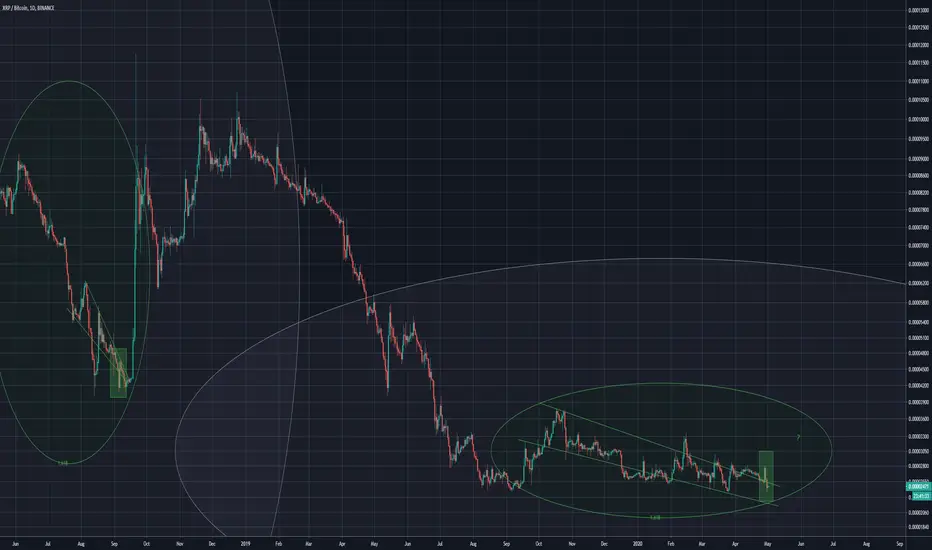
XRP/BTC - LS MASTER TRADING SYSTEM - a call for the XRP ARMYXRP/BTC - from the LS MASTER TRADING SYSTEM channel.
XRP looks like a decent entry here to us.
It can go lower, but still seems a nice well discounted place where to take a bag.
Possible take profits are in red in the chart.
Good Luck! :)
Xrpbtclong

XRP/ USD - further growth before going down?I would like to see it break from the descending channel and test higher fib levels. There is a chance of a large move down based on impulse / correction waves. For now, the whole market is trending up and BTC stagnating around its level/ going up would bring more confidence in alts.
XLM exploded nicely and knowing XRP is its big brother, we could expect a move up in XRP as well, besides this coin has not received much love lately (like 1y+).

XRP mega bull run -notIf you read ideas about how right now will start a mega bull run on XRP BTC, and you believe in it- u are an idiot.
We have touched and slightly bounced for a channel that was drawn a year ago.
From that last low channel start, we lost more than 30 percent worth of XRP BTC.
Will it bounce right now, yes, for a short time. Will it start a new bull run.
Sure not. Why? Cause we have a ..... wood resistance from here, and we have to breach them and get a bit confirmation that our downtrend has reversed, before we can say: yes, possible bull run.
For an investing perspective, it is time to buy a load of XRP.
Check my profile, go to my twitter, you will find some interesting investing idea, that may come to reality ina next bull run.
That idea will blow your mind for sure.
If we breach 1850, all bull run dreams will fade away.
Right now, aggressive traders may enter with a short SL. But for real: why trade XRP when u can trade BTC?
I will update this idea as I am on leverage investing.
Follow and comment, and come to my twitter

XRPBTC: Can it Get More Similar?XRPBTC has been getting shattered for over a year now.
This chart is the most similar thing i have seen yet.
This current consolidation is only found ONCE on the entire XRPBTC chart. I have shown the last time it did this and the result was a 6000% surge.
This should breakout very soon.
Time is REALLY ticking...
Lets GO XRP!!!
PLEASE Comment and like

XRPBTC Good Buying PositionClear divergences showing on the Daily chart, XRP long overdue for a pump, price has been declining for a while now while the market is pumping.
Good opportunity to Long XRPBTC, keep stop loss tight, high risk/reward ratio.
Suggested trade (Conservative option): buy as soon as price bounces upward, first green daily candle, Stop loss at previous day's low.
Suggested trade (Risky Option): Buy at current price with very tight stoploss.
Good Luck :)


XRP LONG..BOTTOMED OUTxrp showing Bullish divergence which is making me sure that it is ready for a move..i am expecting 17% move for short term


XRP Ready to PumpXRP is ready to pump.
Higher low and higher high achieved!
Bullish 1,01 AB=CD pattern done, now let´s finish him.
Do not forget check out our Active trades ;)

XRPBTC is forming bullish Butterfly | Upto 113% move expectedHi friend hope you are doing wel, This time on weekly chart XRP with Bitcoin pair is forming a harmonic bullish Butterfly pattern and soon it will be entered in potential reversal zone.
Buying And Sell Targets:
The buying and sell targets according to harmonic Butterfly pattern and its Fibonacci sequence should be:
Buy between: 0.00002028 to 0.00001548 sats
Sell between: 0.00002400 to 0.00003300 sats
Stop Loss:
The potential reversal zone area that is up to 0.00001548 sats can be used as stop loss in case of complete candle stick opens and closes below this level.
Possible profit and loss ratio:
As per above targets this trade has the profit possibility of 113% and as per above mentioned stop loss, the loss possibility is 23%
Note: This idea is education purpose only and not intended to be investment advise, please seek a duly licensed professional and do you own research before any investment.


XRPBTC IdeaXRPBTC Has formed some strange price action
Within each falling wedge this price action sits
Followed by this price action is a large bullrun
Will it happen again?
XRP/BTC - buy a divergence The subsidence of dominance will release the force in altoin.
that's why I'm buying.
divergence
a breakdown of a strong weekly level.
Going back up would be a false break-up.
Push ❤️ if you think this is a useful idea!
Before to trade my ideas make your own analysis.
Thanks for your support!

XRP/BTC price is about to reverseIf you see the XRP/BTC monthly chart, XRP price is about to reverse as it is now getting closer to a historical strong line of support (from 2014). We might retest 2000 satoshis but unlikely to go below 1900 satoshis.


XRPBTC 3-Day Entry Zones
3 day chart shows a clear ichimoku cloud acting as resistance from XRP rising against BTC. Blue boxes indicate entry positions for XRP with a 200% upside potential to previous levels.
Price is currently testing significant long-tern support level. A break below could see price drop to the next major support level at 33% drop.

XRPBTC Gann boxXRP has formed some nice patterns within the Gann box, clear decay in price along the inner Arc (highlighted in orange) Will we see a moonshot though? Maybe. Currently price is in a falling wedge (hard to spot but its there). 1st target is the inner Arc highlighted in green, second target is the Fibonacci spiral that aligns with an upper arc within the box.
Here is some of my other work with XRP
Why it is time to add XRP.
And some wedges that have formed on the USD pair, both bullish.

XRPBTC Adam and Eve bottomXRP the ultimate chad coin is showing good signs on the longer term. It is a classic adam and eve bottom and looks like it will hold strong for the rest of the year. The first hurdle is the downtrend line. After that, it is merry lands.


XRP/BTC 1D chart support zone, last chance before more downfall?Hi,
In favor of long setup due to several signals even though due to market unpredictability (mainly BTC/USD reacting to stock market/ oil prices / covid cases etc. which are all further interrelated with one another):
1. Visible bullish divergence on RSI, one that spans across a long period on the daily chart
2. At the lower support line of a Falling Bullish Wedge
3. At the support line of the immediate previous months bottom and bounce back areas - multiple times tested
4. Within a larger (more transparent green color) support zone from XRP/BTC first days tested several times in previous cycles.
5. MAs are starting to flatten and perhaps look up but I wouldn't count this is a formidable buy sign.
This the first 4 points above point to a hope that XRP/BTC can regain some levels and take a breather.
If it doesn't work out, next stop would be the 2100sats area which is the bottom support of point 4 (larger support zone). If it doesn't hold then, you know, fuck knows.
Stay safe.

XRP Fractal Predicts An Upward MoveSince August 2019, the XRP price has been trading inside a range between 2450-3350 satoshis. Throughout this range, it has twice decreased below the support area only for a short period of time.
The first time was on September 6, 2019. What followed was an upward move that led to a failed breakout above the range high.
The price decreased below this are on March 25 and created a bullish engulfing candlestick the next day. If it acts in a similar manner to September 2019, it will soon move towards the range EQ and eventually the range high.
A failure to do so would likely cause the price to decrease towards the next support area at 1400 satoshis, invalidating the possibility of ''Bottom accumulation''.
The daily RSI can be a good indicator of the direction of the price movement. If it is successful in moving above the 50-line, the price will likely move upwards. A rejection from the 50-line could cause a breakdown.
Please leave a LIKE and COMMENT if you enjoy the idea
