I am finally bullish on XRP! This is a perfect long entry. I am no longer bearish on XRP/BTC. 95% of my calls out of about 20 on XRPBTC have be correct so far. I believe that many bullish indicators are playing out, including an XRPUSD / XRPBTC convergence, prolonged uptick in volume, ridiculously prolonged oversell on the RSI, as well as the recent bull run in BTCUSD all indicate that XRP is due for a nice rally.
Rally probably won't happen straight away, so expect an initial rally up to 0.00004200 and then a correction back down to 0.00002800. Already made a tonne shorting xrpbtc so hopefully we can make some profits on the upside.
XRPEUR


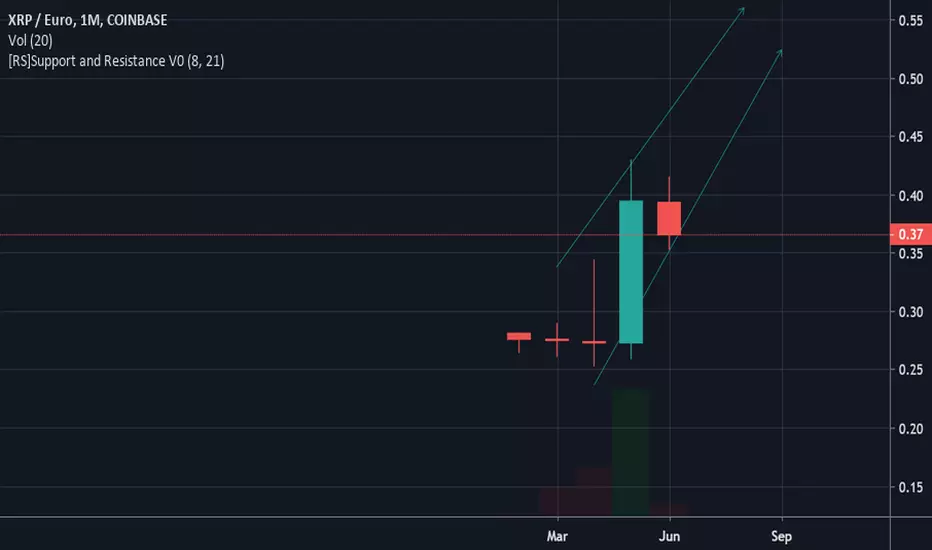
Let's just appreciate how bearish this chart looks. All of the gains we've had over the last three months will be completely wiped out in less than one month. This chart looks incredibly bearish. Once these monthly candles form it's extremely difficult to change their course. XRP will be at 30 cents or even lower this July.
That last rally we had in May was a final attempt by whales to create enough volume so that they can exit the market. The fact that Joel Katz "de-risked" by selling his bags before this Rally happened should be indication enough that this market is about to entirely capitulate.
I feel extremely bad for the mom's and dads that have put their life savings into these s#$%-coins expecting to get some sort of retirement out of it. A wave of Suicides and divorces will ensue, believe me. XRP has been a grand failure, lets face it. Wild expectations and extremely dismal fundamentals.
Inb4 "but moneygram". Literally shut up about this, moneygram is a s%#% company that is facing massive financial difficulties. Their stock looks worse than Deutsche banks. Please stop getting the wool pulled over your eyes by twitter influencers and youtubers. It's all hype and conspiracy, that never leads to anything meaningful ever in XRP's history as a cryptocurrency. I've been around for 4 years trading this s-coin and the narratives and riddles have always been the same bs.

Is it the beginning of the end or the end of the beginning? #7Good traders have a special talent for trading just as good musicians and good athletes have talents for their fields. Great traders are ones who are absorbed by the talent. They don't have the talent— the talent has them.
In 1637, tulips in Holland traded for 5,500 florins and then crashed to 50, a 99 percent loss. Well, you might say, "Trading was relatively new then; these people were primitive; capitalism was still in its infancy. Today we are much more sophisticated." So you go to 1929 and find a stock like Air Reduction which traded at a high of $233 and after the crash fell to $31, a decline of 87 percent. OK, you might say, "The Roaring '20s were crazy times, but now things are surely different." Move ahead to 1961 and you find a stock called Texas Instruments trading at $207. It eventually dropped to $49, a decline of 77 percent. If you think we have gotten more sophisticated in the 1980s, all you have to do is look at silver prices, which in 1980 reached a peak of $50 and subsequently fell to $5, a 90 percent decline.
I can also count you over hundreds coins from crypto. Please, check my last post on twitter. You will surprise it!
The point is that because people are the same, if you use sufficiently rigorous methods to avoid hindsight, you can test a system and see how it would have done in the past and get a fairly good idea of how that system will perform in the future. That is our edge.
My crypto trading strategy has been working well for years! Let me share it with you one more time!
1 ) Trade with BTC pair in a bull market, trade with USDT pair in a bear market. Don’t confuse it!
2 ) Less is more! Don’t use more than 4 – 5 indicators at the same time.
Trend lines, Moving Averages, RSI , Fibonacci levels and Chart patterns. Drawing lines are the most important indicators in any market.
3 ) Averaging down is the worst strategy. Averaging up is much better! You should buy coins when they’re on the way up in price, not on the way down.
4 ) Never forget 20 / 80 rule. 80 % traders lost money to 20 % to traders / investors.
5) Trend is your friend. Don’t fight with it!
6 ) Buy coins/ stocks as much as you can track easily. If you are comfortable to track 10 coins, Then You should buy max 10 coins not more!
7 ) Don’t risk more money than you could afford to lose without ruining yourself.
8) Be so picky who to follow in the market! Over 80% are people are loser. Don’t follow the crowd.
9 ) Every 50% loss began as a 10% or 20% loss.. Learn to always sell coins quickly when you have a small loss rather than waiting and hoping they’ll come back.
10) If you have a loss on a trade after a week or two, you are clearly wrong. Even when you are around breakeven, but a significant amount of time has passed, you are probably wrong mere too.
Ohhhh, You want to lose money in crypto? That's also easy!
1 ) Follow blindly crypto gurus on twitter ! Watch CNBC news ! Be the part of Pump & dumps telegram groups
2 ) Buy the coin / stock with a hype! Not knowing where to buy / sell . Not Using STOP LOSS after breaking the strong support levels
3 ) See Crypto / Stock / Forex market as an easy place to make money ! ( If you know the place to become an overnight millionaire , please let me know ASAP )
4 ) Not investing your time / energy and money into education! Hesitating to buy trading books - Join useful events - Attend paid workshop as long you see the value.
5 ) Forgetting that Cryptocurrencies are still a new and hyper-volatile asset class, and could drop to near-zero at any time. Over 90 % coins are dead after the biggest pump in 2014.
At the beginning, Trade small because that's when you are as bad as you are ever going to be. Learn from your mistakes. Don't be misled by the day-to-day fluctuations in your equity. Focus on whether what you are doing is right, not on the random nature of any single trade's outcome.
TARGET? The charts speaks itself!
**** Just started to read " Reminiscences of a Stock Operator ", I recommend you all to read it if you guys are not reading any trading books on these days!

CAN XRP REACH 0.85$ ! Traders,
Here we have XRPUSD 1D chart.
Previously we talked about gaining +100% for this crazy coin here below and determined a critical levels which was respected well in tha past few weeks :
Now we have many clear reasons for launching a perfect rocket to the nearest moon:
1-Golden CROSS
2- Very bullish broken pennant
3-breaking the 0.236 raio for the first time for the ATH
4- Light resistance (RED DOTS)
5-Point of control (POC) for the daily all time frame at 0.85$
Finally we gonna watch an interesting rally in my humble vision and let the good green days come back...Happy Trading.
Regards,
Mohsen


XRP/EUR has free way up to 0,70 cents...Horizontal support
Wedge broke a while ago
Next horizontal support is there.

AM I THE ONLY ONE THAT SEES THIS H/S?Am I the only one that sees this head and shoulder completing on the Daily timeframe?

Manipulation will never endget news today, clear usecase and utility, lots of volume will come to xrp but of course the manipulators will do this for time and memorial.
The price patterns in XRP are extremely bearish in my opinion and this is further confirmed by the extreme bullish sentiment in the XRP community. A short position would be an extremely smart contrarian trade. Good luck.

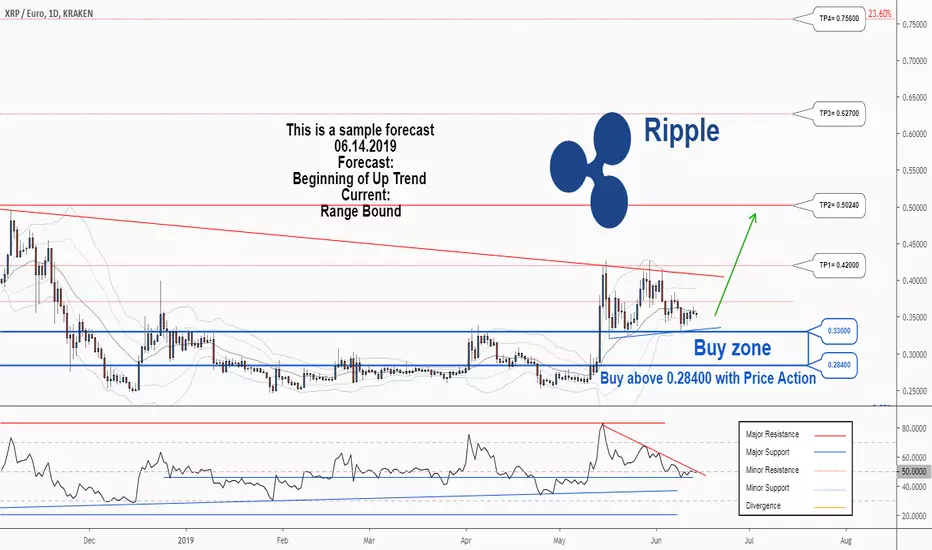
There is a possibility for the beginning of an uptrend in XRPEURTechnical analysis:
. Ripple/Euro is in a range bound and the beginning of uptrend is expected.
. The price is below the 21-Day WEMA which acts as a dynamic resistance.
. The RSI is at 50.
. While the RSI downtrend and the price downtrend in the daily chart are not broken, bearish wave in price would continue.
Trading suggestion:
. There is a possibility of temporary retracement to suggested support zone (0.33000 to 0.28400). if so, traders can set orders based on Price Action and expect to reach short-term targets.
Beginning of entry zone (0.33000)
Ending of entry zone (0.00013250)
Entry signal:
Signal to enter the market occurs when the price comes to " Buy zone " then forms one of the reversal patterns, whether " Bullish Engulfing ", " Hammer " or " Valley " in other words,
NO entry signal when the price comes to the zone BUT after any of the reversal patterns is formed in the zone.
To learn more about " Entry signal " and the special version of our " Price Action " strategy FOLLOW our lessons:
Take Profits:
TP1= @ 0.42000
TP2= @ 0.50240
TP3= @ 0.62700
TP4= @ 0.75600
TP5= @ 0.95900
TP6= @ 1.09000
TP7= @ 1.35700
TP8= Free

Everything monthly rally gets crushedEvery monthly rally get's crushed and this monthly candle is no different. Same bs over and over, the manipulation is real in this coin. When will it end?


XRPEUR 15MNSI think we are going to test the fatal resistance at 36cts, either we hold good, and go back up to around 38 cts for the evening, or we go back down to 25 cts.

XRP MIDDLE TERMHere is where i think XRP will be gravitating in a few weeks time.
What do you think?
XRPEURHere is my forecast for XRPEUR.
As the BTC we came back to test the support following a transaction of about 215M USD, about 25 000 BTC, which led to this famous dramatic fall.
Expect in the next days a bullish recovery, where we will test the famous resistances, with a little luck we will go up to .50cts

XRP 0.60 $ or 0.30 $ for next 2 weeksSo far so good for my analyse XRP. I find perfect zone to buy or sell and it works. Now I'm long from 0.407
if you want to have the following steps please give your likes.
Update after 25 likes

Golden Crossover: XRP Heads for Bullish Chart Pattern"The upward sloping 50-day moving average (MA) looks set to cross above the 200-day MA soon.
That said, XRP is still down 87 percent from the record of $3.30 reached on Jan. 4, 2018 and far from being overbought.
The golden crossover, therefore, may invite chart-driven buying, leading to the next leg higher in the cryptocurrency."
www.coindesk.com
finance.yahoo.com
Siam Commercial Bank, Ripple Multi-Hop User, xRapid User, Digital Asset User, Asian HUB
www.youtube.com
cointelegraph.com
"XRP: This double bottom will melt faces if it plays out. Couple Bullish indicators Im looking at 1.Golden Cross Incoming 2.
Double Bottom Formation 3.Bullish Divergence on MACD . As Long as Bitcoin doesn't dump on us, we could be do for a nice rise!"
twitter.com
BINANCE:XRPUSD
"Bitcoin Builds a Strong Case as ‘Store of Value’
coingape.com
Please consider a like or a follow if this is helpful.
Respectfully, your XRP brother @thomascusack
Btw, The XRP golden cross may bring me riches. But it was an old wooden cross that gave me my salvation and untold heavenly riches!

XRPEUR - Breakout - Golden Cross - BullishMy opinion - Lets Go - Leave a Like!
XRPEUR - Breakout - Golden Cross - Bullish

There is a trading opportunity to buy in XRPEURTechnical analysis:
. Ripple/Euro is in a range bound and the beginning of uptrend is expected.
. The price is above the 21-Day WEMA which acts as a dynamic support.
. The RSI is at 55.
Trading suggestion:
. There is a possibility of temporary retracement to suggested support zone (0.32500 to 0.25000). if so, traders can set orders based on Price Action and expect to reach short-term targets.
Beginning of entry zone (0.32500)
Ending of entry zone (0.25000)
Entry signal:
Signal to enter the market occurs when the price comes to " Buy zone " then forms one of the reversal patterns, whether " Bullish Engulfing ", " Hammer " or " Valley " in other words,
NO entry signal when the price comes to the zone BUT after any of the reversal patterns is formed in the zone.
To learn more about " Entry signal " and the special version of our " Price Action " strategy FOLLOW our lessons:
Take Profits:
TP1= @ 0.40790
TP2= @ 0.50240
TP3= @ 0.62700
TP4= @ 0.75600
TP5= @ 0.95900
TP6= @ 1.09000
TP7= @ 1.35700
TP8= Free

XRP/EUR GOLDEN CROSS - LONGXRP/EUR GOLDEN CROSS - LONG
In my opinion, we will start of to approx. 0.50€
