XRPEUR


XRP could kiss $0.10 - $0.08Hey everyone! I am back! Did you miss me? If you would like more analysis, please, comment and like my article.
My approach for the $0.08 / $ 0.10 target is a top down approach and I mainly use Elliot Waves Theory from Prechter et.al – (2018)
1 - I have identified a 5 impulse waves structure responding to the typical Fibonacci retracement and 5 corrective wave structure that I have called A
1) The impulse waves from September 2018 did not reach higher highs vis-à-vis the impulse waves in April 2018
2) The impulse wave from September is in 3 times which is typical for a correction in ABC (0.786 of A) in turquoise - they are moving inside B
As a consequence, if and only if we assume that A is a 5 wave corrective structure of 12345 impulse wave from April and B is an ABC corrective structure and believing that the retracements are consistent with the Fibonacci rules, C must be a 5 wave corrective structure.
It would be a 12345 impulse wave corrected in ABC 5 - 3 - 5 Zigzag - following the same rules A is generally equals to C but can correct lower... (61.8%, 100% or 1.236 in extension)
It means that XRP should correct to the below price
61.8% = $0.52 <-- failed
100% = $0.25 <-- will be tested
1.236 = $0.08 / $0.10 ?
The question is will $0.25 hold? to assume and inquiry this question I need to find a confluence to other retracement related to my current analysis...
The trendline!!
We can clearly see that XRP is evolving in descending channel. Surprisingly we find a confluence of support at 0.08
Believing that we are currently in a 5 wave corrective structure - I have been able to identify a retracement of 0.786 for wave 2
Being more granular, I have identified the first 3 waves in turquoise inside the biggest 3rd wave in red and they all respond perfectly to my retracement.
It means that we are currently in the Fourth wave - following the EW rules, we should reach at least 0.382 retracement -$0.40
The Third big wave (red) should end at $0.22 / $ 0.25
The Fourth big wave (red) should test the current level at nearly $ 0.35
The Fifth wave could be truncated and end at the same level, which is at nearly $ 0.25 and it would confirm the above hypothesis
However, the Fifth wave corrective truncation happens during bull markets and we are currently finishing a great bear market that has corrected a long 12345 wave structure
Moreover, the volume profile is showing a titanesque support at nearly $0.10
If XRP reaches $0.25, I would be able to draw a symmetrical triangle, which is a continuation pattern.
According to the Wyckoff rules, if the triangle is broken below, the base should follow down which is at nearly $ 0.10 - $ 0.08
Be aware that anything can change at any time (please, do not take my analysis as a trading advice)- this analysis is solely based on what I currently see for XRP today. I would update you if I see anything changing.
Saying this, does it change anything for the future of XRP? Absolutely not! I firmly believe that XRP has a huge potential and it will overtake Bitcoin very soon... I mean very soon– when finishing this correction, XRP will reach higher highs and I believe that the price will skyrocket!
Take care everyone.
Ma maîtrise est sans faille et mon skill sans égal
I am Magic`ArKaiN

Bitcoin vs Top Market Comparison - Daily Record Chart - ( XRP )- This chart is designed to be used as a tool to monitor the Daily market comparisons, ultimately XRP's progress.
- It seems that XRP is attempting to break away from BTC, with obvious gains against the other top market holders.
- XRP has made some excellent recent gains recently, especially with it's BTC pair XRPBTC.
- This chart indicates that XRP is in fact breaking away from BTC, and is intended for users to monitor its progress.
- Feel free to leave any suggestions or thoughts in the comment section down below.
Peace V

Ripple Technical Analysis with Updates.Hey! I am back with Another Technical Analysis with updates !
The More likes, the More updates!
This time looking again at XRP as the best performing cryptocurrency in the despair crypto market!
So why I am looking at XRP/BTC chart and not XRP/USDT?
Because the BTC chart shows actual Ripple moves , demand and way precise candles. In USD value you may see that Ripple is losing Value, when in real its just rising in value, that why we look at XRP/BTC in short.
My portfolio is almost 80% Xrp and I still havent sold any , as I am constantly looking at Xrp and still shaking my head , when looking at the strong demand which is Ripple showing us.
In my last TA on XRP I pointed out, that Ripple is acting really strong in such despair market, and thats still true !
Lets look at current situation.
Ripple has performed sharp breakout bouncing off 8731( three good demand candles ), breaking downtrend and testing 10,500 sats where XRP found ressistance, performed almost good looking double top and started retracing.
Many people though t XRP will dump hard after this ressistance was found, and in the panic in this despair market they sold their XRP .
So ripple actually dropped to 8,980, and immediately bounced off performing crazy long 15% candle, this is just another sign of XRP strong demand.
After that another ressistance was tested and another sharp test of 9,400 has occured , which result was a sharp bounce , crazy how XRP acts.
Strong volume was still in XRP and price has been fluctuating strongly, but has managed to stay relatively stable currently fluctuating between support of 9,640 and ressistance of 9,775 .
And once again , XRP is in good known low volume period of consolidation waiting for another sharper move to come.
Its a good bullish sign that XRP can stay such stable even after such sharp moves and despair market.
Okay, so candles, Volume, trend and demand based on candles looks good , are Indicators looking good as well? Lets take a peek.
MACD - Shows another healthy bullish cycle, after one strong buying wave, two average selling waves occured. Lanes headed to neutral zone where Blue lane is very likely to overtake slow lane.
RSI - Seen some double tops, after second double top, a strong RSI support has been found and its somehow still uptrending, so bassicaly after a good runup , ussualy a lower demand is seen as profit taking but this time once again, its still above average, another bullish sign for XRP.
Conclusion.
Ripple will fluctuate with low volume in this tight price range for a short period of time, after that sharper move to retest 10,500 is very likely to occur.
Its hard to tell when as volume comes unpexctedly in low volume period, but after ressistance of 9,775 will get broken volume will come for sure!
Thats al l from me, for now. If you agree with this Technical Analysis , consider leaving that " Agree Button " blue , as it leads me to post more similiar Technical Analysis .
Thanks for your time and good luck trading!

XRPBTC: Are You Afraid of The Market? Well, Don't be...Hi All,
Hope all your trades are going well, It's All in the Chart.
"Be Brave, Be Deterministic, Overcome The Odds, It can be Done." ― Stephen Hawking. Both Time & Change will occur with or without us. Start today by preparing to do what is necessary & by the time you realize it, you're doing what others perceive as impossible, due to their self doubt of their own mental fortitude. And remember procrastination only leads to failure instead of success. Fully understand that 2018 has been bear market And a lot of people over extend themselves in the market. However it's no reason to be dismay nor feeling despaired.
Never forget its Mind over Matter. Start by changing how you think, act, react, how you treat others, how you treat yourself & letting others know your intentions. Then you can start responding to different obstacles in a positive manner, instead of reacting to life obstacles. Only then, will life start responding to you (you).
You can do it with different variance of your life not just crypto or investing. You are somebody, you do matter, you can make the necessary changes which are needed to change your life for the better, you can accomplish your dreams by setting goals and creating plans which prepares you for all unforeseen obstacles. You are the master of your destiny. Lose your victim mentality, by never blaming others for what is out of your control.
“Watch your thoughts; they become words. Watch your words; they become actions. Watch your actions; they become habit. Watch your habits; they become character. Watch your character; it becomes your destiny.” ― Lao Tzu.
Focus on what you can control and be repetitive so it becomes second nature to you. Take responsibility for your words, acts, or your actions, and take ownership of your mistakes and apologize. "Strengthen your confidence to be your true self in a world of people who don’t know who you are, where you come from, or what you know. " I firmly believe in you all.
For the past couple of days I have read many articles making claims such as the King BTC is Dead and so are the other cryptocurrencies. These articles shared their views and provided reasons as to why these publications believe the industry as a whole is very risky, creates a gamblers mentality, or self identification to the underline assets. And that is perfectly fine because we as investors and traders within the Crypto sphere, should be objective and open minded when reading or listening to counter argument as to why we maybe wrong in our assessments of the overall market.
By no means does this give us the right to call their articles or podcast bias, uninformed or FUD. Because I want us all to remember these news publications, economist, central bankers, authors, and so on and so forth currently govern our reality via different publications & media outlets. So it becomes extremely easy for these companies or individuals to investigate our market to understand the market dynamic and or to manipulate it. One thing I would like for all of us in the Crypto sphere to always keep in mind, decentralization fight maybe lost in the short term due to governing bodies, scams and ICO.
Remember crypto movement is not a quick get rich scheme, nor a short term adoption process by the masses. When investing never invest any amount you are not okay leaving and forgetting about for 3-5 years or even longer. Also when investing into a newer asset, the risk factor surpass even long term speculative markets such as bonds, mutual funds, housing, stocks, or even fiat.
Hence never invest more than you can afford to lose. Never leave yourself susceptible to manipulation. Crypto as a whole as a great deal of work ahead of each project I.e., scaling solutions, custody, Dapps for the masses to utilized, easy on and off ramp without the masses knowing they're using Crypto, governing policies, regulations for ICO & STO. Reason why I remain a firm believer in long term investment in this market. Regardless if I'm wrong or right, because until there are fully functioning Dapps we are just speculating. As someone who works in the IT industry, I understand website and application development are already tough enough.
Developers are now trying to Implement Dapp Utilizing cryptographic keys on a peer to peer basis. These task is currently unfeasible for scaling because the larger the node count the more decentralize the network becomes. However, these projects are sacrificing scalability for centralization. Mainly, because the more node count the slower the network becomes which is why most projects are starting to Implement side-chains. Decentralization network does not require every transaction to register on to the blockchain for a successful throughput.
This is why it becomes Imperative for the creators of this projects to start focusing on fewer Implementation of the Dapps which are being created. Instead of creating a jack of all trade Dapps. Developers should instead focus on creating two to four utilization for both Dapps and Platforms. White papers are simply fantasies unless implemented and products a build from them. Please remember this is technological revolution which will take time to develop. Only focus on price action if you are trading.
Be sure to follow me and like this post if it was helpful, and thank you all.
Like the Phoenix we will rise from the ashes
Happy trading People....

XRP can be 20$!!!!Due to bullish market that happened in the XRP in the last days it seems bulls are back to this coin and we can expect more raising with this volume, but aside from the psychology of the market let’s take a look into its TA.
Price has started it’s raising with a pin bar candlestick from the intersection of the bottom line of red and the blue channel and for now I believe the first target would be the top of the blue channel around 3.3$-4$. Although it is possible that price meets the bottom line of the red channel again and start it’s move from there.
In the middle we have a strong resistance on 0.9752$ and also the middle line of the blue channel and if these resistances break out price will meet 3.3-4$.
In a big picture I think if price breaks out of the blue channel from top we can expect to see ripple around 20$ in the early of 2019.

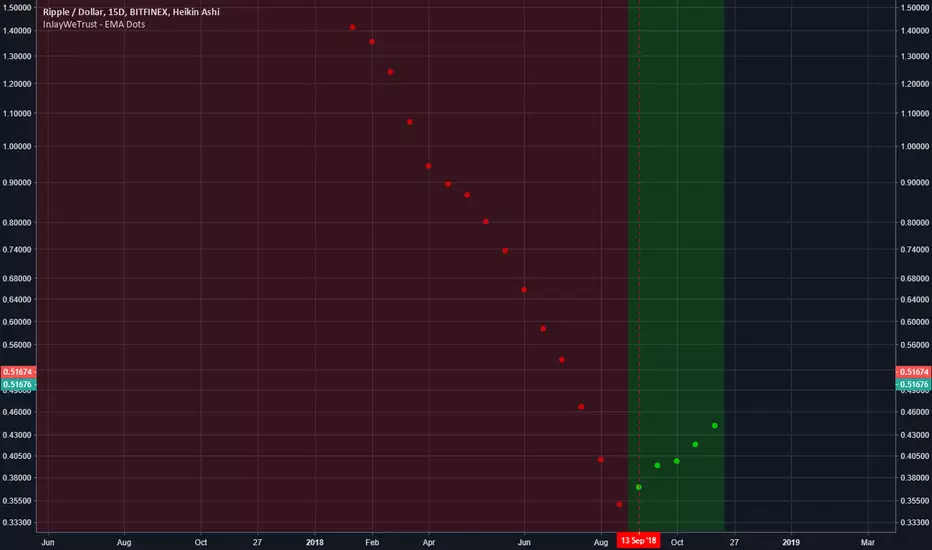
Should of got XRP/RIPPLE 2 months ago.Buy Green
Sell Red
//
it's mainly for swing trading, i use the 3 day / 15 day / monthly charts with it and it works perfectly,
//
it works good for stocks and cryptocurrency.
//
you will use heiken ashi chart style and turn on the EMA DOTS indicator.
once the indicator is on you will hide the heiken ashi so you only see the dots.
//
when a green dot -0.78% -6.68% -7.44% -7.44% appears you buy, if a green dot -0.78% -6.68% -7.44% -7.44% appears after that green dot -0.78% -6.68% -7.44% -7.44% you hold your investment.
if a red dot appears you sell your position. easy as that.
//
the standard dots setting will be set to 10 - use this for any chart above 3 days
change the dots setting to 6 for 3day charts and below
//
shorter time frames will be choppy.
//
larger time frames will be smooth.
//
*Daytrading smaller timeframes is possible but not recommended.
It's a bullflag XRPEURHello all,
hope you are having a great day.
This is a quick post on XRPEUR -0.51% which seems to be forming a bullflag at the moment. Once .464 EUR is broken, the next short-term target is around .486 EUR. The medium-term target is around .526 EUR and dependening on the momentum the price may extend to the 1.618 Fibonacci level at around .55 EUR, where I expect a major retracement.
Comments are welcome.
Please like & follow for more TA.
DISCLAIMER:
This is neither a trading nor a financial advice.
You are responsible for your own actions so do your own research.

Bullish on XRPHistorically November and December are bullish months for XRP, I have marked supply and demand levels in this Idea, Green zones are potentially Buy zone and red is a Sell zone.
TP 1 - 0.60
TP 2 - 0.80
If cross $1 then look for last year high which was $3.40
Good Luck :)

Trade RIPPLE / XRP easily with 1 indicatorBuy Green
Sell Red
//
it's mainly for swing trading, i use the 3 day / 15 day / monthly charts with it and it works perfectly,
//
it works good for stocks and cryptocurrency.
//
you will use heiken ashi chart style and turn on the EMA DOTS indicator.
once the indicator is on you will hide the heiken ashi so you only see the dots.
//
when a green dot -7.44% appears you buy, if a green dot -7.44% appears after that green dot -7.44% you hold your investment.
if a red dot appears you sell your position. easy as that.
//
the standard dots setting will be set to 10 - use this for any chart above 3 days
change the dots setting to 6 for 3day charts and below
//
shorter time frames will be choppy.
//
larger time frames will be smooth.
//
*Daytrading smaller timeframes is possible but not recommended.

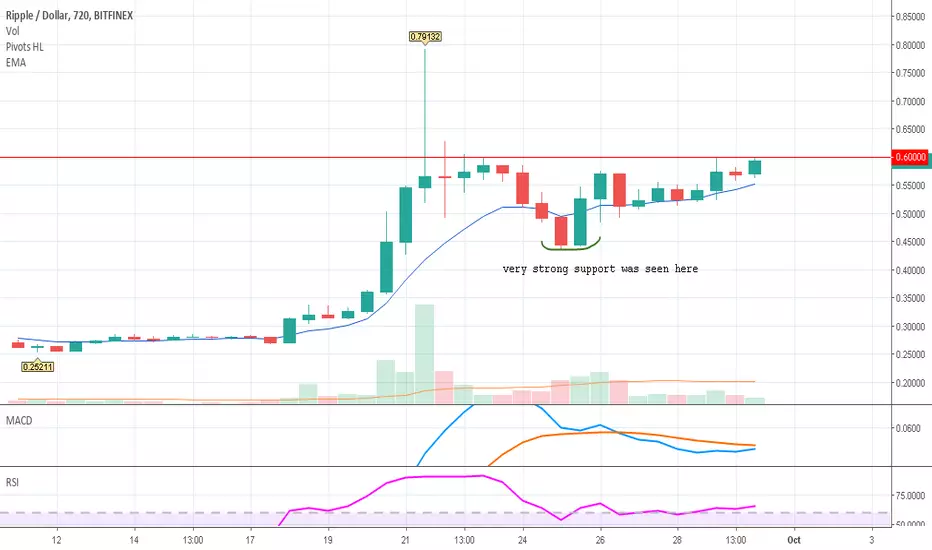
Short-term view on XRPWhat's up beloved crypto family. XRP is.
After a 20% charge from 0.46 up to 0.56. My sentiment on Ripple (XRP) is largely bullish. Currently the price is in, what could be, a bullish pennant. Look for a trend continuation.
Other wise, if the price is to break below the current triangle forming - look for a long position around point A.
Full disclosure - I am holding a large bag of Ripple - so you can be certain there will be a degree of bias in my current and future analyses.
Once again - hit me with a follow if you agree with this idea :)

#XRP the Road to $0.60 Plus... #XRPcommunityLooking like a solid break-out from that wedge in yellow, which we expected, pretty much right on que. Getting above the $0.54 cent mark is the first hurdle now being hopefully tackled. Next stop $0.60! And then hopefully up into that Support line channel from a time back.


tight range dominates Ripple
The tight range dominates Ripple price trades that settles around 0.44, thus, no change to the bearish trend scenario that depends on the price stability below 0.52, while its targets begin by breaking 0.42 to open the way to head towards 0.24 as a next main target


Planning to buy in the 0.29 - 0.30 EUR zoneLooks like we will get a 2nd chance to get in at an interesting price.

A trading opportunity to buy in XRPEURTechnical analysis:
. RIPPLE/EURO is in a range bound and the beginning of uptrend is expected.
. The price is above the 21-Day WEMA which acts as a dynamic support.
. The RSI is at 67.
. The RSI downtrend & The price downtrend in the daily chart are broken, so the probability of the resumption of an uptrend is increased.
Trading suggestion:
. There is a possibility of temporary retracement to suggested support zone (0.41700 to 0.30300). if so, traders can set orders based on Price Action and expect to reach short-term targets.
Beginning of entry zone (0.41700)
Ending of entry zone (0.30300)
Entry signal:
Signal to enter the market occurs when the price comes to " Buy zone " then forms one of the reversal patterns, whether " Bullish Engulfing ", " Hammer " or " Valley " in other words,
NO entry signal when the price comes to the zone BUT after any of the reversal patterns is formed in the zone.
To learn more about "Entry signal" and the special version of our "Price Action" strategy FOLLOW our lessons:
Take Profits:
TP1= @ 0.64700
TP2= @ 0.75600
TP3= @ 0.95900
TP4= @ 1.09100
TP5= @ 1.35700
TP6= @ 2.01000
TP7= @ 2.49900
TP8= Free


XRP LOOKING FOR MORE UPSIDE.XRP is currently resting at previous resistance, now turned support. The swell event could further fuel the pump. Remember: sell the news.

Is Ripple Ready for another Impulsive Wave?Hey, I am back with another idea, this time looking at something else than Bitcoin, Ripple !
If you arent interessted in reading a lot , just scroll down to bold highlighted text where I point what is most likely to happen based on my TA.
I suggest read it whole, but I accept when someone wants to go straight to the point!
Ripple was very stable in september and price hovering around 30-25 cents and than the price wasnt moving at all. Ripple has shown strong stability and very low daily price change , thats when I knew, Ripple was ready to pop, shame I havent made TA here and only informed my group, but nevermind..
Ripple has shown a very strong move even trought the fact that XRPSHORTS have broken out so hard, and many people tried to push Ripple price lower , but unsuccesfully .
Enough talking , lets look at what Ripple past suggests, what is current situation and what moves is Ripple most likely to see next .
Lets go in Chronological order and keep it simple and compare Ripple past to current time.
The setup looks almost the same as last XRP breakout
Almost same % retracement from highest top to lowest level.
12h MACD found uptrend at high spot , same like this time .
12h RSI has found support right above bullish level 60 and sees uptrend, same like this time .
Will post comparisons in updates.
Lets look at current situation.
Ripple has seen strong runup, after which we´ve seen profit taking ,shorting, but the demand was really strong and Ripple popped right back from 44 cents to test 57 cents , which you may consider as current support (0.57$) and then remained pretty stable . Stability after runup suggests another runup may occur.
After that Ripple has tested key ressistance of 60 cents twice , unsuccesfuly but found support way high , which is good bullish sign , and its still uptrending !
What is my opinion XRP based on my Technical Analysis?
Most likely the 0.79$ breakout was just a first impulsive wave , 0.44$ as the start of third , longest wave.
Ripple has to break 0.60$ ressistance in order to break free and see another impulsive wave.
Target? End of wave 5.
If you liked this Technical Analysis, dont forget to leave a like if you find this TA on point, Thanks a lot!
Long centralization/regulation/utility/banker/bieber coin
Peak muh decentralization maximalism
Fundamentals call for increased regulation
Actual (production) utility expected
Short crypto-anarchism
Long Justin Bieber and Ariana Grande followers despite musical taste
