Ripple (XRP) - What happens next?Self explainatory. START BUYING RIPPLE. Emotional market cycle is so obvious here I really have no idea why people aren'r screaming to buy,buy and buy Ripple.
I don't care if you think that's a shitcoin. I'll be making money out of it nevertheless.
V
XRPEUR


Symetrical Wedge & Elliot Wave on XRPEURHi,
A this moment XRPEUR is in a symetrical wedge.This pattern could be bullish or bearish.
I guess an Elliot wave has taking form and the third elliot wave is forming at this very moment.
So i'm expecting a huge resistance at 0.66. The first scenario (red) will drop XRPEUR, probably to the support at 0.50.
The second scenario, more optimistic will continue the uptrend to 0.90.
Sell : 0.65
Sell : 0.90
Stop loss : 0.53
thanks for your feedbacks !

A Long-Term Trading Opportunity To Buy in Ripple/Euro ...Technical analysis:
. RIPPLE/EURO is in a Range Bound and Beginning of uptrend is expected.
. The price is below the 21-Day WEMA which acts as a dynamic resistance.
. The RSI is at 44.
Trading suggestion:
There is a possibility of temporary retracement to suggested support zone (0.55 to 0.38). if so, traders can set orders based on Daily-Trading-Opportunities and expect to reach short-term targets.
. Beginning of entry zone (0.55)
. Ending of entry zone (0.38)
Entry signal:
Signal to enter the market occurs when the price comes to "Buy zone" then forms one of the reversal patterns, whether "Bullish Engulfing" , "Hammer" or "Valley" , in other words,
NO entry signal when the price comes to the zone BUT after any of reversal patterns is formed in the zone.
To learn more about "Entry signal" and the special version of our "Price Action" strategy FOLLOW our lessons:
Take Profits:
TP1= @ 0.76
TP2= @ 0.96
TP3= @ 1.39
TP4= @ 2.33
TP5= @ 2.86
TP6= Free

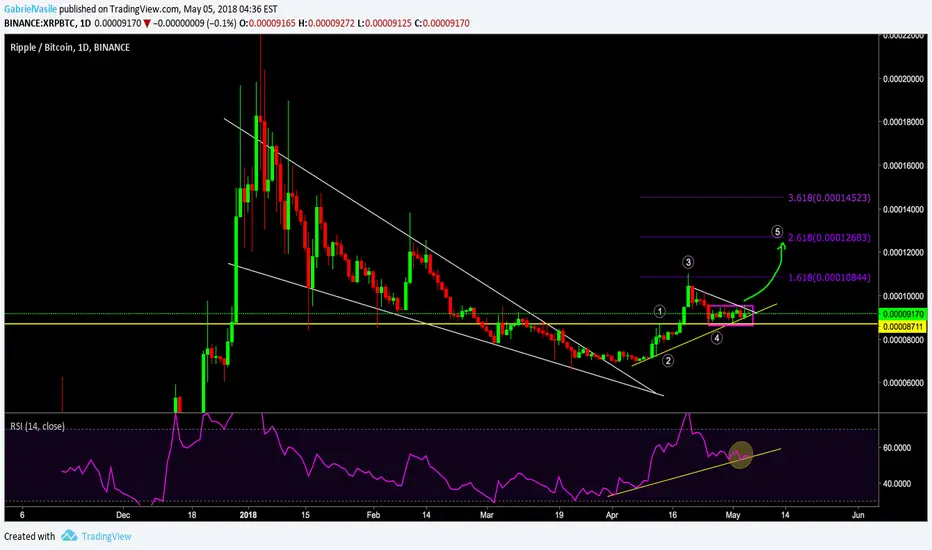
XRP going to breakoutAfter breaking a falling wedge, XRPBTC is positioned for great profits ahead completing a 5th wave to 12.5k
Ripple to go down to EUR 0.6Guys, I am novice here... and this is my first post. I see a decline and pennant forming... indicating further fall in short term... to EUR 0.6. What do you think... This is only a short term view... in long term I am very bullish on XRP due to a whole lot of other fundamental (not technical) reasons..


XRP price reversal!Over the past few months the XRP price seems to have formed a wedge pattern. As the wedge has developed it has emerged as a falling wedge indicating the price reversal will be in the opposite direction to what we have seen recently.
Once the price breaks above the upper trend line it will signal a breakout to a higher price and rally. The wedge has lasted a while, narrowing into a smaller and smaller price area helping with anticipating when then it will eventually breakout.
This could be a chance to make trades before the breakout which seems to be on the horizon over the next 10 days. For the risk averse its better to wait until the actual breakout occurs than to speculate on when it will happen.
Consider taking a long trade, and shy away from short trades.
Remember, this is only my view shared as an idea, and you should trade only on your own reasoning not mine!
Good luck and happy trading ;)


XRP REPEATING ITSELF !Traders,
Here we have XRP/BTC 4H chart.
"TIME is the most important factor in determining market movements and by studying the past records of the averages or individual stocks you will be able to prove for yourself that history does repeat and that by knowing the past you can tell the future.There is a definite relation between TIME and PRICE.
Now, by a study of the TIME PERIODS and TIME CYCLES you will learn why tops and bottoms are found at certain times and why Resistance Levels are so strong at certain times and bottoms and tops hold around them."
Ripple here is a perfect example about Gann method I explained it at the last idea here below :
And we have here short time till our entry zone.
Regards,
Mohsen


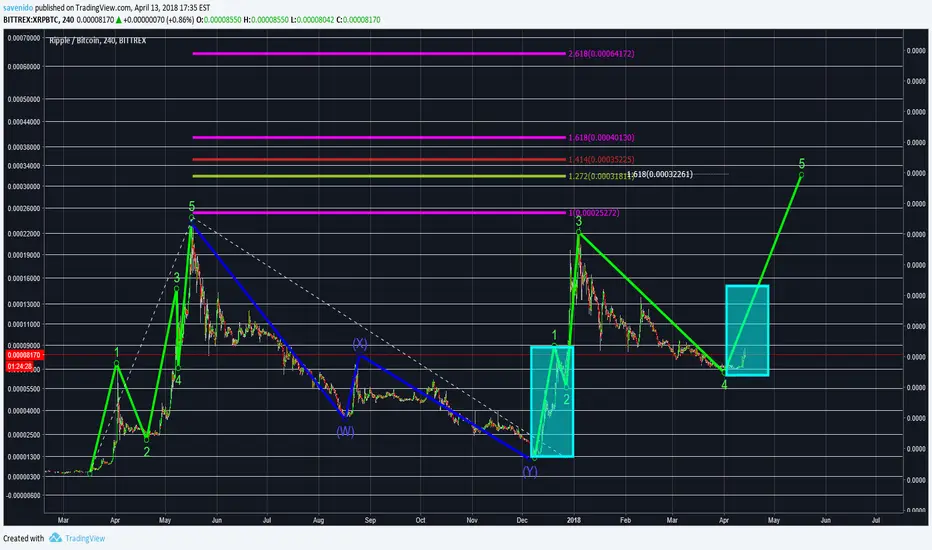
XRP longterm prediction 7 euro's, about to break outXRP is breaking out of the trendlindes within 3 days. I'm using the fibonacci retracement and extention tools and the elliot wave. 4th wave never drops into the wave 1 region.

XRPEUR forming a Gartley at 0.93 and bouncing back at 0.97XRP escaped the tiny range in which was bound few days ago without going below 0.70 and recently bouncing at 0.88€.
I believe a Gartley might be forming which will close at 0.93/0.94 € around the same level it topped on saint valentine day to go back to 0.70/0.77 and up to 0.97 (top of 17/02/2018)..
What do you think.. could this be accurate?


Is there a gartley forming? XRPEUR has been acting rangebound in the last few days and currently is trading in the range 0.69 to 0.80. I've noticed this clear pattern forming but I'm no expert. What do you think?

XRP CRITICAL POINT ! Traders,
Here we have XRP/USD 4H chart.
We have a bear Regressive here with a critical point located in crossing of trend from all time high and crossing the temporary bear trend, so if we have closed candle above this point, we will see bull trend and have a new highs and high again that's my 1st vision
2nd vision and my humble one decline to retest the strongest support level at 0.70 again and launching from there trade safe guys.
Regards,
Mohsen


xrp price analysis (some important updates on ripple)hi friends
I'm on the 4 hrs chart of ripple its forming falling wedge on xrp chart right now its showing strong support on that 8700_9000 sats mark
if your thinking to buy ripple then 8700-9000 sats will be the good mark according to chart
Note= bitcoin is not stable now whole market is dumping so its my personal suggestions to wait for some uptrend
very strong support 8700-9000 sats
if your a day trader then you can put order around 9000 sats and sell at 9350-9400 you can play trading like this but this is very risky stop loss will be must and for long term its price gonna hang on around 87--9200 sats for some long time
good luck
stay bless.

