XRP's Failed Structure Break Signals Further ConsolidationFenzoFx—XRP/USD currently trades around $3.045 in a low-momentum market. Stochastic exited the overbought zone and is declining, signaling strengthening bearish momentum. The failed structure break in the New Session suggests a liquidity sweep with weak bullish interest.
Immediate resistance stands at $3.091. Technically, price is expected to decline toward the previous day's low at $2.931, a key liquidity zone. Please note that the bearish outlook is invalidated if price exceeds $3.091.
Xrpforecast
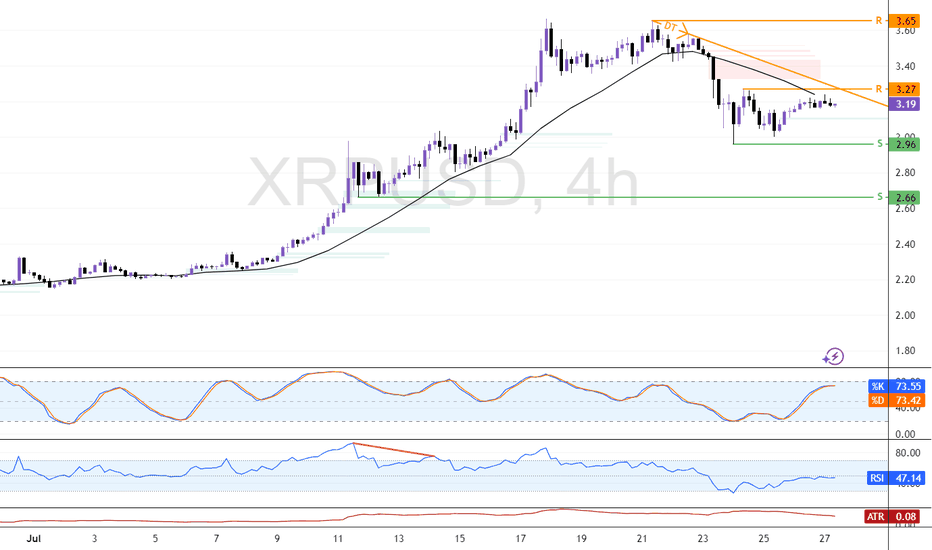
XRP Confronts Daily SMA ResistanceFenzoFx—XRP remains bearish, trading below the 50-period daily SMA at around $3.18. The SMA acts as resistance. Immediate support lies at $2.96. A break below this level may trigger further downside toward the $2.66 demand zone.
On the upside, a close and stabilization above $3.27 would invalidate the bearish outlook. In that case, momentum could push prices toward the previous highs at $3.65.
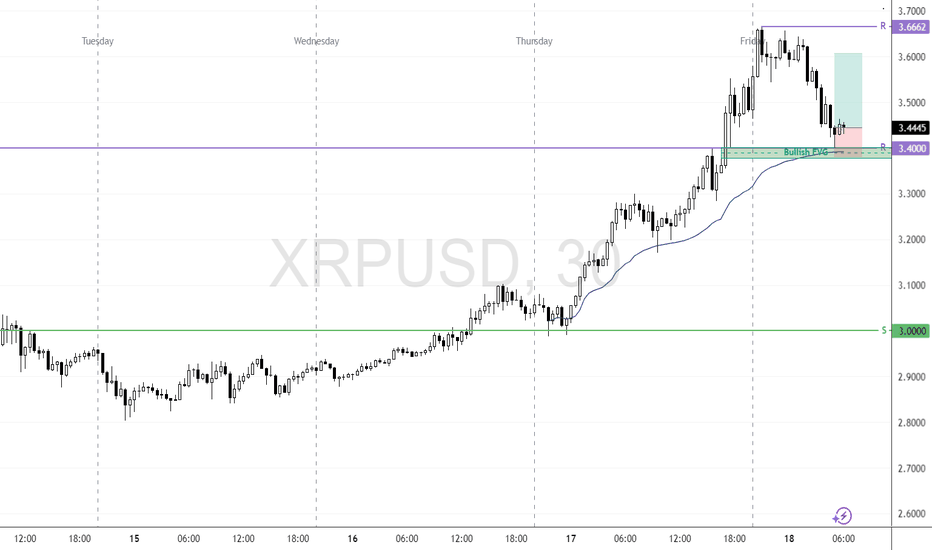
XRP Retests Previous All-Time High as Bullish Setup DevelopsFenzoFx—XRP (Ripple) is tested and has stayed above $3.40, the previous all-time high. This level acts as support, backed by the VWAP from Thursday's low and the bullish FVG.
If this level holds, we expect the cryptocurrency to aim higher, targeting $3.60, followed by $3.66.
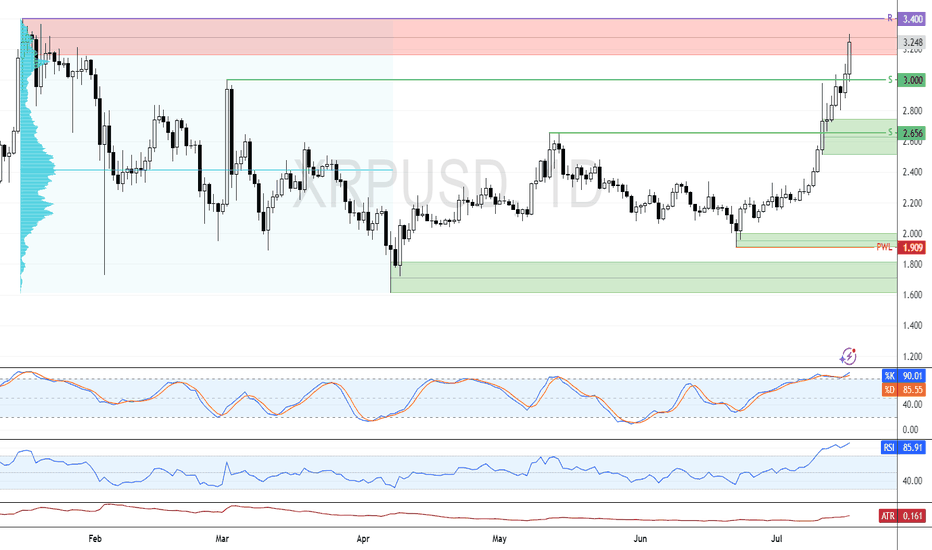
XRP: Order Block at $3.40 Could Cap The RallyFenzoFx—Ripple's bullish momentum resumed nonstop, offering no clear pullback for entry. Currently, XRP is testing resistance at $3.40 within an order block. Momentum indicators remain in overbought territory, signaling short-term overpricing.
Volume profile shows limited resistance at present levels, suggesting a likely retest of $3.40. If this resistance holds, a pullback toward support around $3.00 is expected. This level can provide a discount to join the bull market.
XRP Cools Near $3.00 Amid Overbought SignalsFenzoFx—XRP remains bullish after piercing $3.00 earlier this week but cooled near resistance. Trading around $2.90, Stochastic (~84) and RSI 14 (80) indicate overbought conditions, suggesting consolidation.
We anticipate a pullback toward $2.66 support before resuming the uptrend. Alternatively, a decisive break above $3.00 would target $3.21 next.
XRP Pushes Toward Breakout as Momentum BuildsFenzoFx—XRP is bullish, attempting a breakout above the $2.34 resistance. Stochastic at 70.0 and RSI at 63.0 signal strong momentum with room for further upside.
A close above $2.34 could push XRP/USD toward the next target at $2.48. However, the bullish bias remains valid only above the $2.16 support—dropping below this level could reverse the trend.
XRP: Break Above $2.338 Opens Path to $2.480FenzoFx—Ripple (XRP) eased near weekly highs of $2.338, with Stochastic and RSI 14 signaling overbought conditions. The trend stays bullish above the anchored VWAP or $2.165, but consolidation toward $2.2240 is expected before resuming.
A break above $2.338 would target the next supply zone at $2.480.
Ripple Consolidates with Bullish Bias IntactXRP was rejected at the previous week’s high of $2.34 and is currently testing support at $2.22. As long as it holds above $2.16 or the 50-SMA, the bullish trend remains valid, with $2.34 likely to be retested.
On the flip side, a close below $2.16 could trigger a decline toward $2.07.
Bearish Setup Forms for XRP Below $2.21FenzoFx—XRP trades around $2.18 after forming a long-wick bearish candlestick above $2.17 support.
Stochastic reads 83.0, indicating overbought conditions. A close below $2.16 with a bearish engulfing candle could lead to $2.08. A close above $2.21 would invalidate the bearish outlook and open the door to $2.33.
XRP Builds Bullish Outlook as $2.08 Support Holds StrongFenzoFx—XRP bounced from $2.14 and trades near $2.17, approaching resistance at $2.19. The market remains bullish above the $2.08 critical support. A close above $2.19 could lead to targets at $2.23 and $2.24.
The bullish outlook is invalidated if XRP/USD closes below $2.08.
Ripple Trades Sidways: What's Next?FenzoFx—Ripple (XRP) remains above $2.091, trading sideways in a low-momentum market. With support at $2.091 and resistance at $2.218, the trend is bullish as prices stay above the 50-period SMA.
The uptrend could extend if XRP/USD closes above $2.218, aiming for $2.355. However, a correction may begin if prices fall below $2.091, with $1.999 as the next support.
>>> No Deposit Bonus
>>> %100 Deposit Bonus
>>> Forex Analysis Contest
All at F enzo F x Decentralized Forex Broker
XRP Tests Critical Resistance LevelFenzoFx—XRP/USD has gained 23.0% since April 7, testing $1.999 as resistance. A close below this level could trigger a new bearish wave, targeting $1.736.
Conversely, if the price exceeds $2.10, the bullish momentum could potentially extend to $2.218.
Trade XRP Swap Free at FenzoFx Decentralized Broker
Ripple: Short-term Sell-offs ExpectedRipple’s recent upward push didn’t prove to be sustainable. Anyway, we primarily anticipate another significant sell-off, which should drive the price down into our magenta Target Zone between $1.69 and $1. These declines should allow the corresponding corrective wave (4) to establish a proper low. Only after this bottom has been settled do we reckon with the extended rise of the magenta wave (5), which should target new all-time highs beyond the $3.39 resistance. If XRP breaks above this green level sooner than primarily expected, the magenta wave alt.(5) will begin prematurely. Under this 33% likely alternative scenario, the magenta wave alt.(4) would have already concluded with the February 3 low, and our magenta Target Zone wouldn’t be reached.
XRP/USDT Short Opportunity: Daily CHoCH and Fresh Supply Zone XRP/USDT is presenting a high-probability short opportunity as it approaches key technical levels. A Change of Character (CHoCH) on the daily timeframe signals bearish momentum, while a fresh H1 supply zone at $2.42 could serve as a strong resistance point. With these factors aligning, a potential downside move to the $2.18 level is in focus.
Key Technical Factors Supporting the Short
Daily CHoCH Formation:
XRP/USDT has printed a CHoCH on the daily chart, indicating a shift from bullish to bearish market structure. This signals a possible trend reversal as sellers begin to take control.
H1 Fresh Supply Zone at $2.42:
On the H1 timeframe, a newly formed supply zone around $2.42 aligns with the bearish narrative. This zone is likely to act as a strong resistance, providing an ideal entry point for short positions.
Target Level at $2.18:
If the supply zone holds, the next logical support level lies at $2.18, making this a reasonable take-profit target.
Risk Considerations
Volume Confirmation: Ensure there is bearish momentum (increased sell volume) as price taps the supply zone.
Invalidation: A clean break above $2.45 would invalidate the short setup.
Ripple: Approaching Our Target ZoneWhat a strong sell-off for XRP! Since last Friday, Ripple has dropped nearly 45%, yet it still hasn’t reached our magenta Target Zone between $1.69 and $1. While XRP saw a strong rebound after the sudden plunge, the magenta wave (4) should still head for a lower low within our Target Zone in the short term. Only after this price range has been reached do we anticipate the following magenta wave (5) to strive for new record highs above the resistance at $3.39.
Ripple Stronger- Ok Ripple is back.
- Maybe the SEC will one day give up trying to perma-suppress XRP market to protect the big banks.
Little facts :
--------------------------------------------------------------------------------------------------------------
- XRP lost -96% from his 2018 ATH and bottomed hard around 0.12$.
- XRP lost only -86% from his 2021 last ATH to find a bottom around 0.28$.
- During those 2 years of bear market, XRP stayed most of the time very strong and resilient.
- Nothing was tremendous ( as it should be ), XRP just climbed with steady regularity.
- XRP stayed in the TOP5 of the Total Market.
- That's much better !
--------------------------------------------------------------------------------------------------------------
- So what we can expect for the next bull run ( if we don't have again a FUD at the bad time )
- We have to keep in mind that XRP have 100B Supplies.
- XRP price could grow at a maximum of 7$ at the end of the next rally.
- That would be around +2400% from the 2022 last bottom.
- His MarketCap could grow around 700B$ ( same as actual BTC MarketCap)
--------------------------------------------------------------------------------------------------------------
Happy Tr4Ding!
XRP moonshot incoming?!Based on previous priceaction on the weekly timeframe i think we will soon be ready for the long awaited XRP moonshot. This would fit perfectly with a resolution for the Ripple/XRP SEC lawsuit... hold tight my friends!
hold .33$, clear and gain .75$ and 2$ ... new ATH incoming!
One final draw down possibility!As you can see from my accurate predictions drawn up since September 29th, we have one last chance of a big dip coming. This will end my predictions for this period.. and I expect a push to all time highs by mid-April.
May be one last chance to buy Xrp at under 55 cents... and ultimately last final calls for under $1 USD!!
Expect a pull back in a few days to 5 days time.
177 days of Xrp predictions ending.We can finally see the end of my Xrp predictions coming to a close in 32 days! This was all drawn up on September 29th 2023 & now we can see the outcome of Xrp's entire price over this time.
It's been one heck of a long time and how accurate do you guys think I've been?
This is my 2nd one for Xrp. The last one was 99 days. So this one is my best effort and longest yet! Don't say you didn't make any money because I did!
We're in the last 32 days and then I'm expecting the bullrun to begin playing out after one last final dip in price. Don't miss it. It may be the last opportunity to buy Xrp at these golden low prices under a dollar!
The trendline that keeps on keeping on giving!So here we have my minimum price prediction for Xrp come 2031! I believe that minimum price WILL BE $7 and no less in 8 years! This trendline has been just paying everyone in Xrp since Xrp's inception.
I don't see this stopping anytime soon especially for Xrp's adoption in the next 8 years!
You can be safe in the knowledge of how much you'd like to invest into Xrp and/or dollar cost average in.
If prices tend to go higher than the minimum forecast for 2031 in the nearest future.. over the next year or two would probably be a good time to consider selling a portion (or percentage) of your Xrp. Don't ever let your earnings go back into the downturn if there's such good opportunity to sell at lucrative highs. So this would be a good guideline to follow so you don't miss out on potential future profits.
Happy earnings and prepare now.
Update for current Xrp prediction pathway.Obvious from the current drop.. and comparison to my predictions for Xrp that was drawn up on September 29th. My prediction path is slightly ahead of the forecast but you can see it's still rhyming.
It's also noticeable that the huge dropdown wick we just had (probably a bot trade) didn't fall too much past our first initial trendline. It's been a support that's a strong gradual incline since Xrp's inception and so there's no reason why prices will ever go much lower but continue until the next bullrun. I believe this bullrun will begin from February to March so be ready!
How not to fall at the final hurdle...This is the moment that I believe is the last stretch for Xrp moving into the New Year 2024 and onwards towards March!
Don't let things bother you if we see this final average downturn. It'll be big buy opportunities before we go ahead to test all time highs!
This is accumulation stage and final chances to dollar cost average in on the red candles. See you on the other side ↘️➡️↗️⬆️


