XRP 12h What's closer to your heart? Buy at0.27$ or sell at1.20$Today we will look at a possible scenario of XRPUSDT movement on a large time frame, as our previous short-term XRPUSD idea gained more popularity.
The previous idea, albeit with difficulties, nevertheless reached the target of $0.60 and even slightly higher.
Then a strong coin fall awaited us, the main trigger, of course, was the fall in BTC
The fall was more than 40% and, unfortunately, the exchanges liquidated most of the long positions in those who like margin trading without stops. Don't trade like that ...!
If we look at the picture globally, we can see the big consolidation in the triangle, which started back in November last year. T he upper border of this triangle passes somewhere through $0.73-0.74 , if the price can gain a foothold above, then we will face growth in the XRPUSD pair
However, if you look in more detail, we will see that this month the XRPUSDT price tried to break up the $0.57-0.63 zone three times, but the buyers were defeated.
If they do not break up and from the fourth time, then buyers may completely surrender, and this may entail a fall in price to $0.27
Therefore, be careful and sensible when trading Ripple
_____________________
Since 2016 , we have been analyzing and trading the cryptocurrency market.
We transform our knowledge, trading moods and experience into ideas. Each "like under the idea" boosts the level of our happiness by 0.05% . If we help you to be calmer and richer - help us to be happier :)
Xrpforecast

XRPUSD Ripple Buy Long - New Day Week Highs imminent ' Forecast Having just really moved sideways over the past week we still see No Good Reason to be short here.
XRP Sellers may be rewarded if right, but clearly the Risk to Reward opportunity is still with the buyers.
As stated in previous post the Crypto Market is extremely Volatile & anyone trading it has to have both their
MONEY MANAGEMENT
& Trading DISCIPLINE In Check .
The swings in the Crypto currency market don't take any prisoners.
It's easy to get completely wiped out using excessive leverage without good knowledge or discipline.
Any how we are still long XRPUSD ripple and will wait for the ride to begin.
Many times the market will have a trader trading in and out of a position many times exhausting their patients before the market makes the big move one was waiting for.
For that reason we build a plan based on preferred and optional entry areas, when trading crypto and wait for the opportunity to enter, then just sit back and let the market do the work.
(Nothing in trading is guaranteed but you can't win if your not in)

RIPPLE (XRPUSDT/XRPBTC) Daily Trade Setups 2021/02/18Hi guys! I will be sharing the trades that I take in real time, follow to see how my trades work out!
If you like this post, please support me by clicking the like and follow buttons. Also feel free to share your thoughts and analysis in the comments below!
And don’t forget to check out my daily analysis on Bitcoin & Ethereum!
Trade Setups
Below are the potential trade setups that I would be interested in trading:
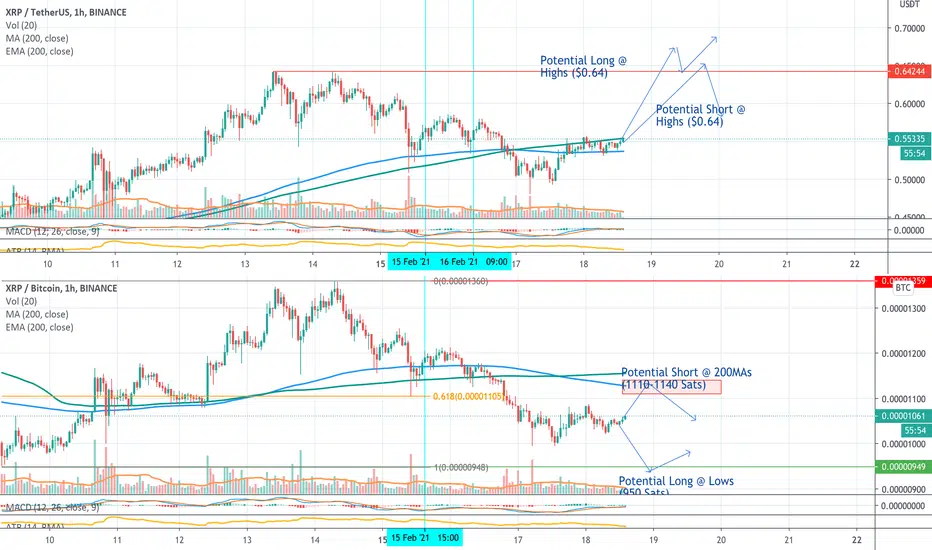
XRPUSDT
Long Trade Setup #1: Breakout and Continuation
1. Price Action: Price breaks above and falls back down to $0.64 and bounce back up.
2. Trade Entry Confirmations: Bullish candlestick pattern, above average volume, MACD bottoming
Short Trade Setup #1: False Breakout
1. Price Action: Price breaks above and then falls below the high @ $0.64, forming a bull trap
2. Trade Entry Confirmations: A breakout candlestick followed by a breakdown candlestick, above average volume on both breakout candle and breakdown candle, MACD topping out
XRPBTC
Long Trade Setup #1: False Breakdown
1. Price Action: Price breaks below the then rapidly climbs above 950 Sats, forming a bear trap
2. Trade Entry Confirmations: A breakdown candlestick followed by a reclaiming candlestick, above average volume on both breakdown candle and reclaiming candle, MACD bottoming
Short Trade Setup #1: Retest and Continuation (200MAs)
1. Price Action: Price needs to move back up to the 200MAs, currently projected to be @ 1110-1140 Sats by the time price reaches it, and bounce back down.
2. Trade Entry Confirmations: Bearish candlestick pattern, above average volume, MACD topping out
About Me
I started trading in 2008, first got introduced to bitcoin in 2009, and have been actively trading cryptocurrencies since 2016.
I have worked on Wall Street trading bonds, stocks, and options.
I have taken hundreds of live trades, each recorded with over 50 data points, all meticulously analyzed, using data analysis and modeling to optimize win probability and risk reward.
Why Follow Me
Daily analysis on the latest market movements and price zones for high probability trade setups.
Sharing of live trades that I take.
A great place to help each other, learn from each other, and grow together.
Trading education including a comprehensive cryptocurrency trading eBook, personal advice, and other educational materials
Constantly testing and adding new trading strategies and refining battle-tested ones.
DISCLAIMER: I am NOT a financial advisor and this post is NOT financial/investment/trading advice. I will not be responsible for any actions you take based on the analysis and comments that I provide. I am simply sharing what I am doing, and is not meant to be investment or trading advice. What you choose to do with the information that I provide is your own sole responsibility! The cryptocurrency market is extremely volatile, and you WILL lose all your money if you are inexperienced! DO NOT risk any money that you cannot afford to lose and always be cautious and manage your risk!
Please support me by liking and following, and sharing your ideas and analysis in the comments! Thanks!
XRPUSD Higher? We still like the long side of XRP buy pullbacks Although XRP has been in the headlines a lot recently regarding US regulators we still like the long side of this Crypto currency and have been adding to our exposure since its major selloff.
However we dont see a great location to add to our position around these levels.
Unless one is prepared to have a considerably high risk tolerance to this Crypto we would avoid adding here and would prefer lower prices first, Alternatively we would consider adding higher once the new breakout occurs with a better idea of where we would have an acceptable risk.
Crypto currencies have a tremendous amount of volatility and so if you are not prepared for large percent % drawdowns one would do best to pick strategic entry points or trade a different asset class completely.
On the other had if one is building a long term portfolio of crypto holdings then averaging into XRP/USD with more flexibility to precise price levels is not a bad idea.

XRP Buyers are preparing for a test of $0,78It took only two days for buyers to start trying to build a growth trend again . The price of XRP quickly tested the range of $0.46-0.48 , which we wrote about in the previous idea :
Interestingly, the price of XRP began to rise on February 4, when BTC fell.
Looking at the volume of trades , the price is consolidating and buyers are not yet ready to take control of the range of $0.46-0.48. However, the seller's attempt to continue the wave of decline looks very weak. At the moment, the price of XRP is moving between two trend lines. To start a new wave of growth, buyers need to keep the mark of $0.4 and consolidate above the range of $0.46-0.48
It is then safest to buy this coin with the first target of $0.78.
The positive scenario in the Ripple market also hints at the XRPBTC chart:
If the attempt of sellers to break the lower trend line of the triangle is unsuccessful - we will expect a new impetus to growth in the XRP market.
_______________________
We create both short-term ideas (for a local understanding of the market situation) and medium-term forecasts of price movements.
Subscribe to us and get daily concise analytics!

XRPBTC: Diagonal patternAs you can see in the image, in the 3-day chart, the Diagonal pattern has been completed in the range of 653 and the uptrend has started, this is a very long ascending trend and its initial confirmation is that the price has crossed the range of 4264, which is at the end of the 4th wave.

XRP in Wave 3 Dear Traders
XRP is in wave 3 which will move over 0.49 then will pull back to 0.4370 and in this rate we get ready for wave 5 which will lead the market to 0.5860
All the waves are clear in the chart. in Wave 1, the subwave 5 didn't pass wave 3 and this wave made it complicated. I was planning to count wave 2 as the subwave 4 of wave 1 which was rejected because subwave 4 couldn't cross subwave 1.
If you are agree with my analysis please click the Like button I will find out we are in right decision or not.
Thank you
Best wishes

XRP - 4h. The level of $0.28 again plays a key role.After an unsuccessful attempt by buyers on January 10 to consolidate above the range of $0.36-0.38, the XRP market stopped consolidating.
A recent attempt by buyers to organize trend movement and consolidate above $0.31 failed. The critical point during this attack of buyers was the mark of $0.28 , which we wrote about in the previous idea :
The range of $0.24-026 has stood the test of time again and consolidation continues. The new attack of buyers continues at lower volumes than the previous time. Therefore, it is too early to talk about the breakdown of consolidation and the mark of $0.31.
At the moment, the price of XRP again stopped at $0.28 and is consolidating below it. If the price of BTC continues to put pressure on the range of $33400-3400 0 in the XRP market will occur shot to $0.31.
However, the situation is tense and sellers do not need much effort to resend the price of XRP to $0.24-0.26 . Moreover, if you look at the graph of the pair XRPBTC - the triangle formed has almost the same chances of a shot both up and down.
Therefore, for a short-term trade, we expect to fix the price above $0.28.
_________________________
We create both short-term ideas (for a local understanding of the market situation) and medium-term forecasts of price movements.
Subscribe to us and get daily concise analytics!

XRP-4h. Below $0.28 sellers will launch an aggressive attack.The initiative of buyers in the XRP market is in jeopardy. From December 30, buyers try to control the price of XRP without lowering it below the white trend line . Fixing prices above the range of $0.24-0.2 6 brought the XRP market back to life.
However, several unsuccessful attempts by buyers to break the $ 0.31 mark increase the likelihood of re-testing the $0.24-0.26 range .
The critical point for this scenario is $0.28. While the price of XRP is above this mark, buyers have a high chance to break $0.31 and continue to grow to $0.36-0.38.
While the price of BTC is above the range of $ 32000-33000, the XRP market has a high chance of continued growth.
Below $0.28, buyers will have to defend themselves seriously.
Is there a chance that the price of XRP will continue to rise above $0.36? See our previous idea.
_______________________________
We create both short-term ideas (for a local understanding of the market situation) and medium-term forecasts of price movements.
Subscribe to us and get daily concise analytics!

Don't Go Overboard with XRP - Use This Clean Set-up!In this technical analysis I share my current views on XRP/USD. I tried to make the chart as self-explanatory as possible, but feel free to reach out or drop a comment if you have any questions.

XRP Will Move Upwards Again, If It Breaks Through ResistanceIn this technical analysis I will walk you through a long set-up I found when charting XRP. There are a few important parts that I want to highlight on this chart.
Position:
I suggest a long position here on XRP as we see the entire crypto market trending upwards over the last few hours. Also, XRP is making higher lows and is about to break through a horizontal zone
Entry:
I wouldn't enter just yet. Though I suddenly see some bullish signals on XRP I wouldn't say it's confirmed yet. I suggest to wait for a proper breakout through the horizontal zone before you'd enter. This would be around the $.317 level.
Take profit:
As we've seen at least three times before on this chart the $.370 level is incredibly important. There is very clear resistance on this level. I suggest taking profit slightly below there to maximize the chances on a fill
Stop loss:
The risk reward is not good enough to hold it and potentially lose money towards the next horizontal level. Instead I suggest using a stop loss directly below the horizontal level to make sure you protect from downfall. Especially on an asset that has a lot of negative news like XRP has.
Follow me for consistent high quality updates, with clear explanations and charts.
Please like this post to support me.
- Trading Guru
--------------------------------------------------------------
Disclaimer!
This post does not provide financial advice. It is for educational purposes only!

XRP-4h. Buyers held $0.24-0.26 and are preparing to shoot.Despite the unpleasant situation in the BTC market yesterday, XRP buyers showed courage. Breaking the critical range $0,24-0,26 on January 6-7 gave XRP investors a signal for a probable growth of the coin. Confident control of the $0.24-0.26 range yesterday gave buyers another note of positivity.
In addition, yesterday sellers tested the critical range at lower volumes . Comparing yesterday's trading volumes with the volumes on January 6-7 , it becomes clear that yesterday's attempt by the sellers to impose a struggle was just a correction.
Confident continuation of XRP price growth is possible only after consolidating above the range of $0.32-0.33 . It is in this range that the main liquidity has accumulated, which does not allow the price to reach the first target of $0.45-0.46.
An unsuccessful attempt by buyers to break the $0.32-0.33 range will continue the consolidation between the $0.24-0.33 marks.
In the event of a new sharp wave of decline in the BTC market - we will create a new XRP idea .
P.S. what do you think about XLM idea:
_________________________________

Yet Another XRP Scalp Set-up for an 18% gain! 🚀XRP is the gift that just keeps on giving! While others panic and sell, or attempt to hold through weeks of time hoping for better days after the SEC complaint, the technical traders like you and I have been profiting a lot from XRP.
In this technical analysis I show yet another 18% gain set-up based on the horizontal resistance and support that XRP has been following so nicely.
The $.31 support level now has given XRP support on three occasions already and also shows some historical strength on the S/R flip. Since the price has reached this level again now, I believe this could be a great moment to enter XRP for an amazing 18% trade opportunity.
I tried to make the chart as self-explanatory as possible so I won't add lots of text in here. In case you have any questions, feel free to drop a comment and I'll make sure to leave an answer for you.

XRP-4h. Negative news did not kill Ripple.Ripple is alive . A small consolidation in which sellers were completely exhausted gave the XRP market a chance for new heights.
The main achievement of XRP is the return of the $0.24-0.26 range . However, no less important fact is that buyers do not allow sellers to organize a deep correction. For example, a similar negative situation occurred in the XMR market , when there was news about the delisting of a coin on one of the exchanges.
However, XRP buyers coped much better with the negative and bravely kept the price from collapsing in the range of $0.14-0.16.
In addition, the price of XRP returned to the limits of the growth channel.
Therefore, our main scenario is a test range of $0.44-0.46. According to the nature of growth in the next idea, we will write whether a correction is planned before updating the high with a target of $0.6.
We will consider the alternative scenario only after punching $ 0.24-0.26 by buyers.
_______________________________
We create both short-term ideas (for a local understanding of the market situation) and medium-term forecasts of price movements.
Subscribe to us and get daily concise analytics!

XRP Trading Strategy After the SEC Complaint [Continued]We all realise now that it is very dangerous holding XRP long term, as its future is less certain than it has been before. However, big announcements and newsworthy events only happen once every so many months. The SEC complaint will also take a very long time to play out. Inbetween those events there is plenty of technical analysis that can be performed.
I will keep sharing ideas and trade set-ups for XRP. The volatility is amazing, and the support and resistance zones are still playing out as normal. Just be careful you don't enter a trade during when big announcements are to be made. Be safe and trade with a stop-loss on XRP!
This idea shows an example of how you could trade XRP right now, purely based on TA. We are seeing a clear support and resistance zone. I know it looks small, but there's an insane 30% gap in between them.
To get a great risk-reward on your set-up make sure you buy as low as possible to the support zone (that means, the price right now is too high... wait for it to drop first!) and sell as close as possible to resistance. I'm thinking of a buy around $.226 and a sell around $.3. This gives you a risk reward ratio of 1:2.
Follow me for consistent high quality updates, with clear explanations and charts.
Please like this post to support me.
- Trading Guru
--------------------------------------------------------------
Disclaimer!
This post does not provide financial advice. It is for educational purposes only!

XRP Has Seen The Bottom - What Is NEXT?In this technical analysis I will share a trade set-up with you that many of you will have missed. The reason it is missed is because XRP is very volatile right now and lots of people focus too much on the bigger picture. They either worry about the SEC complaint or look at the chart way too zoomed out. In reality there are lots of fantastic short term opportunities such as the one I present here. Don't worry, I will explain it step by step so you can benefit as well.
Just to recap, also based on my earlier ideas on XRP after the SEC complaint came in. It is very dangerous holding XRP long term, as its future is less certain than it has been before.
However, big announcements and newsworthy events only happen once every so many months. The SEC complaint will also take a very long time to play out. Inbetween those events there is plenty of technical analysis that can be performed.
I will keep sharing ideas and trade set-ups for XRP. The volatility is amazing, and the support and resistance zones are still playing out as normal. Just be careful you don't enter a trade during when big announcements are to be made. Be safe and trade with a stop-loss on XRP!
Follow me for consistent high quality updates, with clear explanations and charts.
Please like this post to support me.
- Trading Guru
--------------------------------------------------------------
Disclaimer!
This post does not provide financial advice. It is for educational purposes only!

Wait for me... Bitcoin passing one after the ATH in a hurryBitcoin is showing immense strength and it clearly showing the the alt coin bulls the way. In full gallop it reached $33k.
Ethereum is struggling to keep up with papa bull Bitcoin and struggled to break the $775/800.
Litecoin same picture in the $140/145 range.
Ripple looks more like RIP still. A very bearish chart. The only hope are signals from Ripple or the SEC that there will be a way to avoid XRP being treating as a security.
The first hearing on Feb. 22, 2021 will be key and that is a long way from here.
So my short-term outlook is that Bitcoin will take a breather and retrace to about $30k seeking to make that level support.
Keep in mind that predictions are extremely difficult to make as this is a very bullish, but volatile market.
Bitcoin as seen today can also explode more and capture $35k.
Ethereum will like follow suit with Bitcoin and retract to about $750 to seek support there.
It may also be triggered by Bitcoin and catch up while Bitcoin takes a breather and make new highs by itself.
For Litecoin it is similar again as with Ethereum. Looking for support right now at $135.
It has the great potential just to explode as well and outperform Bitcoin and others.
Ripple is if anything a big gamble. I closed all my positions and took the hit. Very unpleasing and I partially blame Ripple (the company) for not foreseeing this and protection their community from these losses.
I am sure the SEC did not come with this out of the blue.
And again keep in mind the momentus pace we had in uptrend. And what goes up must come down.
2021 is here and the Bitcoin target supposedly should be $100k. This will not happen in 12 days with 10% each day, so keep in mind some folks will also cash in and sell and
others will push the market down only to get in again and participate again.
** Please support this idea with your likes and comments, it is the best way to keep it relevant and support me. **

XRP-1h. Above $ 0.35, buyers will restore their reputation.Given the recent negative developments in the XRP market , buyers have chosen a different tactic. Unlike most coins, which now show a steady rise in price, XRP is trying to gather strength to test the $0.35 mark. It was from this mark that the price collapse began in February 2020 and it took buyers a long time to break this level.
This mark prevents buyers from reaching the range of $0.44-0.46. Breaking the $0.35 mark can quickly raise the price of XRP by 30% .
This fact will restore investors' faith in XRP.
The critical point of this scenario is $0.27. If sellers manage to get below this mark - the price of XRP can stay at the mark of $0.25 for a long time.
P.S. Buyers managed to keep the global trend line from March 2020. let's see if buyers will be able to realize this chance.

XRP - First LL formed since October4H - XRP has formed a first LL since October.
Market is finally showing some bearish signs + Forming LH at the moment, finding the right resistance we could have a bearish move to 0.52 area or even lower to 0.48

XRPUSDT 1D-TIMEFRAME ANALYSIS✨XRPUSDT 1D-TIMEFRAME ANALYSIS✨
Hello ladies and gentlemen
This is my new idea for the Ripple
My idea is that the pair will go lower
broke down the daily support sells offs start
I hope my idea is clear
Support me by like and share
Stay Safe💯
Good luck💰

XRP-4h. Buyers where are you?The rest of the buyers , which we wrote about in the previous idea, played a nasty joke on the market.
The trend line is broken . An attempt to return her was unsuccessful. Buyers also failed to keep the mark of $0.575 to continue the local attack. At the moment, a clearly visible channel of price movements. The main target remains $0.44-0.46 .
______________________________
We create both short-term ideas (for a local understanding of the market situation) and medium-term forecasts of price movements.
Subscribe to us and get daily concise analytics!

XRPUSD to see a sideways movement(1D) | Volatility ~ 220%Market in last 1 week
XRPUSD saw an uptrend followed by a decline in price
Price volatility was very very high. The market moved ~224%, between $0.921 and $0.284
Today’s Trend analysis
XRPUSD expected to see a sideways movement as the price has observed resistance after riding the upper band with Bollinger band expansion and weak selling pressure
Price at the time of publishing: $0.564
XRP’s market cap: $25.94 Billion
Oscillator indicators are mostly neutral. RSI at 70 in the neutral region.
Moving average indicators are indicating an uptrend. Ichimoku Cloud is neutral and Hull MA indicates selling opportunities
Volume indicators observed an increase in value as the price increase followed by a decrease in volume with a decline in price
Price expected to see a sideways movement as the price has observed resistance after riding the upper band with Bollinger band expansion. Most of the Oscillator indicators are neutral. MACD line approaching the signal line from above, histogram size decreasing in the positive region suggesting a bullish bias. RSI at 70, close to overbought in the neutral region. CCI at 110, in the overbought region indicating a downtrend. Another interesting point to notice here is that the volume observed an increase in value as the price increase followed by a decrease in volume with a decline in price indicating weak selling pressure.
----------------------------------------------------------------------------------------
The analysis is based on signals from 28 technical indicators, out of which 17 are moving averages and the remaining 11 are oscillators. These indicator values are calculated using 1 D candles.
Note: Above analysis would hold true if we do not encounter a sudden jump in trade volume.
----------------------------------------------------------------------------------------
If you find the analysis useful, please like and share our ideas with the community!
- Mudrex

XRPUSD to move sideways | Upper band resistance | BB expansionMarket in last 1 week
XRPUSD saw an uptrend after the price started to ride the upper band
Price volatility was very high. The market moved ~22.12%, between $0.3086 and $0.2527
Today’s Trend analysis
XRPUSD expected to see a sideways movement as the price has observed resistance after riding the upper band with Bollinger band expansion
Price at the time of publishing: $0.2921
XRP’s market cap: $13.22 Billion
Oscillator indicators are mostly neutral. RSI at 68 in the neutral region.
Moving average indicators are indicating an uptrend. Ichimoku Cloud is neutral and Hull MA indicates selling opportunities
Volume indicators observed an increase in value as the price increase while decreased with a decline in price
Price expected to see a sideways movement as the price has observed resistance after riding the upper band with Bollinger band expansion. Most of the Oscillator indicators are neutral. MACD line approaching the signal line from above, histogram size decreasing in the positive region suggesting a bullish bias. RSI at 68, above the midline in the neutral region with a pullback from overbought. CCI at 133, in the overbought region indicating a downtrend. Another interesting point to notice here is that the volume observed an increase in value as the price increase while decreased with a decline in price indicating a strenghtened buying pressure.
----------------------------------------------------------------------------------------
The analysis is based on signals from 28 technical indicators, out of which 17 are moving averages and remaining 11 are oscillators. These indicator values are calculated using 1 D candles.
Note: Above analysis would hold true if we do not encounter sudden jump in trade volume .
----------------------------------------------------------------------------------------
If you find the analysis useful, please like and share our ideas with the community!
- Mudrex
