XRP/USD H1 Educational Market Analysis – Support-Based XRP/USD H1 Educational Market Analysis – Support-Based Long Opportunity
🔍 Structure Overview:
• Support Zone: $3.21 – $3.23
This level has acted as a strong liquidity pool and base for past bullish moves. Price has tapped into it, showing signs of potential demand returning.
• Resistance Zone: $3.65 – $3.70
Acts as a key supply zone, where previous bullish attempts failed. Targeting this area after a rebound is technically sound if structure confirms.
⸻
🔄 Price Action Insights (H1):
• Price broke down through EMAs (20/50/100/200), confirming short-term bearish pressure.
• A rejection wick from support hints at possible absorption of selling pressure.
• If price forms a higher low structure above $3.25 and reclaims EMAs, a potential bullish reversal may unfold.
⸻
🧠 Educational Note:
• H1 charts are ideal for intraday strategies, and this structure provides a clear example of:
• Support-resistance dynamics
• The use of EMAs as trend confirmation tools
• Reversal vs. continuation setups
⸻
🎯 Intraday Bullish Scenario:
• If price holds above $3.21 and breaks above the $3.40 (EMA cluster), bulls may push toward the $3.55290 target.
• This level aligns with the mid-range of the resistance zone, offering scalp-to-swing potential.
⸻
🚫 Bearish Risk:
• Failure to hold $3.21 could lead to a deeper correction toward $3.10 or even $3.00.
• Confirmation of bearish continuation would be a lower high rejection from EMAs without reclaiming them.
⸻
📌 Summary:
On the H1 chart, XRP is at a critical support. Watch for a clean bounce and break above EMAs for a move toward $3.55. However, losing $3.21 could attract further downside. Use price action confirmation before entries.
Xrplong

#XRP Update #3 – July 18, 2025#XRP Update #3 – July 18, 2025
XRP has surged roughly 28% in its latest impulsive move. Naturally, we now expect a correction phase. Potential retracement levels are:
Level 1: $3.30
Level 2: $3.20
Level 3: $3.10
Pullbacks to any of these levels should not be alarming — they are typical and healthy corrections.
I plan to go Long if XRP bounces from the first correction zone. However, at the moment, I’m just observing, as the current signals are not strong enough to justify entry.
It’s also important to note that there are heavy whale sell orders between XRP’s current price and the $4.00 zone. Breaking through this resistance will likely require strong buy-side volume from large players. Caution is advised.

XRP - Do you want to slurp?Yeah who doesnt wants to slurp profits? I shall say the move down shall be taken first before the formation of the pattern to work in accordance with the moves! Hope its understood

XRP Inverse Head And Shoulders $2.89 TargetWe've had this sitting here for awhile, but we just confirmed a strong perfect bounce off the neckline signaling another attempt to break through the strong resistance above around $2.50 to get to our $2.89 Target

Is XRP forming a larger inverse H & S fractal pattern?XRP has just punched through the inverse head and shoulders pattern neck line, but I can't help but think this is a smaller part of a larger pattern (marked in white).
Good luck, and always use a stop loss!

XRPUSDT Long by TeamPWRTradesHi all,
XRP Long Idea
Our team has taken small long positions in XRP, we are expecting a bounce to 2.55-2.68 range.
Recommended risk 1-1.5% of portfolio.
Entry 1: 2.2350
Entry 2: 2.26
TP 1: 2.55
TP 2: 2.68
SL: 2.1850
Happy Trading,
TeamPWR

XRPCRYPTOCAP:XRP is at a major turning point at the $2.65 level as we look to push through the 200 EMA. If we get news of the SEC case dropping, Federal Reserves or more positive ETF news we may be on our way towards $3 heading into the weekend.
If we fail this level we may retest the $2.45 support before we head back up.
We are looking more bullish everyday, the time is coming for the switch to be flipped.

2x for xrpusdt or 1/2 ? that's the questionyou can see that xrp has broken the old all time high and did a pullback and it seems that we are waiting for a 150% rally but another scenario is that it may be a fake breakout and it would go back into the wide wide trading range that it has been inside 60% probabilty is in favor of an 150% rally but let's see what would happen

XRP/USDT 1H: Bulls Eye $3.35 After Key Liquidity Sweep !XRP/USDT 1H Chart Analysis
🚀 Follow me on TradingView if you respect our charts 📈Daily new charts!
Current Market Structure:
Bullish trend confirmed after a liquidity sweep at 2.65.
Smart Money Activity: Accumulation phase evident with clear order blocks around 3.12.
Risk Score: 7/10 (favorable setup).
Trade Setup:
Entry Zone: 3.17 - 3.18 (current price).
Targets:
T1: 3.25 (premium zone).
T2: 3.35 (previous high).
Stop Loss: Below 3.11 (recent order block).
Key Observations:
RSI: Bullish divergence forming at 57, supporting upside potential.
Premium Zone: Identified at 3.20 - 3.25.
Market Maker Intent: Targeting liquidity above 3.35.
No bearish divergences present, further supporting bullish bias.
Recommendation:
Long positions favorable within the 3.17 - 3.18 range.
Maintain tight stops below 3.11 to limit downside risk.
Watch for volume confirmation to strengthen confidence in the breakout.
Confidence Level: 8/10 for bullish continuation.
🚀 Follow me on TradingView if you respect our charts 📈Daily new charts!

XRP/USDTThe coin has a globally bullish structure, with local consolidation. After the ATH update, there was no significant pullback. Spot or long from the highlighted zone under suitable conditions
target 1 = 3.21
target 2 = 3.40

False breakout to the downside..It seems we had a false breakout to the downside, and now we've recovered back into the forming bullflag pattern which can still take us right back into a major breakout run to the upside!
It makes it way more bullish because bears getting desperate for profits, only to be rekt once again cos we going UP! 🚀

XRP is holding its own in the equilibrium zone.XRP has been holding its own in the wedge pattern that it is currently trading in. Although it has the potential to form a bearish divergence on the weekly RSI, it appears that XRP is getting ready for another leg to the upside.
Good luck, and always use a stop loss!

Ready for new price discovery!Once again we're seeing the same pattern emerge before another run-up. This one is no different.. apart from the fact it's setting the tone for new price discovery!!
Get excited! 🚀

XRP Big Picture Grinding HIGHER? XRPUSDT Buy Long only for Us! XSeeking Pips likes XRP HIGHER STILL!
Yes price has stalled somewhat but ✅️HIGHER TIMEFRAMES still call for $4 xrp MINIMUM TARGET in our opinion.
As Stated on our shared analysis last week on 15/01/25 🟢SeekingPips🟢 thinks below $5 XRPUSD REMAINS A BARGAIN as a LONG TERM HOLD.👌
Daily Chart BULL FLAG remains in play and SeekingPips continues to see BULLISH REACTIONS on our LOWER timeframe CHARTS and PRICE LEVELS we have identified and shared until now.
🔴 SUBSCRIBE NOW🔴 & Receive Our Latest Chart Analysis...

XRP BIAS / MARKET OUTLOOKJust my personal perspective, never take anything I say as financial advice.

XRP Long to 6.66Observing the fractal pattern on XRP, we see a potential setup similar to AVAX's previous price action.
The price seems ready to expand soon and is likely to dip into the orange demand zone, creating a buying opportunity. The demand zone is crucial, much like it was on AVAX's chart before its massive move upward.
Entry Zone : Look for a dip into the orange demand zone around $2.21 - $2.41.
Target: $6.66 – A potential long-term target based on the fractal comparison with AVAX.
Key points:
The price structure shows a similar pattern of consolidation before a major price breakout.
Timing will be critical as we expect the price to dip into the demand zone before moving up.
Stay vigilant for entry confirmation within the demand zone.
If this fractal plays out as expected, XRP could see significant upside potential, following a path similar to AVAX's recent price action.

Xrp usdt"🌟 Welcome to Golden Candle! 🌟
We're a team of 📈 passionate traders 📉 who love sharing our 🔍 technical analysis insights 🔎 with the TradingView community. 🌎
Our goal is to provide 💡 valuable perspectives 💡 on market trends and patterns, but 🚫 please note that our analyses are not intended as buy or sell recommendations. 🚫
Instead, they reflect our own 💭 personal attitudes and thoughts. 💭
Follow along and 📚 learn 📚 from our analyses! 📊💡"

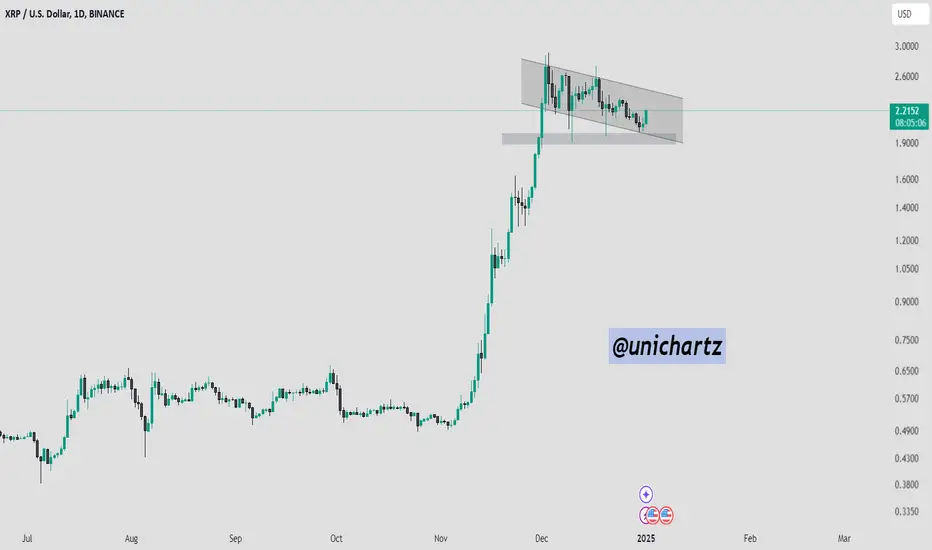
XRP Price Prediction: Breakout Above $2.25 or Further Downside?The XRP/USDT chart is displaying a descending channel following its impressive rally. The price action is consolidating, respecting both the upper and lower boundaries of the channel.
The support zone around $1.89 to $1.98, as previously highlighted, remains intact.
DYOR, NFA
XRP about to hit all Time High ... butIn this video, I talk about my expectations for the next XRP movements. The price will likely take out liquidity points, go into an accumulation phase in the short term, and then trade towards the all-time high. I also discuss the relationship between BTC and XRP.

XRP found support at the 2020 highs of $0.8282Key Support Levels: $1.00, $0.95, $0.8282.
Key Resistance Levels: $1.05, $1.10, $1.25.
XRP found support at the 2020 highs of $0.8282 over the weekend and rebounded higher to break above $1.00. It is now struggling to close a daily candle above $1.05 (bearish .382 Fib), but the bulls are battling to remain above $1.00.
The resistance at $1.05 is starting to form an ascending triangle with the roof at $1.05. A closing candle above $1.05 (and $1.10) could set the stage for a bullish leg higher toward $1.30 (50-day MA) for XRP.
XRP-USD Short Term Price Prediction
Looking ahead, if the bulls break $1.05, the first resistance lies at $1.10 (20-day MA). This is followed by $1.25 (Feb 2018 highs), $1.30 (bearish .618 Fib & 50-day MA), and $1.52 (bearish .786 Fib).
On the other side, the first support lies at $1. This is followed by $0.95 (100-day MA), $0.8282 (Feb 2020 highs), and $0.75 (.786 Fib).
The RSI is now directly on the midline, indicating indecision within the market. For a breakout of the current ascending triangle, the RSI must break above 50 to indicate bullish momentum is returning to the market.
XRP/BTC – Bulls Battle With 20-day MA
Key Support Levels: 2660 SAT, 2400 SAT, 2260 SAT.
Key Resistance Levels: 2800 SAT, 3000 SAT, 3360 SAT.
Against BTC, XRP is now in a battle with the 20-day MA at around 2800 SAT. The coin found support at 2400 SAT over the weekend and started to rebound higher.
On Monday, XRP managed to climb above resistance at 2600 SAT (50-day MA & bearish .382 Fib), and it continued higher to 2800 SAT. Since then, it has struggled to close a daily candle above 2800 SAT.
XRP-BTC Short Term Price Prediction
Looking ahead, if the bulls break 2800 SAT, the first resistance lies at 3000 SAT (bearish .618 Fib). This is followed by 3360 SAT (Feb 2020 high), 3783 SAT (Oct 2019 highs), and 4000 SAT.
On the other side, the first support lies at 2660 SAT (50-day MA). This is followed by 2400 SAT, 2260 SAT (.786 Fib), and 2000 SAT.
The RSI is showing weak bullish momentum. To pass 2800 SAT, the RSI must rise to indicate the bullish momentum is starting to gain solid control.

XRPUSDWe will see a boost towards the uptrend. we have retest the level. be patience and you will be happy with the result. my upside target is 5$ by the end of the January or maybe more then 8 to 10$.

XRP - Journey to $15 or $5 first?Whatever I say may sound dumb, but even $15 is achievable but on a contrast tomorrow? friday? next week? Next year? approx by 17th September 2024, How? You will see it, Squeezed like lemons and followed as said, It follows me alot haha as of now aiming for 3.25

Xrp chartXrp chart. Key levels.
Each level can reject to a new low. For the bullish scenario the levels will become support.
