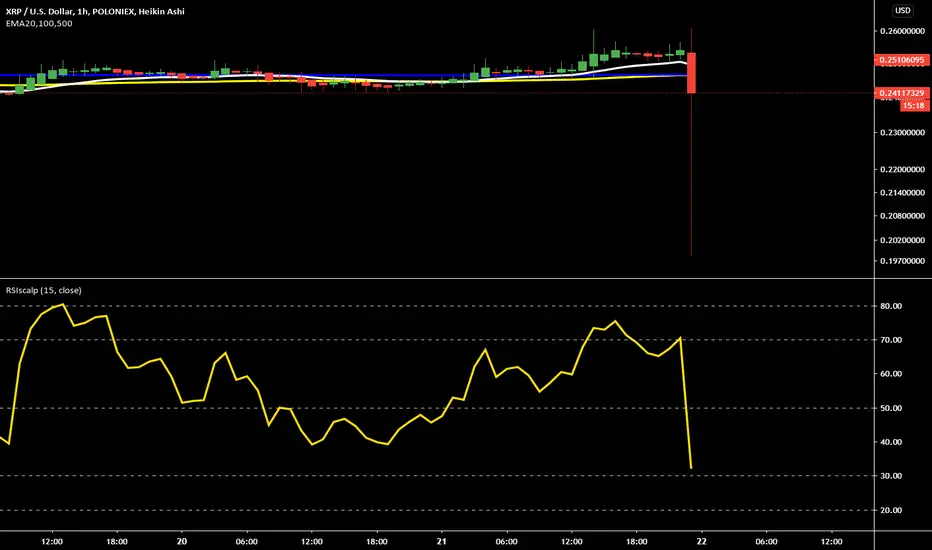
RSI manipulationwho is the mysterious people that sold XRP to 20 cents in one minute, anyways it bottomed the 1 hour but im concerned for the chart on 1D because of this
Xrplong
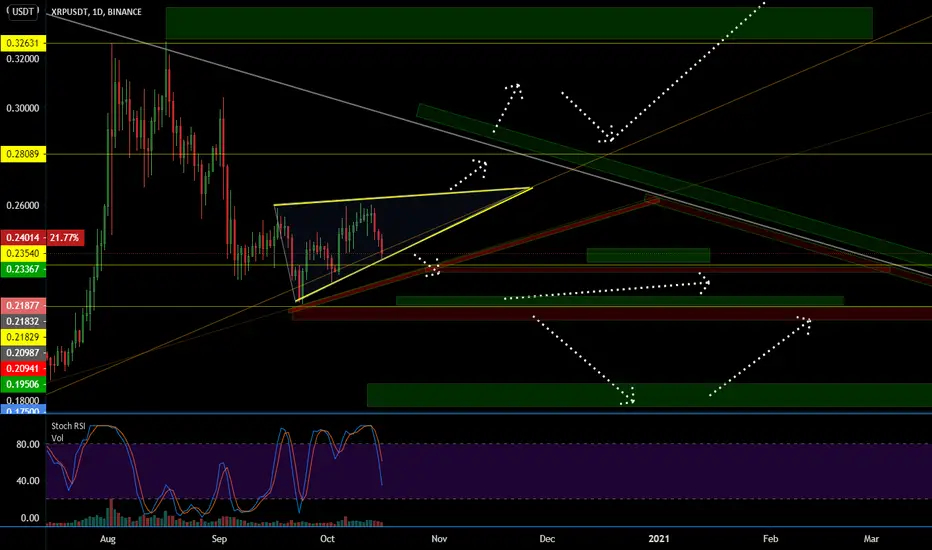
XRP/USDT 1 hour chart Ascending Triangle
Looks to be throwing a ascending triangle that was entered from the above the triangle which signals a drop after a slight pump in to a descending scallop then down to bounce off the triangle up then fall past the apex of the triangle. The pump from the triangle will not exceed the support levels at the bottom of the HCR(Horizontal Consolidation Region) that the PA fell from to create the current pattern.
Starting at the current spot we should see a Impulse Grand Super Cycle ABC wave followed By a Impulse Minute 5 wave, Corrective Minute 5 wave, Corrective Minute ABC wave With an overall higher time frame pattern starting the downtrend with a Minor Corrective Minute ABC wave.
If you like my the content I throw up hit me with a like and follow for more ideas.


$XRP Q4 Technical Analysis | WATCH THESE LEVELSSTRONG Technical Analysis on XRP/USDT $xrp
Strong Levels To Watch:
Support Level:
$.236, $.263, $.282, $.327, $.349, $.38, $.479
Resistance Level:
$.261, $.28,$.304, $.326, $.348, $3799
Recent XRP News:
Ripple donates $10M to Mercy Corps during annual Swell conference - During the annual Swell conference, Ripple announced a contribution of $10 million to Mercy Corps to help it use digital assets in its work on developing financial inclusion in emerging markets.
Mercy Corps is a non-governmental, humanitarian aid organization that aims to create economic opportunities in countries where the financial system isn’t operating properly. The organization claims to have assisted over 220 million people survive various humanitarian conflicts.
Pro Super Smash Bros player to receive a salary in XRP - More gamers around the world are moving into crypto.
Kengo “Ken” Suzuki, a professional player of crossover action fighting game Super Smash Bros. Ultimate, or SSBU, has signed a contract with SBI e-Sports, the gaming arm of Japanese financial giant SBI Holdings. Ken is also considered to be the world’s best Sonic player.
Trust The Chart | DotcomJack
XRP/USD: AnalysisWhats up guys! Looking at xrp/usd i'm expecting price to rise, right now price is at the 0% on the fib and i'm expecting price to rise to the 61%. Price is at a key zone and has tested the key zone already, if price doesn't move down and close into the key one I will not consider price to fall at all at the moment. I have a zone marked of in between the 61% and the 78% on the fib which price has pull away from multiple times in the past, which means the zone is highly respected. Price was in an ascending channel i plotted off the 4hr and as of now price is under the support of the channel which means for me that price will at the very least test the suport line IF there was bearish movement before falling immediately.

XRP/BTCAlright Ripple... I think its time to show BTC a little muscle here... I’d love to see a jump to .28 in the short term, but why stop there? Let’s take this thing back up to ATH’s! Good luck!


XRP: Showing Signs of Strength! - Buying Opportunity SpottedHere we talk strictly from a Fibonacci sequence and trend line support perspective in terms of technical analysis. Although we don't advise looking into alts due to the bumpy ride of Bitcoin, we love larger picture time frames to get the overall view of the market.
Risk reward ratio (RRR), support line higher lows, and our strong bounce off of the 618 immediate sequence gives us an opportunity to open a long here.
If the market shows its strength in the coming weeks, we may see XRP show signs of revitalization in the market, bringing this 'dinosaur' alt back to life.
We can open a position based on the red-green boxes, with our stop loss in mind which is wider than expected. The reward is large here, especially if leveraged in slowly.
Trade Safe!
X Force


XRP to DJI- How to bottom a coinInteresting we traded inverse of DJI for a while there but bottomed for cycle with their march bottom

XRPUSD Ripple | SWING - 10 Oct. 2020Hello my friend | Welcome Back.
Please support this idea with LIKE if you find it useful.
***
It may retreat from the resistance to the downside, and it is possible that it touches the support line and then ascends again to the upside because it is basically a positive ascending channel as long as it has not been broken yet.
***
Here is the full analysis for this pair, let me know in the comment section below if you have any questions, the entry will be taken only if all rules of the strategies will be satisfied. I suggest you keep this pair on your watchlist and see if the rules of your strategy are satisfied.
Remember this analysis is not 100% accurate No single analysis is To make a decision follow your own thoughts.
***
The information given is not a Financial Advice.


XRP/BTCHolding the support after the trend break is normally a good recipe for a run. I would expect a move like this to occur if that support holds. Good luck y’all!


XRP best buy 2006-2013 FractalWas doing some research on corrections and found this similarity in Best Buy 2006-2013 correction to XRP current correction.
Double TD9 Buy on monthly candles
Only difference was the perceived "strength" which could be an issue with how its weighted


XRP in Ascending Triangle.Hey! I am back with another Crypto idea this time looking at XRP.
The price of XRP is currently in ascending triangle which is a bullish pattern.
Price needs to break $0.2460, which is our current resistance, by a full 4H in order to break to $0.2520 - $0.2550 Area.
Ideal buy is on the 4H 50EMA, that is acting as a support line.
I am buying in the resistance area we are in, $0.2432 - $0.2460.
My stop loss will be hit, when the uptrend line of this ascending triangle gets broken.
Take profit area is $0.252 - $0.255 (Around 5%)
Let me know what you think about XRP!
Tibor

XRP/BTC: Bullish Breakout Technical AnalysisIf you like this analysis, please make sure to like the post, and follow for more quality content!
I would also appreciate it if you could leave a comment below with some original insight.
In this post, we'll be taking a technical approach in analyzing the notorious cryptocurrency: XRP
Analysis
- XRP has been consolidating within a bullish descending wedge on the daily chart
- It broke out of the wedge formation, and is undergoing a phase of pullback
- Prices are currently trading below the 20 Simple Moving Average (SMA)
- We are also seeing resistance near the 0.236 Fibonacci retracement resistance, where it converges with the trend line resistance
- However, the Relative Strength Index (RSI) shows signs of bullishness, as it has broken out of the long term descending trend line resistance
- What's worth noting for XRP's daily chart is the Moving Average Convergence Divergence (MACD)
- The price history demonstrates that there has been big breakouts after the formation of a golden cross of the MACD
- As such, we could anticipate a bullish breakout to take place once again
- On the shorter time frame, the 4 hour chart demonstrates a bull flag pattern, with prices looking to break out imminently
Don't predict the market. The future is all about preparation, not prediction. Take it by levels, and play by probabilities.
-Michael Wang-

XRP/USD About to see a 5% leg up.XRPUSD - Short term
We expect the price of XRP to reach $0.2550 in short term, possibly intraday term, which is above 5% move up.
We are looking to buy in the current resistance area from $0.2420 to $0.2450 or buy the breakout.
RSI is trending higher.
MACD has turned positive.
EMA's 50 and 20 gave a buy signal.
We are bullish on Bitcoin.
Resistance : 0.24600/ 0.2500 / 0.2550
Support : 0.2450 / 0.2420 / 0.2400
Signal Centre


XRP has potential to see a 30% move up! XRP has been idle in the range from $0.23 to $0.25 for a while, what we need ideally is to break $0.25 level with a full daily candle.
The reason I like to analyse XRP is because, when it goes up after sideways "action" it rises pretty steeply!
Currently the XRP chart looks good to publish as today may be the first day of MACD daily buying wave (still not closed) and the price has peeked almost to $0.26!
How to trade this?
You can either buy XRP, sit on it and Sell it below $0.32 or make an alert on the chart and buy the breakout !
If the uptrend line breaks, that would also mean 200MA breaks would make this setup invalid , otherwise feel free to get into XRP!
Each like and follow is very much aprreciated.
Good luck
Tibor
