XRP AnalysisXRP Analysis
XRP is currently trading at 2.38, which represents a significant support level that has historically demonstrated its strength in preventing the price from breaking lower. On the occasion when the price did briefly penetrate this level, it was quickly rejected, and the candle closed above the support line. This rejection and subsequent close above the level further reinforces its importance and highlights the respect for this support by price action.
With the price now trading above this key level, it is reasonable to anticipate a potential bullish movement, suggesting a possible upward trend could emerge.
What are your thoughts on this scenario? As always, it is crucial to conduct thorough analysis and consider risk management strategies before taking any trading positions.
Xrpsignal

Trumps Tariff War and Crypto's Fight🔥 Hey! Hope everyone's doing well today, it's been a hectic last couple days as ever, especially with these tariff's Trumps been throwing out which has pushed the crypto market down even puling Bitcoin down to hit a 3-week low which saw the cryptocurrency drop below it's historic $100,000 mark.
🔥 Over the weekend Trump imposed a couple tariffs on Mexico and many Canadian imports of up to 25% and 10% on goods from China which will go into effect Tuesday.
🔥 With that news coming out over the weekend it's understandable that crypto crashed, with cryptocurrencies being the only thing that runs 24/7 we can see how traders effectively took to selling cryptocurrencies off the news and crypto ended up being the proxy for the news and ultimately taking the hit. Here's a link for reference:
www.reuters.com
🔥 Thankfully we can see how after the plunge crypto's recovered pretty well so that's been great to see that but gives us some good reference points at the very least, can see how XRP plunged to that 1.77 point before buyers snatched up that absolute bargain so least we can identify a solid support above $1.70 should we ever fall again or get another selloff.
🔥 And now we can see how XRP is trying to break back up into that $3 territory though we're facing that resistance at $2.8 understandably so definitely keep an eye out since we'll have to watch out for a possible breakout or if we'll retrace and converge with that 200 EMA again.
🔥 I've got to go but hope this idea helps some, wanted to get a quick post out while I had the chance before I leave for work, so thanks for tuning in and the support as always, really appreciate it and wishing all the best till next!
~ Rock '

XRP, How Low Can You Go?XRP is currently experiencing a downward trend across both 4-hour and 1-hour timeframes. The key level to watch is $3.00, which needs to establish as support to reverse the current bearish trend.
XRP is currently in a downtrend in both 4-hour and 1-hour timeframes.
To break the trend, price needs to find support at $3.00.
A 1-hour liquidity zone exists between $2.948 and $2.9244. Price should fill this zone. Price can get there if it's rejected at $3.00.
There is a 4-hour Fair Value Gap ($2.85–$2.83) that should be taken into consideration.
If the 4HR FVG is hit, it needs to retrace to $2.86ish and hold with support. If it does not find support in the FVG, price could be headed to $2.78ish.
If support is not found there at $2.78, a 1-hour Liquidity Zone now plays a factor. Price could visit mid-to-low $2.60s.
If it does hit $2.60s, I believe it will find support and start to rebound back to $3.00.
Just my analysis. What do you think is going to happen? Would love to get other perspectives and feed back!😊😊

XRP’s Next Move: Can It Reach $6.50?Good morning, trading family!
XRP is at a key point right now. If it drops below $2.84, we could see it fall to the $2.70–$2.60 range before bouncing back. On the flip side, if it pushes up from $3.30, we might see it climb to $3.80—and from there, $6.50 could be in sight.
It’s going to be an exciting move either way, so stay sharp!
If this resonates, feel free to comment, like, or share. Let’s trade smarter and live better!
Kris/Mindbloome Exchange
Trade What You See

XRP Ideaxrp is forming an ascending channel on H4 AND H8 timeframe so we're waiting or a new touch on the red trendline
here w have a valid ascending trendline that got broken so we enter a short (sell) trade
Follow us or more ideas and updates

JANUARY 20TH! XRP UPDATE AND TECHNICAL! 🔥 Hey hey, hope everyone's doing well as always. Here we are now at the 20th with Gensler out and Trump now in office. I'll keep this idea brief since I have to leave soon for work so thanks for tuning in!
🔥 In yesterday's idea we noted that today would likely be a green and positive day which to say in the least it has been but we'll take a quick look at the technical:
🔥 In our 30 minute chart we can see XRP did end up breaking out of the descending channel we highlighted in yesterday's idea so that's been great to see and we just barely pulled up to $3.36 before that reversal started once we hit the resistance.
🔥 I decided to add a Fibonacci chart to see if that could help us identify any levels of interest which has worked out! We can see what levels do what now and use those for future reference in the next few hours, days.
🔥 Something of note I wanted to say is that in Trumps America First Priorities speech there was no mention of crypto nor Bitcoin. Investors took that with a heavy heart and we can see things how things sort of revers as the day's gone on understandably. Many we're anticipating trump to make an announcement or executive order on crypto but with that not looking to be the case we're getting this sorta buy the hype sell the news event.
🔥 Doesn't mean we're in a bad position but that's simply what looks to be driving today's market action. I've got to get ready for work but wanted to get those highlights and points of interest out for you guys, keep an eye on those levels and that 200 EMA.
🔥 Thanks for the continued support and as always, keep posted for more till next.
~ Rock '

GENSLER'S EXIT AND TRUMPS INAGURATION! XRP IMPACT🔥 Hey hey, hope everyone's doing well today. Sure most of you are busy so I'll keep this short and concise. Thanks for tuning in as always.
🔥 With the exit of the SEC's Gary Gensler tomorrow as well as trumps inauguration in which many are anticipating, expecting trump to execute a series of executive orders, primarily in regards to the digital asset industry as he's voiced his support of cryptocurrencies and America holding a dominant position in the field.
🔥 Alongside trump's Inauguration we have Gary Gensler's exit which the crypto and digital asset industry is celebrating and no doubt that will be met with positive sentiment tomorrow alongside trump's inauguration. In lieu of Gensler's exit the SEC has also seen a number of ETF submissions highlighting what many are looking to as a positive road ahead for the digital asset space as many expect the SEC will take a kinder stance to the digital asset space now with Trump as soon to be president and Gary Gensler out of office. Referenced below is an article highlighting the recent ETF submission for any interested.
cointelegraph.com
So definitely expecting prices to be volatile tomorrow, anything can happen but as far as I can see, things look positive, it's been years in the work, but things are working well for Ripple and it's holders. We've persevered and the wait will be well worth it.
🔥 And as for a quick technical look, we're still within this descending channel so I'll be keeping an eye on that to see whether or not we can get a breakout or if we'll continue the trend down though with how tomorrow is looking, chances are we'll have a green day to say in the least. I've attached a 30 minute chart below for reference as well:
🔥 Have to go but as I said, a short and concise idea. Expect tomorrow to be volatile with news and positive sentiment likely driving the market so keep note of that and keep posted as always, let's make the best of it and thanks for tuning in, till next!
~ Rock '

XRP SOARS AND THE XRP AVATAR RETURNS!🥂 Hey hey! Hope the new year has been great to everyone! It feels amazing to be back after being encased in ice for 100 years but I'm back now when the world needs me most, and for good! Short to say, the XRP Avatar is back.
🥂 Things have been nothing short of stellar for XRP the last few weeks much like a snowball headed down a hill, growing evermore as it rolls on down with nothing but positive and amazing news. Today's main driver has trumps words as he's expressed interest in the idea of creating an American strategic reserve for cryptocurrencies which could potentially include the likes of XRP, Solana and the USDC stable coin which is managed by CIRCLE. (Not to be confused with Ethereum's USDT*) I've attached a link to an article below for those that would like to.
www.coindesk.com
🥂 So that's basically been the main driver behind this rally today and why we're seeing XRP hit yearly high's as it flew over that $3 point just managing to hit $3.40 before we hit that resistance understandably.
🥂 And for technical we'll take a quick look at our minute chart where we'll be able to see that resistance:
🥂 Pretty clear that bulls are taking the lead as whales continue to save us and keep XRP from losing control or converging with that 200 EMA. We can already see how we almost lost the ball at 9:30am when we had that selloff but bulls managed to overcome sellers with crazy buying power preventing us from losing the 200 EMA. So that's been positive and we'll be looking now to that $3.38 horizontal level to watch for another possible breakout. Either way the news is running the trade today and it's nothing but positive so far.
🥂 As for support here's what I've got and what I'm watching as we lock in that support at $3.20 where we see price broke out and found support in two instances so we'll put that down as the support should we reverse or retrace. I'll set an alert for that to keep an eye.
🥂 Before I end this, just want to give thanks again. Really appreciate you guys joining me today and remember, the markets are going to be crazy the next couple days, especially as Trump gets inagurated and the market watches to see what moves he makes his first day in office with many hoping for him to take legislative action in regards to digital assets. I'll be sure to keep you guys updated so be sure to keep tuned and posted and till then, wishing all the best!
Best regards,
~ Rock '

XRP BULLISH - Retesting Support Before Moving Up On Weekly TFXRP recently ripped through multi-year resistance and is re-testing a major support level at the $2.00 level. This is perfectly normal and should be expected.
It looks like support is holding and XRP is going to bounce upwards. In this case, expect a move towards it's all-time high near the $3.30 area.
TP at $3.30 would be approximately a 50% move upwards from here!

Bullish XRP - XRP/BTC Chart - Weekly Time FrameXRP/BTC has broken out vs Bitcoin on the Weekly chart. This seems to be true no matter how you draw the lines too. The red line in the image in particular had several attempts made before finally breaking. So it was a strong resistance level. XRP broke out and re-tested the level perfectly. A bullish move upwards for XRP should continue in the coming weeks or months.
What this means is that XRP will be a better investment than BTC. XRP will make up some ground compared to BTC in terms of market cap.
Note: This agrees with my monthly analysis for XRP/BTC also. See link to related publication. Both are on high time frame charts which makes them more reliable, but they may take a long time to fulfill.

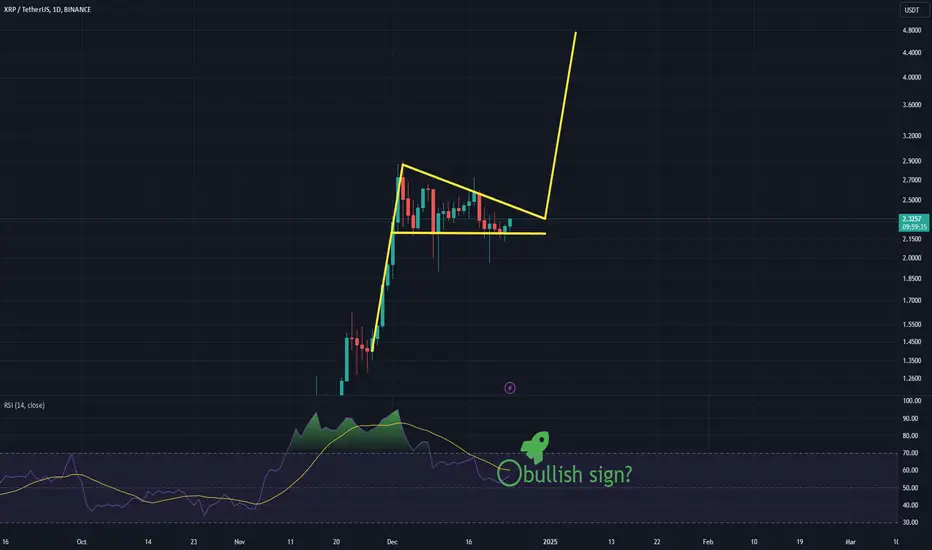
XRP Mid Term analysisRipple has formed a Bullish pennant. which means there should be a bullish movement pretty soon.
We can get a bullish sign from RSI as well which is pretty Good for maintaining the bullish Idea!
but no break out means no confirmation! we shall wait and see.
XRP/USD Analysis: From Explosive Rally to New Bullish SetupAfter breaking above the critical $0.65 resistance, XRP/USD surged dramatically, reaching a high near $3, close to its 2017 all-time high (ATH). As expected, a correction followed, but the bulls stepped in decisively at the $2 zone, halting further declines and establishing a strong support level.
Currently, XRP/USD is trading within a bullish flag pattern and appears to have broken above the pattern's resistance.
If this breakout holds, it could signal the beginning of a new leg higher, with a measured target around $3.70.
My preferred strategy in this scenario is buying dips, with a clear invalidation point if the price falls and stabilizes below the $2 support level.

Ripple Xrp usdt Daily analysis
Time frame 4 hours
Risk rewards ratio >2
I'm waiting for a good pump
Look at the chart. We can see 4 triangles
Price move up and down in the triangle and then it breok upper side and pumped.
Now this triangle is shaped and I hear good news about the Ripple. So!
What will happen 🤔

XRP Analysis==>>Correction Signs!!!XRP ( BINANCE:XRPUSDT ) is moving in the Resistance zone($2.63-$2.50) .
In this post, I want to show you some signs that XRP may still need to be corrected in a one-hour time frame :
1 -Regarding Classical Technical Analysis , XRP seems to have succeeded in forming the Rising Wedge Pattern .
2 -The formation of the Evening Star Candlestick Pattern in the Resistance zone can signify the reverse of XRP .
3 -The formation of the Bearish Gartley Harmonic Pattern can also be another sign of the decline of XRP .
4 -According to Elliott wave theory , XRP seems to be completing the main wave 4 .
I expect XRP to break the lower line of the Rising Wedge Pattern , which should drop to at least $2.38 . If the Support line is broken, the next target will be the Support zone($2.25-$2.17) .
⚠️Note: If XRP manages to break the Resistance zone($2.63-$2.50), we can expect an XRP pump.⚠️
XRP Analyze (XRPUSDT), 1-hour time frame⏰.
🔔Be sure to follow the updated ideas.🔔
Do not forget to put Stop loss for your positions (For every position you want to open).
Please follow your strategy and updates; this is just my Idea, and I will gladly see your ideas in this post.
Please do not forget the ✅' like '✅ button 🙏😊 & Share it with your friends; thanks, and Trade safe.

Bullish XRP - XRP/BTC Chart - 1 Month Time FrameThere are 2 chart patterns coinciding on the XRP/BTC chart for the monthly time frame.
Pattern #1:
Falling Wedge pattern with a target of 0.00010612
Target = 398% Increase
Pattern #2:
Double Bottom pattern with target of 0.00007199
Target = 269% Increase
Note: This is very reliable trade since it's the monthly TF, but it could also take very long to play out. Expect XRP to catch up to Bitcoin in the coming weeks or months!

XRP Roadmap!!!(Short-term)I hope you had a good weekend .
According to the news about XRP , I decided to share an analysis of it with you today.
So stay with me.
Ripple is planning to launch RLUSD Stablecoin on December 4th , which increased the price of the XRP( BINANCE:XRPUSDT ) token.
" Ripple is set to release RLUSD, a stablecoin backed by NYDFS approval. This strategic move enhances Ripple's foothold in regulated digital finance and strengthens its position in the stablecoin market, challenging giants like USDC.
RLUSD will provide a stable pairing for XRP amid Ripple’s ongoing legal battles.
Partners like Bitstamp, Moonpay, and Uphold are on board, ensuring compliance with top-tier transparency and security standards. "
Of course, we should be careful with this proverb: " Buy the Rumor, Sell the News ", of course, it depends on the cryptocurrency market conditions on December 4th , if the crypto market is bullish on December 4th , we can expect the continuation of the upward trend of XRP.
Now, let's go to the Technical Analysis of XRP .
XRP is currently moving in a Heavy Resistance zone($2.00-$1.50) and has so far failed to make a new All-Time High(ATH) (on the Binance exchange ).
Also, from the point of view of Classic Technical Analysis , it seems that XRP is moving inside an Ascending Triangle .
According to Elliott wave theory , XRP is completing microwave 4 of microwave 5 of main wave 3 .
I expect XRP to drop( -7% ) to at least the Potential Reversal Zone(PRZ) , Uptrend line , and 100_SMA(4H-TF) after breaking the lower line of the ascending triangle pattern .
🙏Please respect each other's ideas and express them politely if you agree or disagree.🙏
⚠️Note: If XRP can break the Heavy Resistance zone($2.00-$1.50), we can expect more XRP pump.⚠️
⚠️Note: If XRP goes below PRZ and Uptrend line, there is a higher possibility of a decrease.⚠️
⚠️Note: If XRP goes below $1.50, we can expect more dumps.⚠️
XRP Analyze (XRPUSDT), 1-hour time frame⏰.
🔔Be sure to follow the updated ideas.🔔
Do not forget to put Stop loss for your positions (For every position you want to open).
Please follow your strategy and updates; this is just my Idea, and I will gladly see your ideas in this post.
Please do not forget the ✅' like '✅ button 🙏😊 & Share it with your friends; thanks, and Trade safe.

Ripple ( xrp)Xrp usdt Daily analysis
Time frame hourly
Risk rewards ratio >3
Target 2.5 $
Ripple is on the verge of launching its own regulated stablecoin, RLUSD, and is expected to receive approval from the New York Department of Financial Services (NYDFS) soon. According to Fox Business, the company plans to launch the product on December 4. The move would be a significant step in Ripple’s expansion into New York’s highly regulated digital finance space. Ripple’s entry into the stablecoin market puts it in direct competition with established US issuers such as Circle, Paxos, and Gemini. If finalized, the approval would allow Ripple to offer RLUSD as a stable, regulated alternative to XRP. Ripple’s price has surged 25% in the past 48 hours to hit a new record high of $1.9.

Could XRP Hit $500 Monthly Say Yes 🚀 Could XRP Hit $500? Here’s why it’s possible: Beyond the chart telling us that if it exactly mimics its last similar breakout that it will achieve over 500 consider the following
🌍 Global Adoption: XRP could become the backbone of cross-border payments, replacing trillions locked in nostro/vostro accounts.
💸 Utility: Fast, cost-effective, and scalable, XRP is designed for massive transaction volumes.
🔥 Scarcity: Every transaction burns XRP, reducing supply as adoption grows.
✅ Regulation: Legal clarity will open the floodgates for institutional adoption.
📈 CBDC Integration: Ripple’s work with central banks positions XRP as the bridge for global currencies.
📈 Stablecoin Integration: Ripple’s RLUSD stablecoin enhances XRP’s ecosystem, facilitating seamless transactions and boosting demand.
A $500 XRP isn’t just hype it’s the future of global finance. Many do not understand this asset #XRP #Crypto #Ripple #Finance

XRP LONG AFTER STOPRUNEntry Reasoning: The red zone indicates a "stop hunt" area where liquidity was likely collected after breaking below recent lows. This manipulation phase suggests a reversal and a potential rally as buyers reclaim positions.
Targets:
First Target at around $0.6600 - aligns with a previous structural resistance level.
Final Target at approximately $0.7400 - near a significant high, likely to attract profit-taking and potential resistance.

XRP AND WHERE WE STAND 🔥 Hope everyone's been well! I've mainly been busy with work so haven't had the chance to post till now but again hope everyone has been alright and well! I'll be sure to keep this quick and concise.
🔥 Following up from our last idea we can see the turnaround from our Death cross with us having regained that 200 EMA. Here's a chart picture for reference from a couple days ago I took:
🔥 I highlighted those peaks to watch out for a breakout and that brings us now to today's chart:
🔥 I've added this blue dotted line to signify our resistance, if we get any breakouts or bullish runs watch that blue line for what'll be resistance no doubt, that being said if we can break it again I can see us breaking out of the 0.60 cent range soon enough with how things have been.
🔥 With the Fed Rate's Cut of 0.5 percentage points that's no doubt raised sentiments as of lately and the market's seemed to love it, especially crypto with Bitcoin leading the pack from it's low of roughly $54,000 in September to $64,000 signifying this bullish sentiment.
🔥 That being said the 200 EMA's are playing a huge role in things for technical traders so I'd keep an eye on that but we've got something else to note:
🔥 When we look at the big picture for the last month or two we see that we're in this sort of middle point, we've seen 0.45 to 0.66 cents in a relatively short period and we already see how dramatic the market can be, so do keep that in mind, whether or not we lose or keep that 200 EMA can help determine whether or not we can get a possible breakout or if we'll fail to sustain that pressure and retrace, reverse course.
🔥 I've got to run but wanted to put something out while I had the chance, overall even if we fall and retrace, things look bullish especially with XRPL development the future looks bright for XRP regardless of what the charts do, that's the biggest picture note I've got.
🔥 Thanks for tune in as always and wishing well till next! Have a great day and keep up all that you do!
~ Rock '

XRP DEATH CROSS AND WHAT TO WATCH FOR 🔥 Hey hey, sorry it's been a couple days since I've been able to post, been working everyday so I haven't had any time but I do have a bit of time before work today so figured I'd pump out an idea for you guys here, and as always, thanks for tuning in!
🔥 In my last idea I brought up that death cross, it was looking like we we're about to have a death cross form and well, that's exactly what happened. Here's a quick chart from the other day in which we saw our chart already fighting to regain that 200 EMA on the hourly but unfortunately bulls weren't able to get that done and bears took over.
🔥 Gonna keep this idea short and simple since we already know we're in a death cross. We already knew that was likely going to happen once we lost our 200 EMA so now what we'll be looking to and watching out for is price action above 0.514. These horizontal levels are pretty prevalent and no doubt traders are acting off what we do here and here's a 15 minute chart:
🔥 Off the 15 minute chart alone we can see how we're slowly making our way back up and looking to regain that 200 EMA soon enough, that being said we'll likely regain the 200 EMA soon on the 15 minute timeframe but we'll need to regain it on the 30 minute and hourly to get a solid bullish confirmation before traders will throw money at XRP again so till that happens expect waters to be choppy.
🔥 So watch those horizontal levels, when we're below a level it'll act as resistance and when above any level it'll act as a support so watch for that as well as this new annotated descending channel which is highlighted in the blue lines to show off this descending channel that's formed since we lost our 200 EMA. That's helped bears push price action down so another bullish confirmation will be when we break out of this channel so bear that in mind.
🔥 I have to go but I wanted to give you guys a few things to look at for reference while I'm out, anyway thanks for coming by as always and thanks for tuning in, wishing all the best till next!
~ Rock '

XRP Death Cross?⚡ Hey hey, hope everyone's doing well, short and quick idea here for you guys, we'll look at what could possibly be a death cross forming on XRP's chart. And as usual here's a quick reference to our previous idea, chart.
⚡ Off that we can see that we we're at that pivot point and we did make note to watch for a breakout or fall, wild to see what's happened since then, we did indeed get the breakout we were looking for before hitting that next resistance at our horizontal level above which is fair enough, we know those levels are important to the market bears ended up winning for the day knocking bulls back down but that's only after the fact that a higher high was established.
⚡ So it's great seeing that but here's the kicker, on our 45 minute chart as shown below, we could possibly be entering a death cross soon, check it out.
⚡ We've already seen what happened when we got that Golden cross at the beginning of the chart on the 19th which basically kickstarted this rally and we've been able to steer clear of the 200 EMA, till now that is. We're just barely skimming it but if we end up converging and fall below it then expect some bearish price action to keep it simple.
⚡ And on the 15 minute chart above we can already see the effect by which we've reversed and lost t hat 200 EMA so it'll be a matter of whether we can avoid losing the 200 EMA on the 45 and hourly charts, if we lose it on the hour then definitely expect some retracement is all. Hopefully not but if it happens it happens, it's just the market's ups and downs.
⚡ Have to get ready for work but thanks for coming by, appreciate the words and support as always, have a great day.
~ Rock '

IMPORTANT QUICK XRP UPDATE!💥 Hey hey, hope all is well, we're kind of in the moment with things here so gonna keep this idea real short and simple. Thanks for coming by and for reference I'll put a link, chart below for our previous idea as reference:
💥 In our previous idea we we're watching that dotted support above the 0.58 cent line as well as our 20, 50 EMA's to see if they'd converge and shocking as it is they've managed to avoid it on the hourly, that being said the 15 minute is a bit different but we'll look down below for that:
💥 Quick and basic 15 minute chart here for you guys, we see there's been a couple times where our 15, 20 EMA's have flipped but what matters here is that 200 EMA. Regardless of our 20/50 EMA's we've managed to keep above that 200 EMA overall and bulls have taken to that with this big push back up above 0.61 to where we'll now have this next pivot, fight no doubt.
💥 Definitely set an alert for 0.615 if we break that and get a possible breakout, it's definitely a possibility though I do want to caution the fact that we're pulling away a bit from our 200 EMA and that's gonna make it easier for our 20,50 EMA's to converge at some point so keep an eye on those, we're already seen what happens when we overextend, take a look at the 20th for example, we see that the EMA's we're able to flip and we got that big drop from 0.61 to 0.59 so be mindful.
💥 I have to go, busy as usual but thanks for taking the time to read through my quick update, wishing the best till next and make sure to keep tuned, thanks and have a great day!
~ Rock '
