Ripple XRP 11-years Super Cycle Is Coming to End!Hello, Skyrexians!
Couple of days ago BITSTAMP:XRPUSD has awaken after 4 years of consolidation. This growth can cause euphoria for XRP holders. Is it pump real or price will go down as usual? Today we will try to give answer in our global forecast.
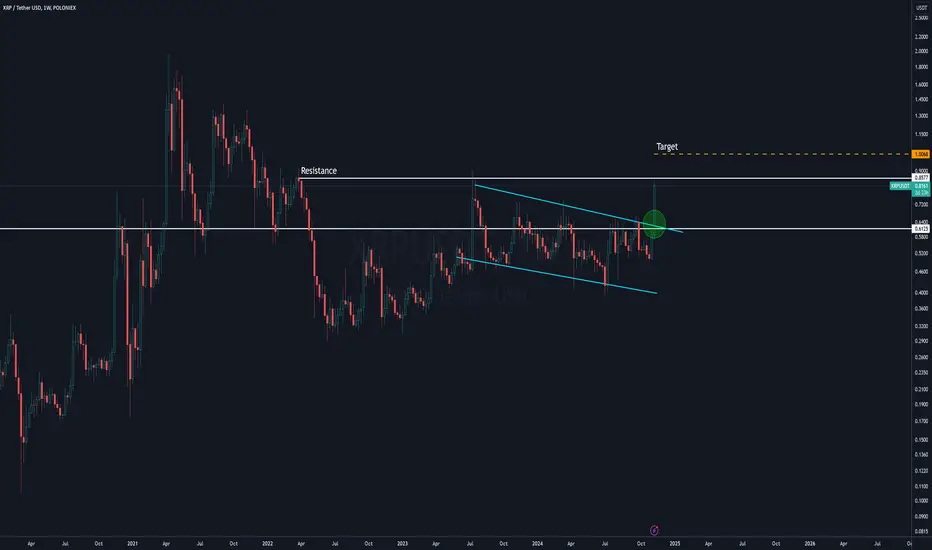
Let's take a look at the monthly time frame. We can see that the first wave has been finished in early 2013, more than 10 years ago. After that we saw correction and legendary wave 3 which has been finished with the red dot on Bullish/Bearish Reversal Bar Indicator . Last 4 years price is moving sideways, we can interpret it as a correction in wave 4 in shape of triangle. Yesterday this triangle has been broken finishing this correction!
In our opinion XPR now is in the last wave 5 in this first global super cycle. Target for this wave is between $2.5 and $3.8. The second target is more likely because wave 5 in 90% of cases set the higher high than wave 3. We want also you to notice the bullish reversal bar and green dot on the indicator at the end of the subway C. On the monthly time frame this is the strong bullish sign which will likely lead the price to the final target.
Best regards,
Skyrexio Team
___________________________________________________________
Please, boost this article and subscribe our page if you like analysis!
Xrpusdanalysis

XRP Fibs XRP has reached initial fib zone mentioned back in august (check previous XRP post). It was in the perfect buy zone for a few months and played out nicely . I will be highlighting some fib extensions targets soon :)

XRP $0.5461 Long! Anomalous Point on the Chart!🤖🔥🚀 An anomalous point has been detected on the XRP chart!
🔥 The chart shows a nice squeeze towards a level formed by a Limit Seller.
🚀 XRP $0.5461 Long!
Entry model: Breakout
First target: $0.5738
Second target: $0.6072
💡 XRP is a low-volatility coin with high volume. Leverage no more than 20x-50x!
Short stop-loss.

RIPPLE (XRPUSDT): Delivers 1000% Profit!Ripple's daily chart showcases a textbook long trade setup that has achieved stellar results, securing all profit targets.
Traders leveraging a 10x position have seen their capital multiply by 10x, with Ripple surging to a current price of $1.1215.
Trade Recap:
Entry Point: $0.5537
Stop Loss: $0.5197 (minimal downside risk)
Profit Targets:
TP1: $0.5956 ✅
TP2: $0.6635 ✅
TP3: $0.7314 ✅
TP4: $0.7733 ✅
Key Observations:
Massive Momentum: The daily candle pattern and exponential price action reflect heightened market optimism for Ripple, likely fueled by broader crypto market sentiment or Ripple-related developments.
Indicator Support: The Risological Indicator identified a clear upward trend early, providing high-confidence entry signals.
Leverage Amplification: With 10x leverage, traders achieved 1000% gains as Ripple not only met but significantly exceeded all profit targets.
Future Outlook:
Ripple’s ongoing surge positions it as a standout performer in the crypto market. At $1.1215, it remains a market favorite, and traders should monitor closely for potential pullbacks or consolidation for future entries.
Congratulations to all traders who caught this massive breakout! 🚀

XRP ( the Full Image )Hi Everyone:
today I am sharing with you the full Image from my Point off view
base on my analysis I see the target for the full movement is almost 7$
I expect the price to accelerate after passing the red line because it was the key resistance for the the last bear market
good luck everyone

XRPUSDT Breakout Alert! After 3 Years of Consolidation!BINANCE:XRPUSDT is currently breaking out of a long-term consolidation box after nearly three years of sideways movement. This breakout from key resistance levels signals a potential uptrend that traders have been eagerly anticipating. The recent price action, combined with increasing volume, suggests a strong bullish momentum that could drive prices higher.
BINANCE:XRPUSDT Currently trading at $0.69
Buy level: Above $0.67
Stop loss: Below $0.49
Max Leverage 3x
Always keep Stop loss
Follow Our Tradingview Account for More Technical Analysis Updates, | Like, Share and Comment Your thoughts

XRP Falling Channel Breakout!!! (Bullish)First time since July 2023 that XRP has finally broken to the upside outside the Descending Channel Pattern.
🔴Key Resistance= $0.85
🟢Major Line of Support= $0.61
🎯Target= $1.00
XRP Aiming for a Major Breakout: Could $1 Be Next?With recent legal and political developments spurring optimism, Ripple's CRYPTOCAP:XRP is attracting substantial market attention and could be on track for a significant rally, potentially reaching $1 or even $1.50. The potential for XRP to reach these new highs stems from a mix of technical indicators, supportive fundamentals, and external market catalysts. Here’s what to watch.
Legal Wins and Potential Tax Exemptions
Pro-XRP lawyer Bill Morgan recently shared insights on a possible price jump to $1, fueled by a series of favorable news for Ripple. Notably, the ongoing lawsuit with the SEC has seen Ripple gaining ground, with a recent court ruling in favor of Ripple and its CEO, Brad Garlinghouse, adding to investor confidence. The looming possibility of a final jurisdictional decision could further benefit XRP’s outlook as it brings the case closer to a potential resolution.
Moreover, former U.S. President Donald Trump's proposed capital gains tax exemption for crypto could significantly boost interest in XRP and other U.S.-based cryptocurrencies like ADA and HBAR. If enacted, such a policy would allow U.S. investors to potentially benefit from gains in cryptocurrencies without facing capital gains taxes. This proposal, alongside Trump’s commitment to make the U.S. the "crypto capital of the world," is helping to buoy the market as investors eye XRP as a promising asset.
Technical Outlook
At the time of writing, CRYPTOCAP:XRP is trading at $0.7122, marking a 3.13% increase within a strong bullish trend. This rally follows a breakout above the $0.71 level, with the next critical resistance zone appearing at $0.89. However, traders should note that the Relative Strength Index (RSI) currently sits at 81.37, signaling an overbought condition. Typically, an RSI above 70 suggests that an asset may be overbought, indicating the possibility of a near-term retracement.
In this case, a short-term pullback to the support level of $0.64 could occur before CRYPTOCAP:XRP resumes its upward momentum. Notably, prominent analyst Dark Defender has also identified a series of price targets, predicting that if XRP can hold above the $0.6649 support and surpass $0.74 again, the path toward $1.03, $1.35, and even $1.5 could open up, potentially by next month.
Conclusion
With a mix of strong fundamental developments and positive technical indicators, XRP's current rally appears well-supported. Investors are eyeing the $1 and $1.5 marks as realistic short-term targets, with broader ambitions for even higher prices in the coming months. However, the overbought RSI suggests caution, as a minor pullback may precede the next surge.
If Ripple’s momentum in the legal battle with the SEC continues, and if Trump’s crypto tax proposal gains traction, CRYPTOCAP:XRP could see substantial capital inflows. For now, traders and investors should watch the $0.64 support and $1.05 resistance as key indicators in this unfolding rally.

XRPUSDT - ALL Eyes on XRPconsolidated a massive symmetrical triangle (1426days!!)
XRP one of the leading coin in market(7 in rank with 39.131b in marketcap)
need a weekly close above the upper side to confirm the breakout
once it corfirmed it will be a pure sign of a bullish rally is ahead
BEST REGARDS CECILIONES🎯

#XRP/USDT#XRP
The price is moving in a descending channel on the 1-hour frame and is holding it tightly and is about to break out to the upside
We have a bounce from the lower limit of the channel at 0.5220
We have a bearish trend for the RSI that is about to break out, which supports the upside
We have a trend to stabilize above the 100 moving average
Entry price 0.5300
First target 0.5555
Second target 0.5890
Third target 0.6290


RIPPLE (XRP) Big Triangle PatternXRP is currently forming an ascending triangle pattern, with price action testing the minor resistance at 0.5631. A breakout above this resistance could pave the way for a bullish continuation toward the next target at 0.6658.
However, if the 0.5631 resistance holds, we could see a potential pullback toward the triangle’s support at 0.51077.
This analysis will be updated if any significant changes occur. Thank you.

Ripple XRP price may please holdersThe #XRPUSDT price is walking on a knife's edge)
It does not walk - it crawls))
But it happens that from time to time #XRP holders "go crazy" and try to push the #XRPUSD price up
Looking at the #Ripple price chart, we can assume that the attempt to pump may be repeated in the coming weeks/months.
What do you think, will it happen as it's drawn or not?)

XRP Possible Upmove Incoming - 0.744$ NextIn this video, we break down the current market structure for XRP, highlighting a potential long trade opportunity. XRP is showing signs of a classic manipulation phase, where price action is likely being influenced by market makers, setting up for a larger move.
Key Levels:
Target 1: $0.666 – This is our initial and easiest target, a strong area of interest where we expect price to encounter resistance.
Target 2: $0.744 – Our extended target, representing a key resistance level that XRP could approach if bullish momentum continues.

XRP signalBased on the chart provided for XRP/USD , here's an analysis of your trade setup:
Trade Analysis for XRP/USD:
- Entry Point (EN): 0.5399
- Stop Loss (SL): 0.5445
- Take Profit 1 (TP1): 0.5347
- Take Profit 2 (TP2): 0.5275
The chart illustrates a trading range where XRP is expected to move between support and resistance levels. The market shows signs of a possible rejection around 0.5445, suggesting an opportunity to enter a short position at 0.5399 with two potential profit targets, the first around 0.5347 and the second at 0.5275.
A stop-loss is set above the recent highs at 0.5445, ensuring risk management.

XRP Poised for Breakout After Consolidation to Support of $0.50In a major development, Turkish banking giant Garanti BBVA has announced a strategic partnership with Ripple and IBM to launch a secure crypto trading and custodial platform. This collaboration, aimed at enhancing the security and efficiency of Türkiye’s crypto asset market, will utilize Ripple Custody alongside IBM’s cutting-edge technologies. The integration promises robust security features, including data encryption, and will provide institutional-grade performance for Garanti BBVA’s 14,000+ customers.
A Game-Changing Partnership
Garanti BBVA's partnership with Ripple and IBM sets the stage for a transformative shift in the Turkish banking sector’s approach to digital assets. By leveraging Ripple Custody’s secure infrastructure and IBM’s technology stack, the platform will offer a flexible governance framework designed to mitigate risks posed by malicious actors and safeguard client assets. The use of Hardware Security Modules (HSMs), along with top-tier security certifications, will bolster the trust of institutional investors by eliminating single points of failure and protecting sensitive customer data.
This collaboration not only marks a key milestone for Ripple, especially amid its ongoing legal battle with the U.S. Securities and Exchange Commission (SEC), but it also signifies a major leap forward for Türkiye’s burgeoning crypto market. As Ripple continues to innovate and expand despite the regulatory hurdles, this partnership shows the firm's commitment to providing compliant and secure solutions globally.
Aaron Sears, SVP of Global Customer & Partner Success at Ripple ( CRYPTOCAP:XRP ) , expressed enthusiasm about this partnership:
“We’re thrilled to partner with Garanti BBVA Kripto to bolster the development of Türkiye’s vibrant crypto asset market. Secure custody is foundational to unlocking value and addressing the growing demand for new asset classes across the digital economy.”
Technical Outlook: What’s Next for XRP?
Despite this groundbreaking partnership, CRYPTOCAP:XRP is trading down by 1.55% at the time of writing. However, the cryptocurrency has shown resilience in the face of market fluctuations and regulatory challenges. CRYPTOCAP:XRP recently broke down of a rising wedge pattern—a typically bearish signal—but in this case, the breakout can be viewed as a consolidation move. This suggests that CRYPTOCAP:XRP could test the $0.50 support level before making a bullish run towards the $0.60 resistance pivot.
This anticipated price movement aligns with increased interest and momentum spurred by the partnership with Garanti BBVA and IBM. A break above the $0.60 level could ignite a substantial influx of buyers, with a potential surge to $1 before Halloween or the U.S. presidential election in November. The strong fundamentals behind CRYPTOCAP:XRP , including its technological advancements and strategic partnerships, indicate a positive outlook for the asset’s long-term trajectory.
Ripple’s Expansion Amid SEC Struggles
XRP’s innovation and adaptability have kept it at the forefront of the crypto market, despite its ongoing legal struggles with the SEC. The partnership with Garanti BBVA demonstrates Ripple’s ability to attract industry-leading collaborators and deliver secure, scalable solutions. Furthermore, Ripple is also preparing for an initial public offering (IPO) slated to launch within the next year. This IPO could further boost market sentiment for CRYPTOCAP:XRP , making it a key asset to watch.
XRP is well-positioned for growth, even amid short-term price volatility. As Ripple expands its services, such partnerships will only strengthen XRP’s role in the digital asset ecosystem.
Conclusion
Garanti BBVA’s partnership with Ripple and IBM is a clear testament to XRP’s long-term potential in the evolving crypto landscape. Despite the regulatory hurdles, CRYPTOCAP:XRP continues to push the envelope with technological innovations and strategic collaborations. With strong institutional backing, advanced security features, and a resilient technical setup, CRYPTOCAP:XRP could see significant gains in the coming weeks, making it an asset to keep on the radar.
As the digital asset market evolves and the legal landscape for Ripple clears up, the future looks bright for CRYPTOCAP:XRP , with potential price targets of $0.60 and beyond.

Xrp - This Is The Bullish Breakout!Xrp ( BITSTAMP:XRPUSD ) is preparing two major breakouts:
Click chart above to see the detailed analysis👆🏻
Xrp has been consolidating for almost 7 years and if a triangle breakout happens, it will certainly be followed by new all time highs. Price action and market structure are both pretty clear, and it seems almost impossible for Xrp to break the current support. Therefore longs!
Levels to watch: $0.5, $1.0
Keep your long term vision,
Philip (BasicTrading)

XRP (Crypto Ripple-USD) BUY TF H4 TP = 0.61On the H4 chart the trend started on Oct.5 (linear regression channel).
There is a high probability of profit taking. Possible take profit level is 0.61
This level, which I have outlined above, is certainly not a “finish” level. But it is the level that has the “highest percentage of hits on target.”
Using a trailing stop is also a good idea!
Please leave your feedback, your opinion. I am very interested in it. Thank you!
Good luck!
Regards, WeBelievelnTrading

XRP Price Set for a Breakout: Could $1 Be the Next Target?CRYPTOCAP:XRP has recently caught the attention of traders and investors alike, with notable price movements sparking optimism for the coin’s short- and long-term potential. Following a 4% price surge today, CRYPTOCAP:XRP is currently trading at $0.5577, and analysts predict that the cryptocurrency could be on track to hit $1 in the short term, potentially reaching as high as $7.5 in the long run.
Ripple SEC Case Drives Sentiment
XRP’s recent rally can largely be attributed to developments in the ongoing Ripple-SEC lawsuit. Market sentiment has been increasingly positive as speculations rise over the U.S. Securities and Exchange Commission (SEC) potentially missing a critical filing deadline. Ripple’s Chief Legal Officer (CLO) mentioned that the SEC had until October 16 to file the necessary Form C in its appeal, yet no filing had been made by that date. Although some sources, like journalist Eleanor Terret, indicate the SEC might have until October 18, the missed deadline speculation has fueled bullish sentiment for XRP.
The Ripple-SEC legal battle has been an overhang for XRP’s price for years, but recent cross-appeals by Ripple have shown that the company remains confident in its position. The anticipation surrounding a favorable outcome has injected renewed optimism into the market, leading to higher trading volumes and price volatility.
Additionally, Ripple’s announcement of exchange partnerships ahead of the launch of its new stablecoin, RLUSD, also plays a significant role in boosting confidence. Exchanges like Bitstamp, Uphold, and Bullish, along with market makers such as B2C2 and Keyrock, are on board to provide liquidity for RLUSD, further solidifying Ripple's ecosystem.
Technical Analysis
On the technical side, CRYPTOCAP:XRP has exhibited positive market behavior in the past few days, fueled by this optimistic sentiment. Currently trading above the key $0.56 level, We are predicting a breakout within the next 15 to 30 days, driven by mounting pressure between buyers and sellers. The analyst has identified a critical resistance level between $0.61 and $0.62, which, if breached, could lead to a significant price uptick.
At the time of writing, XRP’s technical indicators reveal a moderate Relative Strength Index (RSI) of 51.17, signaling neither an overbought nor oversold market. This neutral RSI suggests that the coin has enough momentum to push higher without hitting overbought conditions, making a move to $0.61 pivot Point.
Furthermore, CRYPTOCAP:XRP is trading just above its 200-day Moving Average (MA) but remains slightly below its 50-day and 100-day MAs, reflecting consolidation in the market.
As CRYPTOCAP:XRP continues to consolidate, its triangle formations suggest a buildup of tension between buyers and sellers, setting the stage for a breakout. Should the price breach the identified resistance, a bullish move to $1 could come into play, aligning with our predictions. On the downside, a failure to break the “Genuine Wake-Up Line” and falling below the “Atlas Line” could signal a bearish reversal, but for now, the indicators are tilting towards a bullish outcome.
Long-Term Outlook: $7.5 Potential
While the short-term target remains $1, the long-term outlook for CRYPTOCAP:XRP is even more exciting. If market conditions remain favorable CRYPTOCAP:XRP could rally further, potentially reaching $7.5. This prediction is contingent upon the broader cryptocurrency market rally, the ongoing developments in the Ripple-SEC lawsuit, and Ripple’s success in rolling out its stablecoin and expanding its cross-border payment solutions.
Given the increasing utility of CRYPTOCAP:XRP , particularly in enterprise-grade payment solutions, and Ripple’s strong regulatory focus with RLUSD, the coin could become an essential part of the evolving financial infrastructure.
Market Confidence Boosts CRYPTOCAP:XRP
The broader crypto market has also experienced positive momentum, with Bitcoin recently hitting $68,000 and other altcoins following suit. This "Uptober" rally, as many are calling it, has led to renewed confidence across the board. XRP’s participation in this rally is bolstered by its role in cross-border payments and the anticipation of the Ripple stablecoin, making it a strong candidate for further price growth.
Conclusion
CRYPTOCAP:XRP is riding on the back of positive market sentiment fueled by the Ripple-SEC case and Ripple’s upcoming stablecoin launch. Technically, the coin is well-positioned for a breakout in the next few weeks, with $0.60 acting as a key pivot level. If XRP manages to break through the $0.61-$0.62 resistance, a run toward $1 could become a reality, and the long-term prospects remain equally bullish with the possibility of hitting $7.5 in the future.
As always, investors should remain cautious, given the legal uncertainties, but the outlook for CRYPTOCAP:XRP seems brighter than it has in recent months.

Ripple / XRP AnalysisXRP price today is $0.39 with a 24hour trading volume of 1.2 billion dollar. XRP price is up 1% in the last 24 hours and 11% since last week
In the daily timeframe, the price formed an ascending price channel pattern, and after being supported by the lower trendline, it started moving upward. However, the $0.4 resistance level has paused the rally for now, resulting in short-term price consolidation.If xrp surpasses the $0.4 level, the channel’s middle trendline and the $0.5 levels will be the next obstacles to surpass. On the other hand, if the $0.4 level rejects the price, the channel’s lower boundary will be the next significant support level. short term targets are 0.43 , 0.45 , 0.47 and 0.5$
Ripple Moves 100M XRP amid growing whales Interest in asset plus xrp overtakes BTC and ETH in terms of trading Volume in Australia

My thoughts of the SEC and their agenda.They can stop suppressing our coin now and stop putting their crap where it doesn't belong.
It doesn't just affect America.. it affects the entire world and Xrp. Nuff said.

XRPUSDT - Sell all my XRP at 0.56Looking at the 8-hour chart we can see that there is some upside potential on XRP towards 0.56 - 0.58 area's before we see another push downwards. Over all XRP is not looking to good on the 1-Month chart however on the 8-Hour chart, the RSI has reset and we should see some short term upside movement. I think we could see XRP below 0.50 over the next few weeks allowing for a good buy opportunity.

XRP BULL to $0.82If this bull run doesn’t fizzle out by the weekend, even XRP might finally hitch a ride to the moon—pack your bags, folks, pigs might be flying soon!
