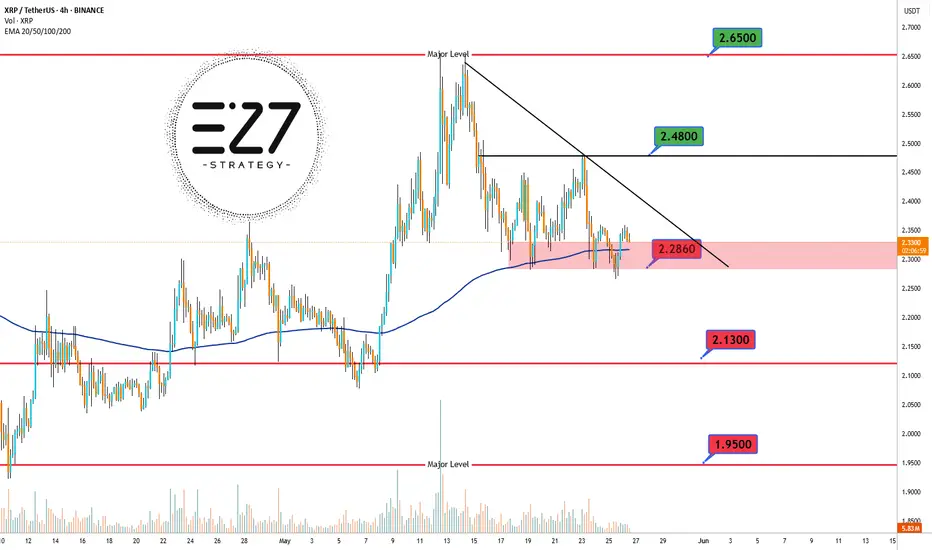
XRPUSDT The 4-hour chart of BINANCE:XRPUSDT shows that the overall trend remains bullish, but the price is currently in a corrective downward phase. 📉 At the moment, XRP is trading in a highly critical zone, right at the 2.2860 USDT support level, which aligns with the 200 EMA — often considered a dynamic support area. 🛡️ Despite this confluence, the price still sits below the descending trendline, indicating continued bearish pressure. ⚠️ If the price manages to hold this key zone and break above the trendline, a move toward the next resistance at 2.4800 USDT and potentially 2.6500 USDT could follow. 🚀 However, losing the 2.2860 support could trigger a deeper drop toward 2.1300 USDT and even 1.9500 USDT. ❗ This current level, where static support intersects with the 200 EMA, is a make-or-break zone that will likely define the short-term direction of XRP.
Support & Resistance Levels:
🔼 Major Resistance: 2.6500 USDT
🔼 Secondary Resistance: 2.4800 USDT
⚡ Dynamic Resistance (trendline): ~2.3500 USDT
🔽 Key Support (current price level): 2.2860 USDT
🔽 Secondary Support: 2.1300 USDT
🔽 Major Support: 1.9500 USDT
Xrpusdanalysis
XRUSD Price Market Trend Day TF Long Term BUYXRPUSD is trading at 2.33674, with a strong recommendation to buy for long-term gains. The chart indicates a potential upward trajectory, with price targets set at:
TP1: 2.44200 (Near-term resistance)
TP2: 3.00500 (Mid-term target)
TP3: 3.40000 (Long-term bullish goal)
The mention of 3.40000 at the top of the chart suggests this is a psychological resistance level, reinforcing the optimistic outlook if bullish momentum sustains.

XRPWe must fill the gap at $2.15 before we move higher.
I believe we will continue moving down through the end of May, until then we must Dollar Cost Average.
This is not financial advice, but this is what I will be doing moving forward.

XRPXRP just created a Inversion FVG on the 1h timeframe, paired with a sweep of the Previous Day Lows, indicates a strong move upwards.
We should see a retest of Previous Day High at $2.36 which may lead to a test of a 4h FVG between $2.38 - $2.40.
If we get any big announcements this weekend, we may see run towards $3 heading into the week.
Have an exit strategy once we have our banana move, it's been a great journey.
LOCK IN.

#XRP/USDT#XRP
The price is moving within a descending channel on the 1-hour frame, adhering well to it, and is heading for a strong breakout and retest.
We are seeing a bounce from the lower boundary of the descending channel, which is support at 2.29.
We are seeing a downtrend on the RSI indicator that is about to break and retest, supporting the upward trend.
We are looking for stability above the 100 Moving Average.
Entry price: 2.30
First target: 2.33
Second target: 2.37
Third target: 2.42

XRP (Ripple) is at a Critical Supply Zone: Will it Fall or Rise?FenzoFx—Ripple (XRP) is testing the resistance level, which expands from $2.40 to $2.46, with the Stochastic Oscillator hinting at an overbought market.
A new bearish wave could emerge if the resistance holds. In this scenario, the price could dip toward the 50.0% Fibonacci retracement level at $2.37, backed by the 50-SMA.
The bearish outlook should be invalidated if XRP/USD exceeds and stabilizes above $2.46.
Trade XRP/USD with low spread, no commission and no swap at FenzoFx.

Next levels for XRP!This Gann arc held as support and price will go right to the next arc. I'm seeing a confluence with th 1.618!
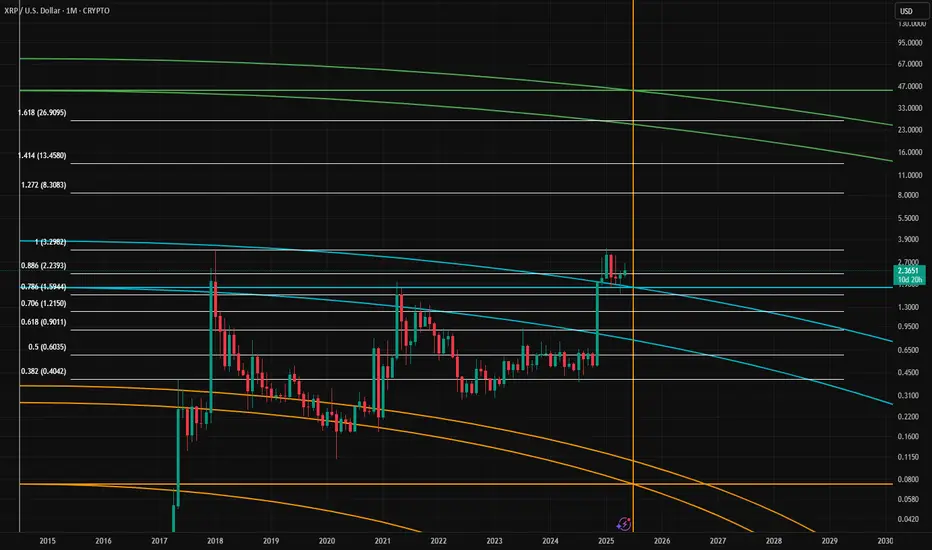
Next levels for XRPThis Gann arc held as support and price will go right to the next arc. I'm seeing a confluence with th 1.618!

ALTCOIN BOOM FOR RIPPLE XRP 2025-2026 PROPOSALThe RLUSD "Trojan Horse" Thesis XRP’s path to $33 hinges on RLUSD becoming the first stablecoin to merge institutional adoption with DeFi utility, creating an inescapable demand loop for XRP. Here’s why this is not just another stablecoin play:
1. RLUSD Is a Liquidity Nuclear Reactor for XRP Unlike Tether (USDT) or Circle (USDC), RLUSD isn’t designed to exist in isolation. Ripple’s patents confirm RLUSD will use XRP as collateral in its liquidity pools (e.g., 80% RLUSD / 20% XRP). This means:
Every 1B of RLUSD adoption requires 250M of XRP buys to collateralize pools (25% ratio). If RLUSD captures just 5% of Tether’s market cap ($112B), it would necessitate 14B in XRP demand – 4x XRP’s current market cap.
This collateral mechanism creates a self-reinforcing cycle: RLUSD adoption → XRP buys → price surge → RLUSD credibility ↑ → adoption ↑.
2. Regulatory Arbitrage: RLUSD as the “KYC Stablecoin” Ripple’s SEC settlement gives RLUSD a first-mover advantage as the only compliant stablecoin for banks. While Tether faces existential regulatory risk, RLUSD is pre-vetted:
Pre-integrated with RippleNet’s 400+ KYC’d institutions, bypassing adoption friction. Designed to comply with the EU’s MiCA and US’s Clarity for Payment Stablecoins Act (2024), making it the sole stablecoin legal in G20 jurisdictions.
Banks will prefer RLUSD over “risky” USDT for cross-border flows, forcing them to hold XRP as collateral. This turns XRP into a shadow reserve currency.
3. CBDC Interoperability: RLUSD as the Bridge Ripple’s CBDC partnerships (20+ governments) plan to use RLUSD as a “neutral layer” between sovereign digital currencies. For example:
A Japanese CBDC user sending to Brazil’s Drex would convert JPY → RLUSD → BRL via XRP-ledger, with RLUSD acting as the sanction-proof intermediary. This would require central banks to hold RLUSD (and thus XRP) as liquidity reserves, akin to IMF’s SDR basket.
No other stablecoin has this government-level pipeline—not even USDC.
4. Killing DeFi’s Liquidity Fragmentation RLUSD is being deployed on both XRPL and Ethereum, but with a twist: Ripple’s AMMs (Automated Market Makers) will prioritize XRP/RLUSD pairs across chains. This:
Forces DeFi protocols to hold XRP to access RLUSD liquidity (e.g., a DEX needs XRP to create RLUSD pools). Redirects stablecoin yield farming demand into XRP staking.
Result: RLUSD becomes the liquidity glue between TradFi and DeFi, with XRP as its backbone.
5. The “SWIFT Killer” Endgame SWIFT processes $40T/year but takes 3–5 days per transaction. Ripple’s RLUSD integration allows real-time FX swaps via XRP:
A French bank sends RLUSD to Mexico → XRP ledger instantly converts RLUSD to MXN at near-zero cost. This disintermediates correspondent banks and saves institutions SEED_TVCODER77_ETHBTCDATA:10B + annually in fees.
For this to work at scale, RLUSD liquidity pools must hold X,XXX,XXX,XXX in XRP – a demand shock no opponent can mathematically counter.

XRP : LONG FOR THIS WEEK !Hello friends
Considering the good growth we had, you can see that the price has formed a double top pattern and corrected after reaching its ceiling.
Now, with the price correction, there is a good opportunity to buy in stages and with capital management and move with it to the specified goals.
*Trade safely with us*

Is XRP About to Rebound? Bullish Signals EmergeXRP Flashes Bullish Signal: Technical Indicator Hints at Imminent Rebound – 100x Gains Coming? The Future Is Closer Than You Think—Analyst
The cryptocurrency market is a volatile and often unpredictable space, where fortunes can be made and lost in the blink of an eye. Among the myriad of digital assets vying for attention, XRP, the cryptocurrency associated with Ripple Labs, has consistently been a topic of intense debate and speculation. While it has faced its fair share of challenges, including regulatory scrutiny and market fluctuations, XRP continues to hold the interest of investors and analysts alike.
Recently, XRP has been displaying what some experts are interpreting as bullish signals, suggesting a potential rebound in its price. These signals are primarily derived from technical analysis, a method of evaluating assets by analyzing statistical trends gathered from trading activity, such as price movement and volume. One particular technical indicator is hinting at an imminent upswing, leading some analysts to predict significant gains for XRP in the near future.
This article delves into the technical indicators flashing bullish signals for XRP, examines the factors that could contribute to a potential rebound, and explores the possibility of a 100x gain, a prospect that has captured the imagination of many XRP enthusiasts.
Technical Indicators Pointing Towards a Rebound
Technical analysis plays a crucial role in understanding potential price movements in the cryptocurrency market. Several indicators are currently suggesting a bullish outlook for XRP:
1. Moving Averages: Moving averages are commonly used to smooth out price data over a specific period, helping to identify trends. When a shorter-term moving average crosses above a longer-term moving average, it is often seen as a bullish signal, indicating that the price is likely to rise. XRP has recently exhibited this "golden cross" pattern on certain timeframes, suggesting a potential upward trend.
2. Relative Strength Index (RSI): The RSI is a momentum indicator that measures the magnitude of recent price changes to evaluate overbought or oversold conditions in the price of an asset. An RSI value below 30 typically indicates that an asset is oversold and may be due for a rebound. XRP's RSI has been hovering in oversold territory, suggesting that buying pressure could soon increase.
3. Fibonacci Retracement Levels: Fibonacci retracement levels are horizontal lines that indicate potential support and resistance levels based on the Fibonacci sequence. These levels are often used to predict where the price of an asset might find support during a downtrend or resistance during an uptrend. XRP has been testing key Fibonacci retracement levels, and a successful breakout above these levels could signal a significant price increase.
4. Chart Patterns: Technical analysts also look for specific chart patterns that can provide clues about future price movements. Some patterns, such as the "inverse head and shoulders" or the "double bottom," are considered bullish formations, suggesting that the price is likely to rise. XRP has been forming patterns that resemble these bullish formations, further supporting the possibility of a rebound.
Factors Contributing to a Potential XRP Rebound
While technical indicators can provide valuable insights, it is essential to consider the fundamental factors that could influence XRP's price. Several factors could contribute to a potential rebound:
1. Ripple's Ongoing Legal Battle with the SEC: The most significant factor weighing on XRP's price has been Ripple's legal battle with the U.S. Securities and Exchange Commission (SEC). The SEC alleges that Ripple sold XRP as an unregistered security, a claim that Ripple vehemently denies. A favorable outcome in this case could significantly boost XRP's price, as it would remove a major source of uncertainty and regulatory risk.
2. Growing Adoption of XRP for Cross-Border Payments: Ripple has been actively promoting XRP as a solution for cross-border payments, touting its speed, efficiency, and low cost compared to traditional methods. Increased adoption of XRP by financial institutions and payment providers could drive demand for the cryptocurrency, leading to a price increase.
3. Expansion of Ripple's Ecosystem: Ripple has been expanding its ecosystem by developing new products and services that utilize XRP. These include RippleNet, a network of financial institutions that use Ripple's technology for cross-border payments, and On-Demand Liquidity (ODL), a service that allows businesses to use XRP to source liquidity for cross-border transactions. A thriving ecosystem could attract more users and investors to XRP, further supporting its price.
4. Overall Cryptocurrency Market Sentiment: XRP's price is also influenced by the overall sentiment in the cryptocurrency market. A positive market sentiment, characterized by rising prices and increased investor confidence, could lift XRP along with other cryptocurrencies. Conversely, a negative market sentiment could put downward pressure on XRP's price.
The Possibility of a 100x Gain: A Realistic Scenario?
The prospect of a 100x gain in XRP's price has captured the imagination of many investors. While such a gain is certainly possible, it is essential to approach this scenario with a healthy dose of skepticism and realism.
To achieve a 100x gain, XRP's price would need to increase by a factor of 100 from its current level. This would require a massive influx of capital into XRP, driven by a combination of factors, such as a favorable outcome in the SEC case, widespread adoption of XRP for cross-border payments, and a significant increase in overall cryptocurrency market capitalization.
While these factors are not entirely out of the realm of possibility, they are by no means guaranteed. The cryptocurrency market is inherently unpredictable, and unforeseen events could derail any potential rally in XRP's price.
Analyst Perspective: The Future Is Closer Than You Think
Despite the inherent risks and uncertainties, some analysts remain optimistic about XRP's future. These analysts point to the potential for XRP to disrupt the traditional cross-border payments industry, the growing adoption of Ripple's technology, and the possibility of a favorable outcome in the SEC case as reasons for their bullish outlook.
One analyst, in particular, has stated that "the future is closer than you think" for XRP, suggesting that significant gains could be realized in the near future. This analyst believes that XRP is currently undervalued and that its price could surge once the regulatory uncertainty surrounding Ripple is resolved.
Conclusion: Navigating the XRP Landscape
XRP presents a complex and often contradictory picture. Technical indicators are flashing bullish signals, suggesting a potential rebound in its price. Factors such as Ripple's ongoing legal battle with the SEC, growing adoption of XRP for cross-border payments, and the overall cryptocurrency market sentiment could all play a role in determining XRP's future.
While the possibility of a 100x gain is enticing, it is essential to approach this scenario with caution and realism. The cryptocurrency market is inherently volatile, and unforeseen events could impact XRP's price.
Ultimately, whether XRP achieves its full potential remains to be seen. However, the recent bullish signals and the ongoing developments surrounding Ripple suggest that the future of XRP is closer than many might think. As always, investors should conduct their own research, assess their risk tolerance, and make informed decisions before investing in any cryptocurrency, including XRP.

Is XRP the Next Crypto Rocket?$2,5 Breakout Targets $3.5 or moreI see a clear setup with actionable insights. The chart shows XRP forming a range and deviation at 1.77$, with a recent bullish breakout attempt. Here’s my breakdown:
Technical Analysis
Deviation of the global range points at potential consolidation(blue horizontal line)
Breakout Attempt: A sharp green candle pushed above the $2,36 resistance, but it’s yet to close convincingly above it. The red arrow projecting upward suggests optimism for a move toward $3–$3,5if the breakout holds.
Given today’s date (May 18, 2025, 03:40 PM EEST), this setup aligns with recent crypto market trends. XRP’s price action could be reacting to broader market sentiment, regulatory news, or Ripple-related developments, which have historically driven volatility.
This chart screams opportunity if the breakout holds. However, watch for a false breakout—crypto is notorious for shakeouts. A failure to close above $2,5 could see price retrace to $2,3 or lower. I’d monitor the next 2-3 weeksfor confirmation.

XRPHighly likely XRP retest $2.20 before moving higher.
Long-term investors are looking for lower prices before a tariff deal with China. A liquidity sweep is needed before we move higher, or we will continue moving lower.
We break $2.50 and we will see $3 quickly after. ETF going Live on the 19th, China deal, SEC case ending will all catapult price.
LOCK IN 🔐

XRPWe are fixing to witness a run to $3 in a hurry.
New outlets, governments, banks, institutions, are all diving into crypto. An ounce of great news for XRP sends us moving up in a HURRY.
Have an exit strategy in place to take profits, and cycle some profits into other assets to continue to build your wealth.
Lock In.

DeGRAM | XRPUSD volatility expansion📊 Technical Analysis
● XRP is climbing inside a rising channel (green) that has developed on top of the former $2.05‑2.15 demand zone; successive higher lows along the blue trend‑line confirm fresh bullish structure.
● Price has already cleared the long‑standing wedge roof; holding above the channel mid‑line keeps $2.60 resistance (red) in focus.
💡 Fundamental Analysis
● A U.S. judge has ordered the SEC and Ripple to enter a pre‑trial settlement conference before 31 May, fuelling speculation that the multi‑year case could end with a fine rather than a ban—boosting institutional appetite for XRP.
✨ Summary
Rising‑channel momentum plus hopes of a favourable Ripple‑SEC resolution support a push from $2.45 toward $2.60‑2.75.
-------------------
Share your opinion in the comments and support the idea with a like. Thanks for your support!

XRPUSDT Bullish Setup – Swing Trade Opportunity Toward $6.00XRP has shown a consistent pattern of strong bullish impulses followed by consolidation zones, and this rhythm has repeated multiple times on the weekly chart—signaling high confidence in pattern continuation.
Let's break it down
🔁 Repetitive Buying + Consolidation Patterns
19 Sep 2022: Strong buying candle triggered a short-term rally, followed by a multi-week consolidation period.
10 July 2023: Similar impulse move occurred—buying strength picked up, and then the price consolidated again.
4 Nov 2024: Most recent and strongest impulse—3 consecutive bullish candles that broke out of long-term descending resistance, confirming structural shift. This was again followed by consolidation—mirroring previous price behavior.
📈 Breakout Confirmation & Trend Structure
Breakout of Descending Trendline (Red): XRP broke out of its long-term bearish trendline decisively, confirming a trend reversal.
Support Zone Holding Firm (1.95 USDT): Price retraced slightly but respected the newly established support above 1.9500.
Consolidation Above Breakout: Post-breakout consolidation is forming a bullish continuation pattern.
Key Technical Levels
Entry Zone (Buy Area): Current zone between $2.10 and $2.50 (ideal accumulation zone for swing traders).
Technical Stop Loss: $1.9500 – key level that has acted as both resistance and now flipped to support.
Take Profit Targets
TP1: $3.4157 – previous resistance and a strong psychological level.
TP2: $6.000 – projected top of current trend channel (green line), aligns with 131.59% upside from current level.
Risk-Reward: Over 5:1 R:R on this setup, extremely favorable for mid-to-long-term swing trades.
Bearish Invalidations
If the price closes significantly below $1.95 on the weekly, the current bullish thesis weakens, and price may retest deeper supports around $1.25 or below. But as long as the structure holds, bulls are in control.
📊 Trade Setup Summary
📥 Entry 2.10 – 2.50
🛑 Stop Loss 1.9500
🎯 Take Profit 1 3.4157
🎯 Take Profit 2 6.0000
⚖️ R:R Ratio 5.32x
The chart tells a powerful story—repeated buying, breakout confirmation, support holds, and continuation setup. XRP is positioning itself for a major move, with $6.00 potentially on the table by the end of 2025.
This is an ideal zone for swing traders and position traders who are comfortable with multi-month holding periods and high R:R setups.

Momentum Rising – $XRP Bulls Eyeing Next Leg UpCRYPTOCAP:XRP is waking up 🔥
Price has broken out of the long-term downtrend and is now testing the important horizontal resistance area
A clean break above this range might spark the next big move. Volume is on the increase, and the structure is all good
Time to keep an eye on this one 👀

DeGRAM | XRPUSD Overcame $2.00 Level!📊 Technical Analysis
XRP/USDT broke out of a descending wedge, reclaiming $2.00 and eyeing the upper resistance level near $2.40.
💡 Fundamental Analysis
• Ripple’s partial court victory narrows the SEC case, lifting regulatory clouds.
• CME preparing XRP futures signals rising institutional appetite.
• Central-bank CBDC pilots explore Ripple tech, enlarging utility prospects.
• Ripple’s On-Demand Liquidity volumes keep setting records in 2025, and XRPL’s AMM upgrade is live, deepening liquidity.
• Whale wallets added 110 M XRP in April.
• ETF chatter and expanding Latin-American remittance use support demand.
• A softer USD after benign CPI fuels altcoin inflows.
✨ Summary
A wedge breakout plus legal clarity, institutional products, network upgrades and demand growth favor a climb toward $2.40; and then to $2.75.
-------------------
Share your opinion in the comments and support the idea with a like. Thanks for your support!

VWAPs Don't Lie—XRP Faces Judgment Day At Monthly Support
In the volatile world of cryptocurrency trading, technical indicators often serve as critical guideposts for investors seeking to navigate uncertain markets. Among these indicators, the Volume Weighted Average Price (VWAP) has emerged as a powerful tool for assessing market sentiment and potential price movements. For XRP, Ripple's native cryptocurrency, the VWAP is currently telling a compelling story as the digital asset faces a critical juncture at its monthly support level while simultaneously breaking through key resistance barriers.
Understanding VWAP and Its Significance for XRP
The Volume Weighted Average Price represents the ratio of the value traded to total volume traded over a specific time period. Unlike simple moving averages, VWAP gives more weight to price moves that occur on higher volume, providing a more accurate representation of a security's true average price. For traders, VWAP serves as a benchmark that can indicate potential support and resistance levels.
For XRP, the current VWAP analysis reveals a crucial moment in its price trajectory. After months of consolidation following the partial legal victory against the SEC, XRP's price action against its VWAP indicators suggests we're approaching what many analysts are calling a "judgment day" scenario at its monthly support level.
Historically, XRP has respected its monthly VWAP lines with remarkable consistency. When the price falls below this indicator, it often signals sustained downward pressure; conversely, when it trades above the VWAP, bullish momentum typically follows. What makes the current situation particularly compelling is that XRP is simultaneously testing its monthly support while breaking through a key resistance level that has capped its upward movement for weeks.
XRP's Technical Landscape: Breaking Key Resistance
The recent breakthrough above a significant resistance level has generated fresh excitement among XRP investors. This resistance zone, which had repeatedly rejected upward price movements since early this year, finally gave way amid increasing trading volumes and renewed market optimism.
Several factors contributed to this technical breakout:
1. Increased Trading Volume: A substantial surge in trading activity provided the necessary momentum to push through resistance.
2. Improving Market Sentiment: The broader cryptocurrency market has shown signs of recovery, lifting sentiment across most digital assets.
3. Institutional Interest: Reports of increasing institutional accumulation of XRP have bolstered confidence in its long-term prospects.
4. Technical Convergence: Multiple technical indicators, including the Relative Strength Index (RSI) and Moving Average Convergence Divergence (MACD), aligned to signal bullish momentum.
The breakthrough above this key resistance level has opened the path for XRP to potentially test higher price targets. Technical analysts have identified several important levels to watch in the coming weeks, with projections suggesting that XRP could reach significantly higher valuations if the current momentum is sustained.
Monthly Support: The Line in the Sand
While the resistance breakthrough is undoubtedly positive, XRP simultaneously faces a critical test at its monthly support level. This support zone has acted as a reliable floor for XRP prices during previous downturns, and maintaining this level is crucial for preserving bullish momentum.
The monthly VWAP serves as a key component of this support structure. As volumes have increased, the VWAP has begun to flatten and show early signs of turning upward—a potentially bullish signal. However, failure to hold this support could trigger a cascade of selling pressure, potentially erasing recent gains.
Market observers note that this monthly support level coincides with several other technical indicators, creating what traders call a "confluence zone." These areas, where multiple support factors align, often prove to be significant inflection points for price action. For XRP, the current confluence zone represents not just a technical support level but a psychological barrier that could determine market sentiment in the months ahead.
The Ripple Effect: Fundamental Catalysts Behind Price Action
While technical analysis provides valuable insights into potential price movements, fundamental factors continue to influence XRP's market performance. Ripple, the company closely associated with XRP, has maintained progress on several fronts despite ongoing legal challenges.
The company's cross-border payment network, RippleNet, continues to expand its global footprint, with new partnerships announced across financial sectors. These real-world applications provide a foundation for XRP utility beyond speculative trading, potentially supporting long-term value.
Additionally, developments in the regulatory landscape have created both challenges and opportunities. The SEC case against Ripple, which initially caused significant market uncertainty, has evolved in ways that many legal experts interpret as increasingly favorable for Ripple. Court rulings that distinguished XRP sales to institutional investors from sales on secondary markets have provided some regulatory clarity, though final resolutions remain pending.
The combination of expanding real-world utility and potential regulatory clarity has created an environment where technical breakouts may have stronger fundamental support than in previous cycles.
Global Market Context: External Influences on XRP
XRP's price action does not occur in isolation, and global market factors continue to exert significant influence. Several external factors currently impact XRP's technical outlook:
1. Dollar Strength: Fluctuations in the U.S. dollar index have historically shown inverse correlations with cryptocurrency prices, including XRP.
2. Institutional Capital Flows: Shifting patterns in institutional investment have created new dynamics in the cryptocurrency market.
3. Regulatory Developments: Beyond the Ripple case, the broader regulatory environment for cryptocurrencies continues to evolve globally.
4. Correlation with Bitcoin: Despite efforts to establish independent price action, XRP maintains significant correlation with Bitcoin's market movements.
These external factors create a complex backdrop against which the technical battle at XRP's monthly support is playing out. Traders are carefully monitoring these influences for signs of how they might affect XRP's ability to maintain support and extend its recent breakout.
Trading Strategies at the Inflection Point
For traders navigating the current technical landscape, the confluence of monthly support testing and resistance breakout creates both opportunities and risks. Several trading approaches have emerged:
1. Breakout Confirmation Strategy: Some traders are waiting for additional confirmation of the resistance breakout before establishing new positions, looking for sustained trading above the recently broken level with strong volume.
2. Support Bounce Plays: Others are focusing on the monthly support level, planning entries if the price successfully bounces from this zone with convincing volume patterns.
3. Scaling Strategies: More conservative traders are implementing scaling strategies, gradually building positions as technical confirmations emerge.
4. Options and Derivatives Plays: In the derivatives markets, strategies focused on volatility expectations have gained popularity as traders anticipate significant price movement following the resolution of the current technical standoff.
What unifies these varied approaches is recognition of the current juncture's significance. The convergence of monthly VWAP support testing and resistance breakthrough represents a relatively rare technical setup that typically precedes substantial price movement in one direction or another.
Historical Precedents: What Past VWAP Interactions Tell Us
Looking at historical instances where XRP faced similar technical conditions provides valuable context for the current situation. Several notable examples stand out:
In late 2020, XRP successfully defended its monthly VWAP support before beginning a rally that would eventually see prices increase by over 800% in the subsequent months. The successful defense of this support level, combined with increasing volume, preceded one of XRP's most significant bull runs.
Conversely, in May 2021, XRP's failure to maintain its position above the monthly VWAP coincided with a market-wide correction that saw the asset lose over 70% of its value. This historical instance demonstrates the potential downside risk when VWAP support fails.
More recently, in early 2023, XRP tested its monthly VWAP during a period of market uncertainty. The successful defense of this level led to a period of relative price stability before a measured upward movement. This example presents a more moderate outcome possibility for the current situation.
These historical precedents illustrate the range of potential outcomes following interactions with monthly VWAP levels, from dramatic rallies to severe corrections to more measured movements. What they consistently demonstrate is that these interactions tend to precede significant price action rather than continued consolidation.
Fresh Upside Momentum: Targets and Projections
With XRP breaking through key resistance and testing monthly support, attention naturally turns to potential upside targets if bullish momentum continues. Technical analysts have identified several significant levels:
1. Initial Resistance Zone: The first major resistance above current levels sits approximately 20-25% higher, representing previous local highs that briefly capped earlier rally attempts.
2. Psychological Barriers: Beyond technical levels, psychological price points represent important barriers that could temporarily slow momentum as profit-taking occurs.
3. Long-term Technical Targets: Some analysts have identified far more ambitious targets based on larger technical patterns, though these would likely require sustained momentum over a longer timeframe.
It's important to note that these projections assume XRP successfully defends its monthly support level. Failure to maintain this support would invalidate many of these upside targets and potentially trigger downside projections instead.
Volume patterns will be critical in determining whether upside momentum can be sustained. Thus far, volume has shown encouraging signs, with increasing participation during upward price movements—a classic sign of authentic buying pressure rather than technical-driven price action with limited participation.
Risk Factors and Potential Headwinds
Despite the promising technical setup, several risk factors could disrupt XRP's path forward:
1. Legal Uncertainties: Though Ripple has secured some favorable rulings, the ongoing legal case continues to present unpredictable risks.
2. Market Liquidity Concerns: Broader market liquidity conditions could impact XRP's ability to sustain momentum, particularly if institutional investors reduce risk exposure.
3. Technical Invalidation: A decisive break below monthly support would invalidate the bullish case and potentially trigger substantial selling.
4. Competitor Developments: Advances from competing blockchain payment solutions could impact market perception of XRP's utility and long-term value proposition.
Prudent investors acknowledge these risks while assessing the technical opportunity presented by the current setup. Risk management approaches, including clearly defined exit strategies if support fails, remain essential despite the optimistic technical outlook.
Conclusion: Judgment Day for XRP
The confluence of monthly VWAP support testing and key resistance breakthrough has created what many analysts describe as a judgment day scenario for XRP. The resolution of this technical standoff will likely determine the asset's price trajectory for weeks or even months to come.
The VWAP indicator, with its volume-weighted approach to price analysis, has historically provided reliable signals for XRP's major price movements. The current readings suggest we're at a critical inflection point where significant price discovery in one direction or the other appears imminent.
For investors and traders, this technical juncture represents both opportunity and risk. The resistance breakthrough provides a potentially bullish signal, but this outlook remains contingent on successfully defending the monthly support level where the VWAP currently resides.
As volume patterns evolve and price action develops around these key levels, market participants would be wise to remember the maxim that has proven reliable throughout XRP's trading
history: when it comes to identifying genuine market momentum and sustainable price trends, VWAPs don't lie. The coming weeks will reveal whether XRP can transform its technical promise into sustained upward momentum or if support failure will lead to renewed downside pressure.
The judgment day at monthly support has arrived for XRP. The market's verdict awaits.

XRPWe're eyeing $2.25 heading into next week.
We should be in a clear bull market through May into September. We've packed our bags for this run, next post we will go over profit taking as we move higher.
Stay patient.

XRP Breaks Down from Rising Wedge – Is a Deeper Pullback Coming?XRP has officially broken down from a rising wedge pattern on the daily chart, closing below its lower trendline support. This could signal the beginning of a short-term bearish phase unless key support levels hold up.
Chart Breakdown
On the daily timeframe, XRP was trading within a rising wedge—a pattern typically considered bearish when it breaks to the downside. The breakdown came after price failed to reclaim the $2.30–$2.35 resistance zone, followed by a sharp move lower toward the $2.00 level.
Key technicals:
200-day EMA (blue line) is now acting as the first major support near $2.00
50-day EMA (purple) has turned into resistance
Price is hovering around $2.15, retesting the wedge from below
Bearish Price Targets
With the wedge breakdown confirmed, here are potential downside levels to watch:
$2.00 – Psychological level and strong dynamic support from the 200 EMA
$1.89 – Horizontal support from late March
$1.64–$1.61 – A critical support zone that marked the low before the last rally
If XRP fails to hold above $2.00 and closes below it, momentum could shift strongly in favor of the bears.
Bullish Scenario?
While the pattern suggests bearish momentum, bulls could still regain control if XRP closes back above $2.20 and re-enters the wedge. That would invalidate the breakdown and potentially open the door back toward $2.35 and higher.
Final Thoughts
The wedge breakdown is a warning sign for short-term traders. Unless XRP reclaims key levels quickly, it could be headed toward the $1.89–$1.64 support range. Keep an eye on volume and EMA support—these will likely determine if this is just a dip or the start of a larger correction.

XRP/USD "Ripple vs U.S Dollar" Crypto Heist Plan (Scalping/Day)🌟Hi! Hola! Ola! Bonjour! Hallo! Marhaba!🌟
Dear Money Makers & Robbers, 🤑 💰💸✈️
Based on 🔥Thief Trading style technical and fundamental analysis🔥, here is our master plan to heist the XRP/USD "Ripple vs U.S Dollar" Crypto Market. Please adhere to the strategy I've outlined in the chart, which emphasizes long entry. Our aim is the high-risk Red Zone. Risky level, overbought market, consolidation, trend reversal, trap at the level where traders and bearish robbers are stronger. 🏆💸"Take profit and treat yourself, traders. You deserve it!💪🏆🎉
Entry 📈 : "The vault is wide open! Swipe the Bullish loot at any price - the heist is on!
however I advise to Place buy limit orders within a 15 or 30 minute timeframe nearest or swing low or high level for pullback entries.
Stop Loss 🛑:
📍 Thief SL placed at the recent/swing low level Using the 1H timeframe (2.600) Day trade basis.
📍 SL is based on your risk of the trade, lot size and how many multiple orders you have to take.
Target 🎯: 2.4200
💰💵💸XRP/USD "Ripple vs U.S Dollar" Crypto Market Heist Plan (Scalping/Day) is currently experiencing a bullishness,., driven by several key factors. .☝☝☝
📰🗞️Get & Read the Fundamental, Macro, COT Report, On Chain Analysis, Sentimental Outlook, Intermarket Analysis, Future trend targets... go ahead to check 👉👉👉🔗🔗🔗
⚠️Trading Alert : News Releases and Position Management 📰 🗞️ 🚫🚏
As a reminder, news releases can have a significant impact on market prices and volatility. To minimize potential losses and protect your running positions,
we recommend the following:
Avoid taking new trades during news releases
Use trailing stop-loss orders to protect your running positions and lock in profits
💖Supporting our robbery plan 💥Hit the Boost Button💥 will enable us to effortlessly make and steal money 💰💵. Boost the strength of our robbery team. Every day in this market make money with ease by using the Thief Trading Style.🏆💪🤝❤️🎉🚀
I'll see you soon with another heist plan, so stay tuned 🤑🐱👤🤗🤩

XRPPrice has swept the Weekly Lows of last week. Now, we should begin our climb towards $2.36, which was previous weeks high.
We may see a impulse move towards $2.26 mid week, followed by more buying heading into the weekend.
If we fail to break above $2.26 we may see more drawdown towards $2.08 support.
There are plenty of catalyst to propel us towards $2.50+, we should still be accumulating if possible.
Stay diligent, our time is coming!
