XRP If XRP is able to sustain it's price above $1.95 we will begin our climb towards $2.50 quickly.
If we fall below $1.95, our sell off will lead us towards $1.75 at a optimal buying price.
Xrpusdbuy

XRPXRP likely to bounce of the current FVG, heading upward to retest $2.50.
More bullish news is on the horizon, lock in.

XRP🔷 XRP expecting to retest the $2.10 inverse fair value gap very soon.
If we're able to sustain price above $2.10 we will continue moving higher looking towards ATH.
If we fail and move lower, I'm expecting to bounce off the $1.73 price range for more buying.
Lock in 🔒

XRP The bottom is in. We are awaiting the big news to push price higher. It can be in the next few hours, days, weeks or a month. But we will go so much higher.
Lock in.

XRP XRP failed to break through the $2.1597 resistance and is now heading back toward the $2.0216–$1.9000 support zone.
If this support fails to hold, lower lows may be on the horizon.
A bullish reversal requires a breakout above resistance and confirmation above the 200 MA.
🎯 Next targets: $2.4729 and $2.59
📉 Weak volume and rejection from key levels increase bearish pressure.

XRP Bull Flag: The Calm Before the Crypto Storm?XRP is flashing a massive bull flag on the charts—a pattern that’s historically signaled explosive upward moves! After a strong rally (the flagpole), price is consolidating in a tight range (the flag), building tension for a potential breakout. Analysts are eyeing targets from $4.40 to as high as $15 or more if momentum kicks in. With regulatory clarity and growing adoption fueling the fire, could this be the setup for XRP’s next big run? Stay tuned!

XRP(UPDATE)Hello friends
Due to the heavy price drop, you can see that buyers are slowly entering, and now there is a good opportunity to buy in stages and with capital management and move towards the specified goals.
*Trade safely with us*

XRPIf we're able to break this minor resistance we could retest $2.30 towards end of day.
If we fail to break above the resistance we will likely fall too $2.05 which would be a great buying opportunity long-term.
We are near a bullish rally.

XRPWe are currently retesting an Order Block above $2.10 as we head into April.
$2.10 is a very strong support, we may see a liquidity sweep below this OB then begin our climb back up towards $2.30+.
If we want to retest the $3 highs at the end of Feb, we need some big news to come out, either ETF approvals, Trump making a big move with the treasuries, reserves, or X payments. Any positive catalyst of this magnitude made be what we need to get the next leg up started.
Hold your positions and stack when you can. The next move up will be magnificent.

XRP Pounced on by the group! RIPPLE XrpUsd Ready to Go? Now if you NOTE exactly where PRICE was at the EXACT TIME that 🟢SeekingPips🟢 Shared the last XRP CHART.
You can see that was a PERFECT ALIGNMENT of both TIME & PRICE.👌
ℹ️ Many SHORT TERM & INTRADAY TRADERS paid themselves at 🟢SeekingPips🟢 pre defined 🔴RED🔴 level @ 2.4980 for a PAIN FREE TRADE with A GREAT REWARD TO RISK OUTCOME.
🌎 You can also NOTE TWO VERY IMPORTANT THINGS WITH THIS TRADE...
▪︎1) Our ORIGINAL Stop Loss has still been untouched even after the 100% retracement of our original ENTRY.
▪︎2) Now anyone who was not in the group or followed 🟢SeekingPips🟢 original chart share at the time of our entry and instead decided to jump in as price was already moving up would have made a poor choice.❗️
By waiting on the next 240m bar/candle to close you could have theoretically left a limit order at original entry area and would have been easily filled for a STRESS FREE trade so far.🚀🚀🚀
What's the lesson here❓️
Know what you want to see and do not act beforehand.
If you miss your FIRST entry have a PLAN for your SECOND ATTEMPT.
Note the word PLAN.
⚠️ As per 🟢SeekingPips🟢 BIO Without A PLAN it's NOT TRADING But GAMBLING.
🎲

RIPPLE What Next? XRP To Make It's Next Move! XrpUsdT GO or NO? ⚠️ The next 240 minute bar could be key in decrypting what XRP is likely to do next.
ℹ️ The way is clear for it to begin building a BULLISH base from here however, the way 🟢SeekingPips🟢 sees it there still remains a fair amount of liquidity below current price in the form of stop orders and buyers stop losses.❗️
✅️ VOLUME viewed on the LOWER TIMEFRAMES may hold the clues from here.🚀
🟢SeekingPips🟢 pips has this on his RADAR and will be updating his thoughts on this CRYPTO regularly this week.📈

For those of you who bought XRP...I've known about COINBASE:XRPUSD for over a decade now. Time has brought tons of rumors, tons of hype, and tons of mistakes still being made by those new and experienced alike. For those of you holding strong pre $1.00, I commend you. For those of you who are bought high and are now riding the emotional roller coaster, consider these 3 things before you make a decision.
1. We are DIRECTLY in the middle of the range
Over 3 months of consolidation has taken place. With a high of 3.40 and a low of 1.70, this is a range for advanced traders. If you bought around 2.00 or under, Congrats! even though you didn't get in pre $1.00, there are alot of Big buyers that have been scooping up XRP at the 2.00 level.
For those of you that Bought 2.50 and above.
Ask yourself why you purchased XRP?
I ask you; Did you buy XRP to trade? or to invest? No they are not the same thing. Investing is long term, 3-5 years+. Trading is dealing with much shorter time windows, even if you are swing trading, Trading is Trading, and this takes a different skill set and mindset. so if you are investing, be happy that XRP is lower in price. if big money is Buying at 2.00, there is nothing stopping you from doing the same. If you are a beginner trader, consider our last point.
Buy with Buyers, Sell with Sellers
Sounds simple right? Here is something you may not know. Liquidity is what moves markets. If you have 100million that you have to invest for your clients in XRP, do you slap the market button? Absolutely not, in fact, you want to make yourself as small looking as possible. Why? YOU NEED PEOPLE TO SELL INTO YOU. Big firms (unless through dark pools) have algorithms make themselves look as small as possible, whilst accumulating and distributing shares efficiently. At the end of the day, These are the big players that move the markets big.
Do you need to know this? Not necessarily for the technical side, but for your emotions, your psychology? Yes this is important.
Find the buyers and sellers (I have them marked in my chart), and learn to play alongside them. You will get better pricing, feel great about your positions, and know if it goes against you, you can cut the trade off early and reposition.
Hope you enjoyed, and happy Trading!

XRP/USDT:BEST CHANCEhello friends
Due to the price correction, now is a good opportunity to buy in steps.
Note that the best way to buy a ladder is to not suffer a loss if the price changes.
We have specified price targets for you.
We have also specified an important resistance range for you, when the price reaches it, we will give you an update.
*Trade safely with us*

XRP Next Move !... $4 XRPUSD Ripple Just A Matter Of Time? $€£¥This space seems a bit quite now but if you liked XRPUSD / XRPUSDT at $3 what has changed now?
When the hype is around thats the time to be ⚠️ cautious IMO.
When there is little attention of the said market thats when 🟢SeekingPips🟢 likes to get to work.
⚠️This time is NO different⚠️
NOT SURE WHERE THE NEXT LOW WILL FORM❓️
ME NEITHER❗️❕️❗️
🟢 You don't need to know❗️ You just need to HAVE A PLAN ✅️

XRP/USDTHello friends
Due to the recent decline, we have found two good support areas for you, which if reached, can be bought and moved to the specified targets.
*Trade safely with us*

$XRP Soared 2.32% As Franklin Templeton Files for Spot $XRPThe [rice of CRYPTOCAP:XRP Soared 2.32% Amidst 1.5 trillion Franklin Templeton files for spot CRYPTOCAP:XRP ETF with CBOE. In another news, Ripple ( CRYPTOCAP:XRP ) receives approval from Dubai Financial Services Authority to provide crypto payments & services in the UAE.
Despite this fundamentals, CRYPTOCAP:XRP seems undeterred rather moving gradually with a steady momentum as indicated by the Relative Strength Index (RSI) at 48.
For CRYPTOCAP:XRP , the 78.6% Fibonacci retracement point is acting as support, should CRYPTOCAP:XRP break that level, it could lead to extreme selling pressure.
Similarly, a breakout above the 38.2% Fibonacci pivot, could spark a bullish renaissance for CRYPTOCAP:XRP as the RSI is well stipulated for that move.
What Is XRP / XRP Ledger?
Launched in 2012, the XRP Ledger (XRPL) is an open-source, permissionless and decentralized technology. Benefits of the XRP Ledger include its low-cost ($0.0002 to transact), speed (settling transactions in 3-5 seconds), scalability (1,500 transactions per second) and inherently green attributes (carbon-neutral and energy-efficient). The XRP Ledger also features the first decentralized exchange (DEX) and custom tokenization capabilities built into the protocol. Since 2012, the XRP Ledger has been operating reliably, having closed 70 million ledgers.
XRP Price Live Data
The live XRP price today is $2.29 USD with a 24-hour trading volume of $5,726,053,874 USD. XRP is up 5.48% in the last 24 hours, with a live market cap of $132,834,233,937 USD. It has a circulating supply of 58,043,299,826 XRP coins and a max. supply of 100,000,000,000 XRP coins.

Ripple XRP Price Levels Still BULLISH? XRPUSD Buy Long for SP!🌍Just a quick update from 🟢SeekingPips🟢
ℹ️ Note the CLEAN and VERY CLEAR reactions at KEY PRICE LEVELS that SeekingPips identified as EARLY as 21st January 2025
(Please go back amd see the XRP chart shares from that day)
⭐️ By now you know well that I always prefer TIME over PRICE however, we can not utilise one without the other so identifying KEY PRICE LEVELS where we can expect key reactions and potential ENTRY & EXIT signals is KEY TOO.👍
✅️ Again PREPARATION is KEY.
✅️ Have a plan and stick to it like GLUE.
🟢SEEKINGPIPS🟢 opinion remains the same.
🌎BUY the DIPS and DCA then we sit WATCH and ENJOY the ride.

XRP at a Crossroads! Will the Bulls Hold the Line?Yello, Paradisers! Is #XRP gearing up for another breakout, or are we about to see a deeper pullback? The battle at key levels is heating up, and the next move will separate the winners from the losers.
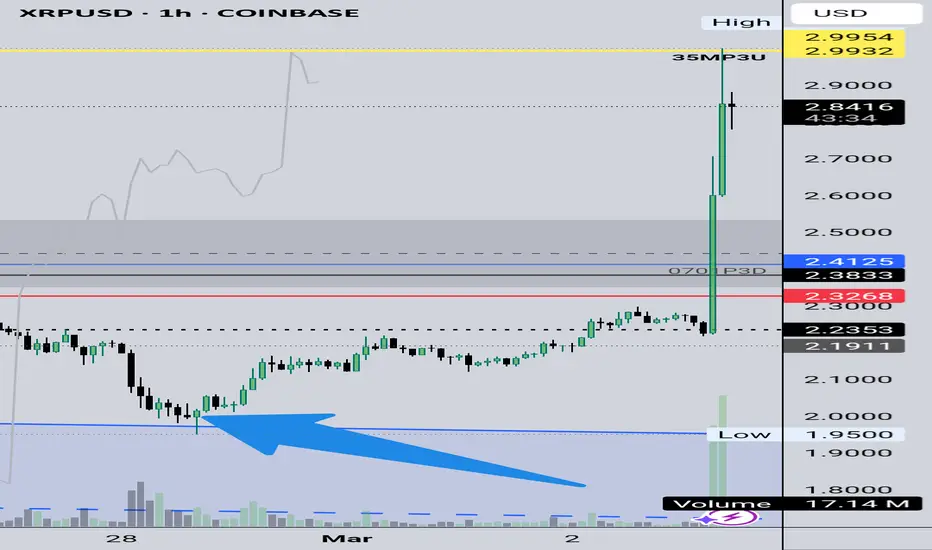
💎#XRPUSDT’s recent hyper pump was triggered by its major support zone at $2.00 – $1.95, where buyers stepped in aggressively. However, the move became unsustainable, leading to a sharp move back lower. Now, XRP is holding above the $2.30 – $2.20 support zone—a critical level that bulls must defend to keep the momentum alive.
💎If buyers maintain control of this support zone at $2.30 to $2.20 over the next few hours, we could see a recovery back toward the $2.70 – $2.80 resistance zone. However, breaking through this level won’t be easy, as XRP still faces key obstacles ahead.
💎The descending resistance, which previously rejected price spikes, remains a major hurdle. A clean breakout above $2.85 with strong volume would confirm real bullish strength and open the doors for a retest of the strong resistance zone at $3.20 – $3.30 levels which is XRP's recent all-time highs and this is the region where sellers are expected to step in aggressively.
Stay patient, Paradisers! The market always rewards discipline. If we see confirmation, we take action. If not, we wait. Trade smart, not fast! 🎖
MyCryptoParadise
iFeel the success 🌴

Xrp to the MOON? SeekingPips Long Buying XRPUSD ALL DAY!⭐️ Now today I have tons of messages asking me about XRP ⭐️
❗️Ladies and gentlemen 🟢SeekingPips🟢 has been long bias for the past 4 years at least and especially long XRPUSD All year on this platform with plenty of before the fact TRADE CALLS .🚀🚀🚀
✅️ Now you know I wanted another dip below the shaded area mentioned last week on Saturday 22 February.
(Go Back & See For Yourself)
✅️ We got what we wanted and even a momentary sub $2 XRP
I hope you were filled on your LIMIT ORDERS.
⚠️ My exact words were "Just for the records tho sub $2 I fill my pockets"
❓️NOW WHAT❔️
🌍It's VERY EASY , knowing that over 90% of so called TRADERS LOOSE MONEY in the markets and ALSO that they ENTER THE MARKET IN A RUSH WITHOUT MUCH OF A PLAN but they will sit in a LOOSING POSITION for far TOO LONG and EVEN CLOSE THEIR POSITION as soon as they have a SLIGHT PROFIT.🌍
ℹ️ Your job can be VERY SIMPLE.
With knowing the above all one has to do to CAPITALISE ON THIS INFORMATION is the EXACT OPPOSITE.
⚠️You DON'T HAVE TO BE A GENIUS to make MONEY in the market but you do have to HAVE A PLAN and ACT ON IT RELIGIOUSLY ⚠️
XRPUSDT Luvly Jubly! XRP can I have some more please Sir? Rippl🚥Weak hand continue to roll over.🚥
🌍I LIKE WHAT I SEE🌎
🟢SeekingPips🟢 is filling his pockets. 💯
🤔 Will we get under $2 again?
We wait and see until then we continue to DCA and also BTFD.👌
❓️Are you on board the Ripple express?🚀

XRP area of interest - If it fails I'd love to buy below !⭐️ XRPUSD hasn't been up to much recently so nothing really to share on it. ⭐️
🟢SeekingPips🟢 remains strictly BULLISH and has been buying up the dips.
ℹ️ I would really like to see a big FU flush before the next move up BUT WHAT I WANT is irrelevant. As traders we have to do what the maket is doing and stick to OUR PLAN.
✅️ Just for the records tho sub $2 I fill my pockets again.

XRP Ripple - Going Higher Now? Swing Divergence with BTCThis is a top down idea from the HTF
M > W > D1 > H4 charts
All the clues of the price action are indicating higher prices on crypto - explanation in video.
One thing I didn't mention is that we also have a weak DXY (Dollar) so that adds to the idea of strength in XXXUSD pairs.
Reasons for choosing XRP over BTC is that XRP created a higher low, indicating more strength than BTC.
Entry on LTF is dependent on a pullback to get a cheaper price.
Entry on HTF is more flexible.
Comment below if you have any questions. I read everything.
Thanks

Xrp What Now? XrpUsd Buy & Hold? Xrpusdt Long for SeekingPips!⭐️🟢SeekingPip🟢s reminds a collector of XRP!⭐️
✅️ Not only holding but actively adding to our CRYPTO holdings.👌
✅️ As always KEEP IT SIMPLE and ALWAYS HAVE A PLAN👍
