XRP: PullbackRipple’s XRP has once again seen a significant pullback since last Monday, raising the possibility that the high of turquoise wave B may already be in. For now, however, we continue to allow room for this corrective move to extend up to resistance at $4.09, before turquoise wave C drives the altcoin lower toward the magenta wave (2) low. With XRP still trading well above the $0.38 support level, the next upward impulse—magenta wave (3)—should then begin to take shape. Alternatively, there is a 33% chance that this bullish move has already started; however, this scenario would only be confirmed by a decisive break above the $4.09 level.
📈 Over 190 precise analyses, clear entry points, and defined Target Zones - that's what we do (for more: look to the right).
Xrpusdforecast

XRP: Support at $2.960 Holds the Bullish SetupFenzoFx—XRP dipped from $3.666 but stabilized near the monthly anchored VWAP at $2.960. It now trades at $3.142 above the ascending trendline.
Immediate resistance lies at $3.332, aligned with the descending trendline. A close above this level may propel XRP to $3.432. Strong buying could extend gains to the recent high of $3.666.
The bullish outlook stands while XRP/USD holds above key support at $2.960. A drop below this level would invalidate the bullish scenario.

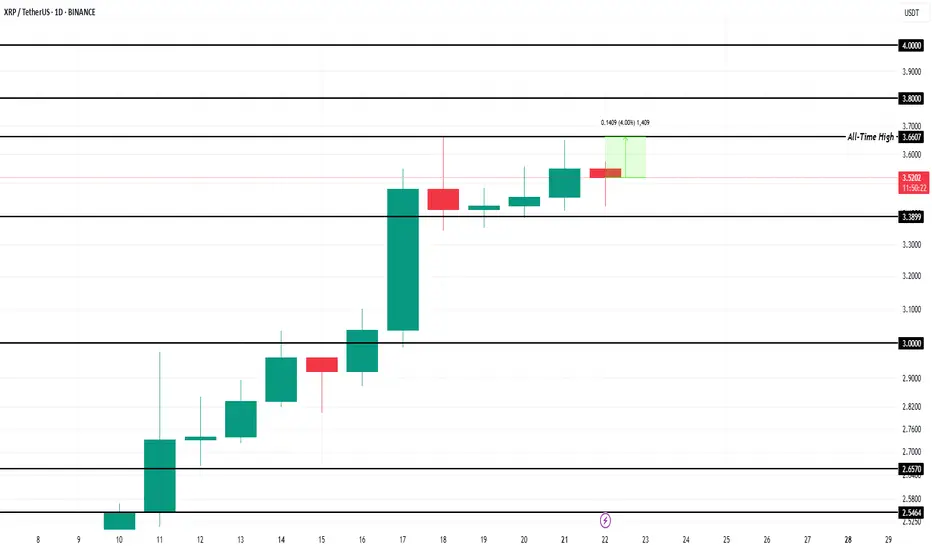
$500 Million XRP Accumulation To Drive 15% Price Rise to ATHBINANCE:XRPUSDT is currently trading at $3.20, which places it 14% away from reaching its ATH of $3.66. The support at $3.38 is crucial, and securing it could lead to further gains.
BINANCE:XRPUSDT has been seeing significant inflows in the past three days. Over 163 million XRP, worth around $519 million , have been accumulated by investors. This buying surge suggests that a wave of optimism is returning to the market, signaling that investors are positioning themselves for a potential price increase.
If BINANCE:XRPUSDT can reclaim support at $3.38 , it will be well-positioned to push past its ATH and reach new highs. This would mark a significant milestone for the altcoin, setting the stage for further price gains.
However, should the investor sentiment shift and selling pressure increase, BINANCE:XRPUSDT could face a decline. If the price falls below $3.00, it could slide to $2.96 or lower , invalidating the bullish thesis.

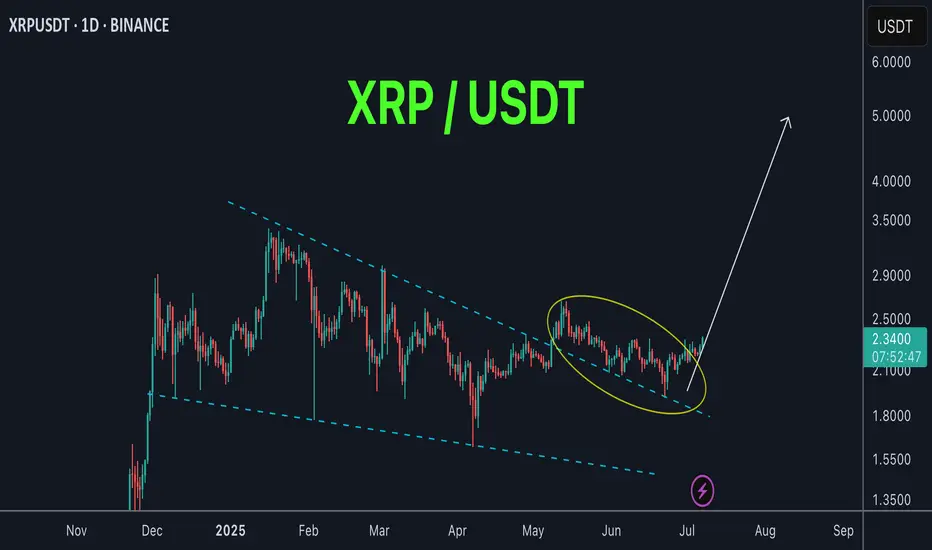
Xrp - This is the bullrun breakout!🔑Xrp ( CRYPTO:XRPUSD ) breaks the triangle now:
🔎Analysis summary:
After the recent bullish break and retest, Xrp managed to already rally another +100%. This is a clear indication that bulls are still totally in control of cryptos and especially Xrp. It all just comes down to the all time breakout, which will then lead to a final parabolic rally.
📝Levels to watch:
$3.0
SwingTraderPhil
SwingTrading.Simplified. | Investing.Simplified. | #LONGTERMVISION

XRP Price Reversal Likely After $2.81 Billion Selling In 7 DaysBINANCE:XRPUSDT is currently trading at $3.48, only 4% away from its all-time high . Over the past week, exchange wallets saw an influx of nearly 450 million XRP, valued at more than $2.81 billion . This spike in supply indicates that holders are moving their assets to sell, usually a bearish indicator in market cycles.
Despite the proximity, BINANCE:XRPUSDT price is showing signs of weakness and is clinging to the $3.38 support level . Without renewed buying interest, this support may not hold much longer.
If investor selling continues, BINANCE:XRPUSDT could fall through $3.38 and test the $3.00 support . A drop to this level would erase the recent gains and confirm a near-term bearish reversal. The loss of $3.00 could signal a longer consolidation phase or deeper correction.
However, if market participants absorb the sold supply and restore demand, BINANCE:XRPUSDT could rebound quickly . In this scenario, the altcoin might surpass $3.66, breach $3.80, and aim for $4.00 . Such a move would invalidate the bearish outlook and set a new all-time high.
XRP new movement soon !XRP / USDT
XRP is on a long retest after breakout of accumulation zone weeks ago
successful retest here will result in strong bullish rally !
Keep an eye on it in the coming days 👀
XRP Cools Near $3.00 Amid Overbought SignalsFenzoFx—XRP remains bullish after piercing $3.00 earlier this week but cooled near resistance. Trading around $2.90, Stochastic (~84) and RSI 14 (80) indicate overbought conditions, suggesting consolidation.
We anticipate a pullback toward $2.66 support before resuming the uptrend. Alternatively, a decisive break above $3.00 would target $3.21 next.

XRP Technical Analysis – Massive Breakout in Play!After months of tight consolidation inside a symmetrical triangle, XRP/USDT has finally broken out with strong bullish momentum on the daily timeframe.
🔹 Chart Pattern: Symmetrical Triangle
🔹 Breakout Confirmation: Daily candle closed above the descending trendline resistance
🔹 Support Zone: ~$2.00 – $2.20 (Held multiple times since April)
🔹 Breakout Level: ~$2.48 – $2.50
🔹 Next Resistance Levels:
▫️ $2.62 – Minor horizontal resistance
▫️ $3.39 – Major resistance from previous highs
▫️ $4.92 – Long-term macro target (measured move from triangle)
🧠 Why does this breakout matter?
✅ Strong Volume: Breakout happened with increased volume – a sign of genuine breakout
✅ Multi-month Base: The longer the consolidation, the stronger the breakout
✅ Support Respect: XRP respected the demand zone repeatedly, showing accumulation
✅ Momentum Building: A clean break could trigger trend-following bots and new buyers

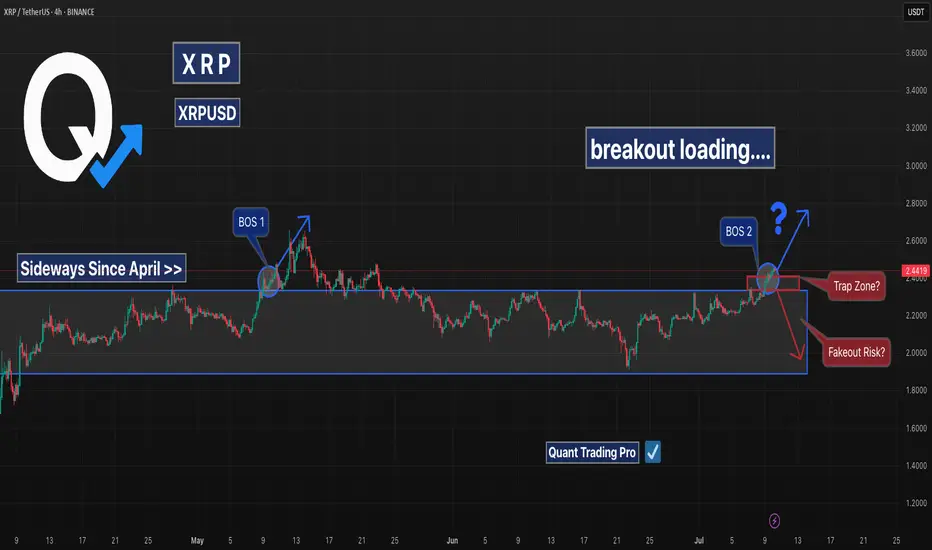
XRP Breakout Loading… or Just Another Trap?XRP has been locked in a sideways range since early April, bouncing between $1.90 and $2.45 for nearly 3 months.
Now, it’s pressing into the top of that range once again — and traders are watching closely for either a confirmed breakout or another fakeout rejection.
📊 Technical Breakdown:
🔹 Sideways Since April: The structure has been consolidative and indecisive.
🔹 BOS 1 + BOS 2: Each break of structure led to temporary rallies — but failed to hold above resistance.
🔹 Trap Zone Identified: ~$2.45–$2.50 has repeatedly acted as a liquidity magnet.
🔹 Fakeout Risk Still Present: Without strong follow-through, this could reverse into the range again.
📈 Breakout Scenario:
• Clean candle close above ~$2.50
• Targets: $2.90 and $3.20
• Look for volume confirmation
📉 Rejection Scenario:
• Wick into resistance + bearish engulfing
• Back to midrange or support zone ~$2.10
XRP: Break Above $2.338 Opens Path to $2.480FenzoFx—Ripple (XRP) eased near weekly highs of $2.338, with Stochastic and RSI 14 signaling overbought conditions. The trend stays bullish above the anchored VWAP or $2.165, but consolidation toward $2.2240 is expected before resuming.
A break above $2.338 would target the next supply zone at $2.480.

XRP .. few weeks before next bull?A new low is possible before Bull run!
it may be huge or one candle ,,
don't take the fractal exactly as you see for every movement

$XRP ALERTCRYPTOCAP:XRP price is pushing toward breakout resistance!
Don't FOMO in yet — confirmation comes above the red zone!
Break and hold above signals bullish continuation
Rejection could lead to a pullback to the demand zone!
Resistance zone: $2.35- $2.63
Support zone: $1.92 - $2.07
Patience brings profits!

XRP Back on the MENU! XRPUSD Ripple next move? XrpUsdtIt's been a while since we looked at this chart.
🌍 SeekingPips 🌎 View remains the same and so we are strictly looking for strategic LONG entry points in
TIME & PRICE. 👌
Yes it's a WEEKLY chart and I understand that many of the trigger happy TRADERS or in some cases GAMBLERS can't stand to look at anything longer than a 30 minute chart BUT really sometimes you really just have to STEP RIGHT BACK to see the BIGGER PICTURE👍
✅️This week's candle CLOSE really has the potential to setup the next few weeks for easy MULTIDAY TRENDING MOVE TRADE SETUPS 👍
ℹ️ Note the price location on what we viewed as a HTF FLAG MANY WEEKS AGO .
Yes it was breached both sides but 🌎SeekingPips🌍 doesn't trade the patterns themselves but the HUMAN PSYCHOLOGY AROUND THESE PATTERNS.🤔
ℹ️ Note where most of the volume has been trading and also note the moves around the extreems of the dead patteren too.💡
In an even higher TIMEFRAME THE FLAG would still be valid and forming the flag itself too.
📊 [ b]CHECKOUT the MONTHLY chart for the example. 📉
Anyway we will see what the next 48 hours🕦 hold but no doubt this one is on our RADAR this week.
✴️ 2.048 to hold otherwise a potential for current low of this year to be tested.
✴️ Alternatively if support starts to form on the 240min chart at current levels last weeks high could expected to be tested
✴️ if so Xrp could easily give a multiday upside trending move.
Now like a NINJA we wait and stalk...
As always ladies and gentlemen whilst Seeking Pips 🌍 SeekingPips 🌎 says
" NO TRIGGER NO TRADE"
& "STICK TO YOUR PLAN"✅️
👍 Have a GREAT WEEK and we will see you soon with an UPDATE...

XRPXRP just created a Inversion FVG on the 1h timeframe, paired with a sweep of the Previous Day Lows, indicates a strong move upwards.
We should see a retest of Previous Day High at $2.36 which may lead to a test of a 4h FVG between $2.38 - $2.40.
If we get any big announcements this weekend, we may see run towards $3 heading into the week.
Have an exit strategy once we have our banana move, it's been a great journey.
LOCK IN.

Is XRP the Next Crypto Rocket?$2,5 Breakout Targets $3.5 or moreI see a clear setup with actionable insights. The chart shows XRP forming a range and deviation at 1.77$, with a recent bullish breakout attempt. Here’s my breakdown:
Technical Analysis
Deviation of the global range points at potential consolidation(blue horizontal line)
Breakout Attempt: A sharp green candle pushed above the $2,36 resistance, but it’s yet to close convincingly above it. The red arrow projecting upward suggests optimism for a move toward $3–$3,5if the breakout holds.
Given today’s date (May 18, 2025, 03:40 PM EEST), this setup aligns with recent crypto market trends. XRP’s price action could be reacting to broader market sentiment, regulatory news, or Ripple-related developments, which have historically driven volatility.
This chart screams opportunity if the breakout holds. However, watch for a false breakout—crypto is notorious for shakeouts. A failure to close above $2,5 could see price retrace to $2,3 or lower. I’d monitor the next 2-3 weeksfor confirmation.

XRPWe are fixing to witness a run to $3 in a hurry.
New outlets, governments, banks, institutions, are all diving into crypto. An ounce of great news for XRP sends us moving up in a HURRY.
Have an exit strategy in place to take profits, and cycle some profits into other assets to continue to build your wealth.
Lock In.

XRPUSDT Bullish Setup – Swing Trade Opportunity Toward $6.00XRP has shown a consistent pattern of strong bullish impulses followed by consolidation zones, and this rhythm has repeated multiple times on the weekly chart—signaling high confidence in pattern continuation.
Let's break it down
🔁 Repetitive Buying + Consolidation Patterns
19 Sep 2022: Strong buying candle triggered a short-term rally, followed by a multi-week consolidation period.
10 July 2023: Similar impulse move occurred—buying strength picked up, and then the price consolidated again.
4 Nov 2024: Most recent and strongest impulse—3 consecutive bullish candles that broke out of long-term descending resistance, confirming structural shift. This was again followed by consolidation—mirroring previous price behavior.
📈 Breakout Confirmation & Trend Structure
Breakout of Descending Trendline (Red): XRP broke out of its long-term bearish trendline decisively, confirming a trend reversal.
Support Zone Holding Firm (1.95 USDT): Price retraced slightly but respected the newly established support above 1.9500.
Consolidation Above Breakout: Post-breakout consolidation is forming a bullish continuation pattern.
Key Technical Levels
Entry Zone (Buy Area): Current zone between $2.10 and $2.50 (ideal accumulation zone for swing traders).
Technical Stop Loss: $1.9500 – key level that has acted as both resistance and now flipped to support.
Take Profit Targets
TP1: $3.4157 – previous resistance and a strong psychological level.
TP2: $6.000 – projected top of current trend channel (green line), aligns with 131.59% upside from current level.
Risk-Reward: Over 5:1 R:R on this setup, extremely favorable for mid-to-long-term swing trades.
Bearish Invalidations
If the price closes significantly below $1.95 on the weekly, the current bullish thesis weakens, and price may retest deeper supports around $1.25 or below. But as long as the structure holds, bulls are in control.
📊 Trade Setup Summary
📥 Entry 2.10 – 2.50
🛑 Stop Loss 1.9500
🎯 Take Profit 1 3.4157
🎯 Take Profit 2 6.0000
⚖️ R:R Ratio 5.32x
The chart tells a powerful story—repeated buying, breakout confirmation, support holds, and continuation setup. XRP is positioning itself for a major move, with $6.00 potentially on the table by the end of 2025.
This is an ideal zone for swing traders and position traders who are comfortable with multi-month holding periods and high R:R setups.

XRP on the Brink: Hold $2.11 or Break to $2.36+? Massive move incoming — if XRP holds $2.11, $2.19 is next. Break that and we could hit $2.36 before the real moonshot. But drop below $2.11? Expect a test of $2.00 before a rebound to $2.30+.
Kris/Mindbloome Exchange
Trade Smarter Live Better

XRP/USD "Ripple vs U.S Dollar" Crypto Heist Plan (Scalping/Day)🌟Hi! Hola! Ola! Bonjour! Hallo! Marhaba!🌟
Dear Money Makers & Robbers, 🤑 💰💸✈️
Based on 🔥Thief Trading style technical and fundamental analysis🔥, here is our master plan to heist the XRP/USD "Ripple vs U.S Dollar" Crypto Market. Please adhere to the strategy I've outlined in the chart, which emphasizes long entry. Our aim is the high-risk Red Zone. Risky level, overbought market, consolidation, trend reversal, trap at the level where traders and bearish robbers are stronger. 🏆💸"Take profit and treat yourself, traders. You deserve it!💪🏆🎉
Entry 📈 : "The vault is wide open! Swipe the Bullish loot at any price - the heist is on!
however I advise to Place buy limit orders within a 15 or 30 minute timeframe nearest or swing low or high level for pullback entries.
Stop Loss 🛑:
📍 Thief SL placed at the recent/swing low level Using the 1H timeframe (2.600) Day trade basis.
📍 SL is based on your risk of the trade, lot size and how many multiple orders you have to take.
Target 🎯: 2.4200
💰💵💸XRP/USD "Ripple vs U.S Dollar" Crypto Market Heist Plan (Scalping/Day) is currently experiencing a bullishness,., driven by several key factors. .☝☝☝
📰🗞️Get & Read the Fundamental, Macro, COT Report, On Chain Analysis, Sentimental Outlook, Intermarket Analysis, Future trend targets... go ahead to check 👉👉👉🔗🔗🔗
⚠️Trading Alert : News Releases and Position Management 📰 🗞️ 🚫🚏
As a reminder, news releases can have a significant impact on market prices and volatility. To minimize potential losses and protect your running positions,
we recommend the following:
Avoid taking new trades during news releases
Use trailing stop-loss orders to protect your running positions and lock in profits
💖Supporting our robbery plan 💥Hit the Boost Button💥 will enable us to effortlessly make and steal money 💰💵. Boost the strength of our robbery team. Every day in this market make money with ease by using the Thief Trading Style.🏆💪🤝❤️🎉🚀
I'll see you soon with another heist plan, so stay tuned 🤑🐱👤🤗🤩

XRPPrice has swept the Weekly Lows of last week. Now, we should begin our climb towards $2.36, which was previous weeks high.
We may see a impulse move towards $2.26 mid week, followed by more buying heading into the weekend.
If we fail to break above $2.26 we may see more drawdown towards $2.08 support.
There are plenty of catalyst to propel us towards $2.50+, we should still be accumulating if possible.
Stay diligent, our time is coming!

XRP another possible breakout soon XRP / USDT
Price has been accumulating in perfect falling wedge since December
A breakout here could make a big rally
Keep an eye

Crypto XRPUSD Bear Bull Zone! What is Ripple Xrp next Big move? 🌎 Crypto XRPUSD Bear Bull Zone! What is Ripple Xrp next Big move?
🟢SeekingPips🟢 Says...
"when levels are as clean as this we can always use one of our intermediate TIMEFRAMES".
In todays case that task falls onto the 📉 120 MINUTE CHART📈
The GREY ZONE is our BIAS going forward for at least the next 48 HOURS.
Therefore 🟢 SeekingPips 🟢 is strictly BULLISH ABOVE & BEARISH BELOW the GREY ZONE.
🚥 SIMPLICITY is a KEY ingredient to having LONGEVITY in the FINANCIAL MARKETS 🚥

XRPOUR TIME IS GETTING CLOSER....
Paul Atkins is sworn in as SEC Chairman
Trump Media finalizes partnership with Crypto.com to launch ETFs
We will be retesting $2.50 very soon, and I'm expecting to go even higher if the positive news keeps rolling out.
