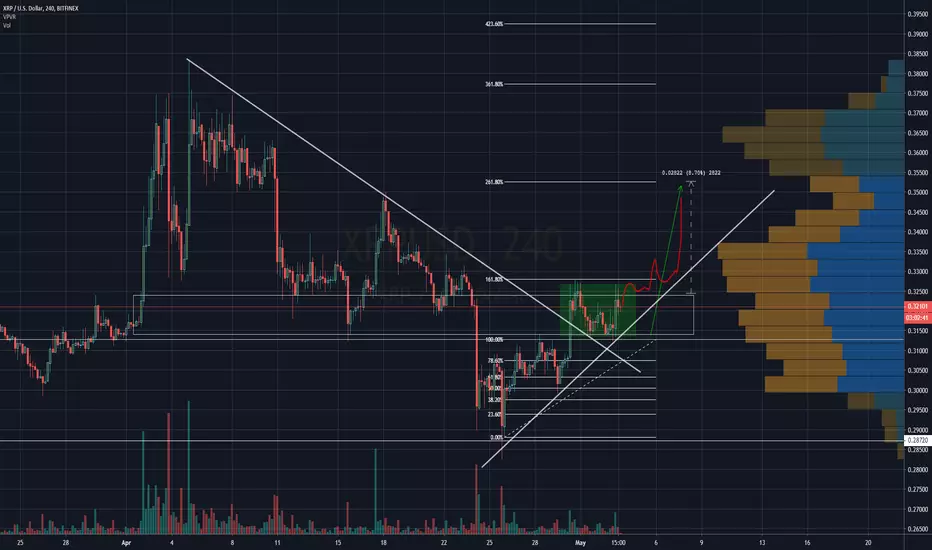
XRP USD : Buying opportunity Once BTC bottoms out!Hello guys,
Another daily update, this time on one of the top cap altcoins XRP.
It doesnt matter how strong the support is laid for any altcoin, as long as BTC is falling all supports for
altcoins are negated.
Best buy zone is pointed out in chart, which I thing must correspond to BTC bottom.
Also checkout my previous ideas:
Follow me for more signals
Cheers!
Xrpusdforecast

XRPUSD - RIPPLE - breakup comingFREE ANALYSIS ON #USDJPY
Welcome to SiriusTrading (managed by Segunby), Check out my Free analysis on Forex and Crypto. Follow me for regular Analysis and don't forget to LIKE, LIKE, LIIIKKKEEE :)

#XRPUSD #ripple The ideal time to buy...A short look at the graph above can be understood that this is the ideal time to enter the Buy position on the Ripple for those who have not yet bought for two reasons:
1. The most serious support we have had so far
2.Stochastic in the buying range
Target: 0.36

XRPUSD reversed from resistance, potential drop!
XRPUSD reversed off its resistance at 0.32611 where it could potentially drop further to 0.28226.
Trading CFDs on margin carries high risk.
Losses can exceed the initial investment so please ensure you fully
understand the risks.


Negative trend, again? #XRPUSD #RippleIt is important that the daily candle finishes above the moving average 200 (the yellow line in the graph above)
The interesting and negative thing about this case is that the Ripple did not rise as Bitcoin rose but on the other hand it is falling because Bitcoin is falling.
The Ripple dropped below the Ichimoku cloud which is a bearish sign.
Target: 0.29

XRPUSD approaching support, potential for a bounce!
XRPUSD is expected to drop to 1st support at 0.32787 where it could potentially react off and up to 1st resistance at 0.37053.
Trading CFDs on margin carries high risk.
Losses can exceed the initial investment so please ensure you fully
understand the risks.

XRPUSD bounced from support, potential for a further rise!
XRPUSD bounced off its support at 0.37010 where it could potentially rise further to 0.44182.
Trading CFDs on margin carries high risk.
Losses can exceed the initial investment so please ensure you fully
understand the risks.

XRPUSD bounced from support, potential for a further rise!
XRPUSD bounced off its support at 0.37010 where it could potentially rise further to 0.44182.
Trading CFDs on margin carries high risk.
Losses can exceed the initial investment so please ensure you fully
understand the risks.

XRP Daily BULL FLAG Looking for Channel Breakout!!!XRP has a Daily Bull Flag.
Looking for channel trading to touch 0.50 USD
and next channel breakout out up to 0.60 USD
Then we see further.

XRPUSD Long OpportunityHi guys its Brian here.
XRPUSD is currently sitting right at the support of the 200 EMA which has proved to be a solid support where price has previously bounced off it couple of times.
If XRPUSD bounces off the support, it is likely to continue upward within the yellow range zone. If 200 EMA support doesn't hold then the long is invalidated and stop loss should be placed slightly below the support. The downward momentum currently is pretty strong so don't try to catch a falling knife. May want to enter after price bounces off the support to be safe.
www.brianchai.com
Free Trading Group

Ripple (XRP/USD), Buy after fake broke of mirror levelI'll open buy after fake broke of mirror level 0.37000 because:
- There will be an accumulation of volumes near such number.
- Potential profit will be in 3...5 times bigger than risk.

XRPUSD approaching support, potential for a bounce!
XRPUSD is expected to drop to 1st support at 0.37010 where it could potentially react off and up to 1st resistance at 0.44182.
Trading CFDs on margin carries high risk.
Losses can exceed the initial investment so please ensure you fully
understand the risks.

Ripple approaching support, potential for a bounce!Ripple is expected to drop to 1st support at 0.37010 where it could potentially react off and up to 1st resistance at 0.44182.
Trading CFDs on margin carries high risk.
Losses can exceed the initial investment so please ensure you fully
understand the risks.

XRPUSD approaching support, potential for a bounce!XRPUSD is expected to drop to 1st support at 0.37010 where it could potentially react off and up to 1st resistance at 0.43924.
Trading CFDs on margin carries high risk.
Losses can exceed the initial investment so please ensure you fully
understand the risks.

XRPUSD bounced from support, potential for a further rise!XRPUSD bounced off its support at 0.44698 where it could potentially rise further to its 0.53229.
Trading CFDs on margin carries high risk.
Losses can exceed the initial investment so please ensure you fully
understand the risks.

XRPUSD IDEAXRPUSD
LOOKIG AT A TREND RESPECT WHEN WE SEE THE 0.44136 GET HIT.
WE DO HAVE A SUPPORT ZONE AROUND THE 0.44136-0.47445 AREAS.
SO WE ARE POSSIBLY LOOKING FOR THE PUSH UP WITH THE RESPECT OF THIS TREND AND SUPPORT LEVELS.
TARGET 1: 0.47445
TARGET 2: 0.51517
TARGET 3: 0.55482
ONCE WE GET A CLEAR BREAK OF TARGET 2 WE WILL MOST LIKELY SEE THIS KEEP RISING UP FOR A BIT LONGER.
**PROPER RISK MANAGEMENT NEEDED**
**PAST CHARTS DO NOT GUARANTEE FUTURE CHARTS TO GO AS PLANNED**

XRPUSD approaching support, potential for a bounce!XRPUSD is approaching its 1st support at 0.44698 where it could potentially bounce to its resistance at 1st resistance at 0.50978.
Disclaimer:
Trading CFDs on margin carries high risk.
Losses can exceed the initial investment so please ensure you fully
understand the risks.


If you hold a Buy position Do not go into this review-XRPUSDAs you can see by looking at the graph above, the price of the Ripple fails to breach the resistance that is on the moving average line 200 and moreover, each time the price faces the linen, the price fall to the starting price at 0.2866.
Because the price is not far from the resistance our recommendation will be selling, As long as the price remains within the range 0.2866 and 0.3405 will be used the technique- Buy near support and sell close to resistance.
Sell Ripple (XRP/USD).
Entry price: 0.3270
Take profit: 0.2900
Stop loss: 0.3450

XRP UPTREND TO 80 cents XRP/USD LONG XRP/BTC LONGHi guys.
Welcome to this update on the most accurate XRP analysis on TradingView :)
This is a follow up on my previous idea, which forecasted an XRP drop of 30% in the coming days, see previous idea at :
Now, we have pretty much different situation, completely opposite, since of long XRP consolidation and previous volatility shown as it peaked from 27 cents to 80 and bled out.
Ripple should make his next uptrend to resistance level 8800-10.000 sats which should equate to XRP's output 80 cents at btc worth 5000+$
There will be enough accumulation for big price spike in short time period.
* Price buy in range current one.
* Target over 0.80$ (probably going over 0.82, even higher, but even " conservative approach as this one is bringing us Return on investment 242% price change (if holding from 33 cents to 80 c ents (depeding how "far" will you go% when cashing out your position if bought under 0, 335 $)
* Time period 7 days
So far, XRP has dropped massivly, as fell from 11700 sats when spiked from 27-80 cents, but, since then consolidating without making any significant change in USD output.
If you liked an idea, please remember to press the LIKE button, it will motivate me to continue posting and offering you the best possible advice.
In this post I will be brief, because there is not too much to add to the analysis posted on the 5th October.
Here are some interesting facts:
* Marketcap of XRP on the 5th October was 21.2 billion US dollars
*At the time of posting, the XRP price was 0.52 USD.
*In the meantime, XRP has deflated by more than 12% (in 5 days ).
*Current XRP marketcap is 14 billion US dollars (compared to previous 24 billions )
*Current XRP price is 0.33 USD which is consdidered very good entry price for this range of BTC
*XRP has tendency to go over 1,20$, but let's not be greedy, 142% profit is superb.
IMPORTANT:
XRP is generally bullish .
Daily RSI indicates further upward momentum.
Next uptrend levels would be (0.41$, 0.44$, 0.48$, 0.55$ and eventualy 0.80$)
Most likely we will see further strong push on XRP (as per chart decribed).
I would recommend rebuy on XRP (you saw yourself previous scenario during Bitcoin deterioration from 18th to 22.nd of December, XRP MADE BULLRUN, UPTRENDING MASSIVLY TO 20.000 sats.
I've mentioned that in my idea which was posted 5 days before Bitcoin drop from ALL TIME HIGH in which one is suggested that despite deterioration of Bitcoin, XRP made it, so you could benefit from it even more (if cashing out as per TA posted) and suggestion given at IDEA:
Good luck and remember to follow me to receive the latest updates instantly.
If you like my idea, LIKE it with a button :)
Thanks for reading.

#XRPUSD Will succeed in the mission?For eight months, XRP/USD has been trying to break the resistance which is where the line of the Moving average 200 with no success, as you can see in the graph above, There have been 3 failed attempts in the past and some of the time the Ripple even rose slightly above the moving average 200 but it did not last, In the past two days the Ripple has made a big rally and almost touched the moving average 200 but it soon fell again (Reinforces our idea of resistance strength).
Our recommendation is to buy Rippel as long as we are above the average line moving 100 (above the price 0.3260) which is the purple line in the above graph.
Buy Rippel: 0.3460
Take profit: 0.3724
Take profit 2: 0.4100
Stop Loss: 0.3210
