XRP/USD "Ripple vs US Dollar" Crypto Market Bearish Heist Plan🌟Hi! Hola! Ola! Bonjour! Hallo!🌟
Dear Money Makers & Robbers, 🤑 💰
Based on 🔥Thief Trading style technical and fundamental analysis🔥, here is our master plan to heist the XRP/USD "Ripple vs US Dollar" Crypto market. Please adhere to the strategy I've outlined in the chart, which emphasizes short entry. Our aim is the high-risk Green Zone. Risky level, oversold market, consolidation, trend reversal, trap at the level where traders and bullish robbers are stronger. 👀 Be wealthy and safe trade.💪🏆🎉
Entry 📉 : Traders & Thieves with New Entry A bull trade can be initiated at any price level.
however I advise placing sell limit orders within a 15 or 30 minute timeframe. Entry from the most recent or closest high level should be in retest.
Stop Loss 🛑: Using the 2h period, the recent / nearest high level
Goal 🎯: 2.55000 (OR) Before escape in the market
Scalpers, take note : only scalp on the Short side. If you have a lot of money, you can go straight away; if not, you can join swing traders and carry out the robbery plan. Use trailing SL to safeguard your money 💰.
Fundamental Outlook 📰🗞️
The XRP/USD (Ripple vs U.S Dollar) market is expected to move in a bearish direction, driven by several key factors.
🟢Fundamental Analysis
Lack of Adoption: Despite Ripple's efforts, XRP's adoption as a payment solution has been slow, leading to decreased demand.
Increased Competition: Other cryptocurrencies, such as Stellar (XLM) and Bitcoin (BTC), are gaining traction as payment solutions, increasing competition for XRP.
Regulatory Uncertainty: The ongoing SEC lawsuit and regulatory uncertainty in other countries have created a negative environment for XRP.
🟡Macro Analysis
Cryptocurrency Market Downturn: The overall cryptocurrency market has been experiencing a downturn, with many assets losing value.
Global Economic Uncertainty: Economic uncertainty, trade tensions, and geopolitical risks have led to increased market volatility, negatively impacting XRP.
Inflation and Interest Rates: Rising inflation and interest rates in some countries have decreased the attractiveness of cryptocurrencies like XRP.
🔵Market Sentiment
Institutional Investors: Institutional investors have been reducing their XRP holdings, contributing to the bearish sentiment.
Retail Traders: Retail traders are increasingly bearish on XRP, with many expecting further price declines.
📌Sentiment Analysis
- Bearish Sentiment: 62% of traders and investors are bearish on XRP/USD, expecting a price drop.
- Bullish Sentiment: 26% of traders and investors are bullish on XRP/USD, expecting a price increase.
- Neutral Sentiment: 12% of traders and investors are neutral on XRP/USD, expecting no significant price movement.
📌Retail Trader Sentiment
- Long Positions: 42% of retail traders have long positions on XRP/USD.
- Short Positions: 58% of retail traders have short positions on XRP/USD.
📌Institutional Investor Sentiment
- Bearish Sentiment: 70% of institutional investors are bearish on XRP/USD.
- Bullish Sentiment: 20% of institutional investors are bullish on XRP/USD.
- Neutral Sentiment: 10% of institutional investors are neutral on XRP/USD.
Please note that sentiment analysis can change rapidly and may not always reflect the actual market performance. These percentages are based on current market data and may not reflect future market movements.
🟣Latest and Upcoming Events
SEC v. Ripple Lawsuit: The ongoing lawsuit has created uncertainty and negatively impacted XRP's price.
Ripple's Q4 2022 Earnings Report: The report showed decreased revenue and customer growth, contributing to the bearish sentiment.
Upcoming Regulatory Decisions: Regulatory decisions in the US and other countries may further impact XRP's price.
Trading Alert⚠️ : News Releases and Position Management 📰 🗞️ 🚫🚏
As a reminder, news releases can have a significant impact on market prices and volatility. To minimize potential losses and protect your running positions,
we recommend the following:
Avoid taking new trades during news releases
Use trailing stop-loss orders to protect your running positions and lock in profits
🚨Please note that this is a general analysis and not personalized investment advice. It's essential to consider your own risk tolerance and market analysis before making any investment decisions.
🚨Keep in mind that these factors can change rapidly, and it's essential to stay up-to-date with market developments and adjust your analysis accordingly.
💖Supporting our robbery plan will enable us to effortlessly make and steal money 💰💵 Tell your friends, Colleagues and family to follow, like, and share. Boost the strength of our robbery team. Every day in this market make money with ease by using the Thief Trading Style.🏆💪🤝❤️🎉🚀
I'll see you soon with another heist plan, so stay tuned 🫂
Xrpusdforecast

XRPUSD Still Bullish? SeekingPips XRP Ripple Long Term BUY ONLYIs XRP still a BUY?
🟢SeekingPips🟢 says keep it SIMPLE.
✅️If one was accumulating XRP Ripple for the LONG TERM and liked it at $3 why do you not like it NOW?✅️
ℹ️ Like I said before EVERYONE WAITS for the PULLBACK but when it turns up TRADERS/INVESTORS get SCARED to enter at these LOWER PRICES and some EVEN go SHORT and TRADE AGAINST their OWN BIAS.
💡It is a strange phenomenon but its VERY TRUE.
Do what the 1% do and you will be OK.

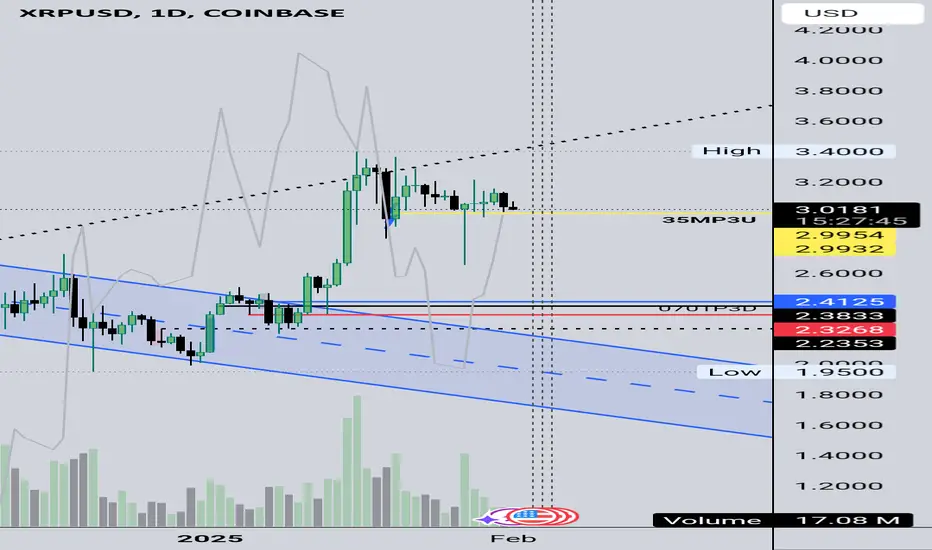
XRP Breaks Out of Downtrend Is a Big Rally About to Begin ?XRP is currently trading around 2.42 and has recently broken out of a descending channel formation. This breakout suggests a potential shift in momentum from bearish to bullish. The price is now consolidating just above the trendline, indicating that buyers are stepping in to support this level.
The descending channel was characterized by consistent lower highs and lower lows. However, the breakout above the upper boundary of the channel signals that the selling pressure may be weakening. If the price holds above this level, further upside movement is expected.
A key support level is now established around 2.40 to 2.42, which was previously resistance. If the price stays above this zone, the bullish case strengthens. Immediate resistance is found around 2.50 to 2.55, where price has faced rejection before. A decisive break above this area would confirm further upside movement.
Volume analysis shows that trading activity is still relatively low, which is common during consolidation phases. A strong increase in volume above 2.45 would provide additional confirmation of bullish strength. Monitoring this volume breakout is essential for validating the move.
Momentum indicators such as the RSI should also be observed. If RSI moves above 55 to 60, it would indicate growing buying pressure. A hidden bullish divergence, if present, would add further confidence to the breakout.
The first target for this breakout is 2.50 to 2.55, where resistance is expected. If price gains strength beyond this zone, the second target would be 2.65 to 2.70. These levels mark potential areas where price could face selling pressure or profit-taking.
To manage risk, a stop-loss should be placed below 2.38 to 2.40 to avoid potential fakeouts. If price falls back below this support, the breakout could be invalidated, leading to a potential retest of lower levels.
XRP is at a crucial turning point, with signs of bullish momentum building. If the price sustains above the breakout zone and breaks through 2.45 to 2.48 with strong volume, a larger upward move could follow. Traders should remain cautious but keep an eye on price action for confirmation of the next trend direction.

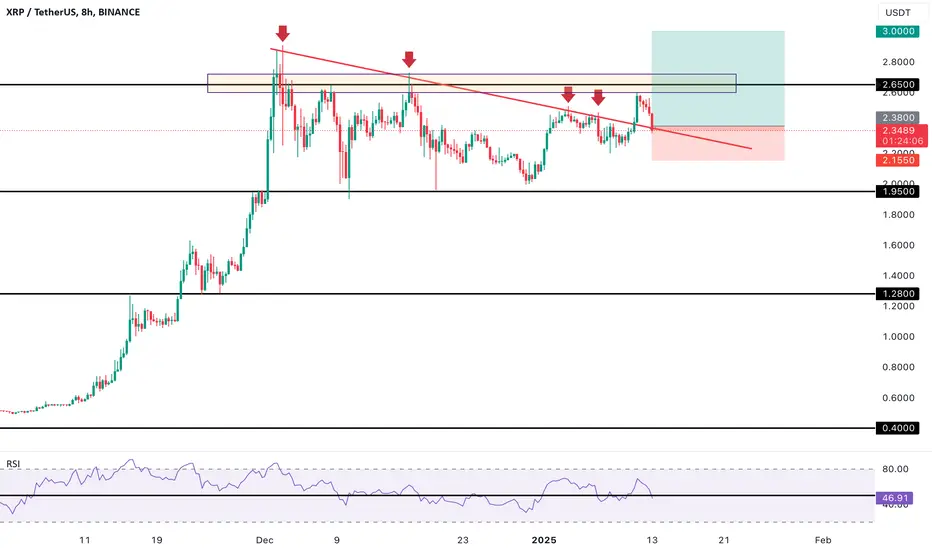
XRP going to the $2.20s??- A 4-hour SIBI FVG has been established between $2.59–$2.56, which could be a strong resistance to keep prices from climbing. There is also a 1-hour SIBI within that area which gives me more of an indication for resistance.
- If the $2.20s range is to be reached, the first price point to monitor would be $2.4873. If price does not hold and falls below, that liquidity is taken. We will retrace slightly up and then look for the next price, which is $2.4695.
- If there is no support at that price point, the next price of interest will be at $2.4194. At this point, if the liquidity is swept, due to the liquidity void below, $2.28 is very possible.
- Going back to the last big liquidity sweep which was yesterday, price dropped about 2%. A sweep at $2.41 could have a similar effect. Although to reach my estimated price, it would need to be about a 3% drop.
- Over-Projecting: The chart gives me a decent probability of reaching $2.28, but even if it does, I think I will be holding on buying. My true target is the sub-$2.20s and maybe the low $2.00s range. However, we may never see that price again.
- What are you seeing?

XRP, How Low Can You Go?XRP is currently experiencing a downward trend across both 4-hour and 1-hour timeframes. The key level to watch is $3.00, which needs to establish as support to reverse the current bearish trend.
XRP is currently in a downtrend in both 4-hour and 1-hour timeframes.
To break the trend, price needs to find support at $3.00.
A 1-hour liquidity zone exists between $2.948 and $2.9244. Price should fill this zone. Price can get there if it's rejected at $3.00.
There is a 4-hour Fair Value Gap ($2.85–$2.83) that should be taken into consideration.
If the 4HR FVG is hit, it needs to retrace to $2.86ish and hold with support. If it does not find support in the FVG, price could be headed to $2.78ish.
If support is not found there at $2.78, a 1-hour Liquidity Zone now plays a factor. Price could visit mid-to-low $2.60s.
If it does hit $2.60s, I believe it will find support and start to rebound back to $3.00.
Just my analysis. What do you think is going to happen? Would love to get other perspectives and feed back!😊😊

XRP RIPPLE What Next? XRPUSD SeekingPips is Still LONG BUY only ✅️ As we enter a new month it's no secret that 🟢SeekingPips🟢 remains with a LONG ONLY BIAS.
🌎 PRICE ACTION has given no reason to consider that the ⭐️ DAILY CHART FLAG BREAKOUT ⭐️ was a dud and so we are waiting for at least a duplicate of the FLAG POLE length to be reached from the flag BREAKOUT POINT.
⭐️ Like What You See Here? Feel Free To Boost, Join & Comment👍
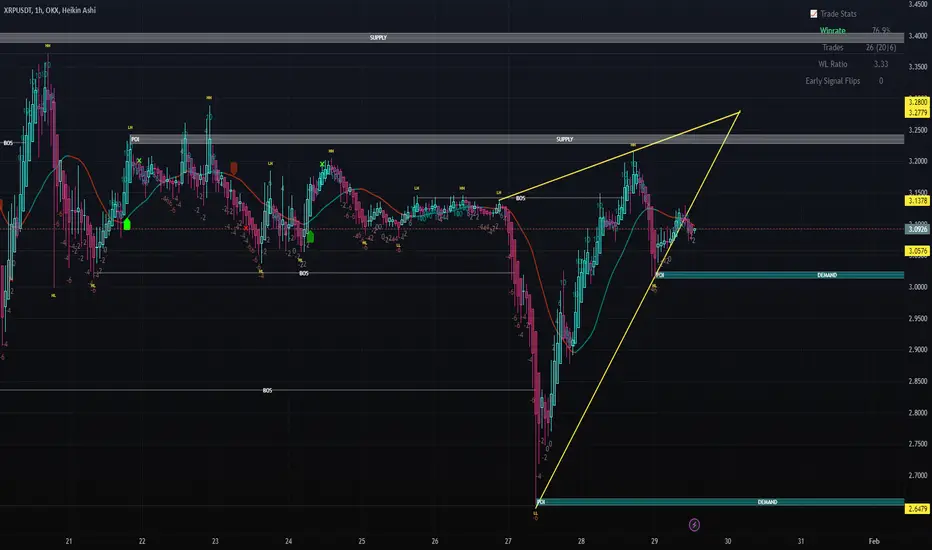
Updated XRP/USDT 1H Chart Analysis – Next 24 Hours OutlookKey Observations:
Rising Wedge Breakdown Risk (Bearish Bias)
XRP is still within a rising wedge, a bearish pattern that often leads to a breakdown.
Price is testing the lower trendline, indicating a crucial decision point.
Supply & Demand Zones:
Supply Zone (Resistance): 3.28 - 3.13 (Price struggled to break above)
Demand Zone (Support): 3.03 - 2.88 (Price approaching this area)
Lower Demand: 2.65, a strong historical level.
Support & Resistance Levels:
Immediate Resistance: 3.09 - 3.13
Immediate Support: 3.03 - 3.05
Next Major Support: 2.88, aligning with demand.
Break of Structure (BOS) & Price Action:
There is a break of structure (BOS) to the downside, indicating potential trend reversal.
If the wedge breaks down, XRP may move lower.
Potential Next Move (24H Forecast)
Bearish Scenario (Higher Probability, ~70%)
A break below 3.03 could send XRP to 2.88
If bearish momentum continues, 2.65 (lower demand zone) becomes a possible target.
Bullish Scenario (Lower Probability, ~30%)
If XRP holds 3.03, a bounce back to 3.09 - 3.13 is possible.
A break above 3.13 could push toward the 3.28 supply zone.
Final Conclusion:
Bearish Bias – XRP is more likely to break down and test 2.88 soon. If buyers don’t step in, 2.65 is the next key level.
XRP's Next Move: Targeting 3.7-3.8 or Plummeting to 2.30?If XRP breaks 3.14, we aim for 3.21, 3.38, then possibly 3.7-3.8. But, if it drops below 2.90, watch out for 2.50 and then 2.30.
If this analysis helped please boost, like, share and comment below much appreciated
Kris/ Mindbloome Exchange
Trade Smarter Live Better

XRP’s Next Move: Can It Reach $6.50?Good morning, trading family!
XRP is at a key point right now. If it drops below $2.84, we could see it fall to the $2.70–$2.60 range before bouncing back. On the flip side, if it pushes up from $3.30, we might see it climb to $3.80—and from there, $6.50 could be in sight.
It’s going to be an exciting move either way, so stay sharp!
If this resonates, feel free to comment, like, or share. Let’s trade smarter and live better!
Kris/Mindbloome Exchange
Trade What You See

XRP Ideaxrp is forming an ascending channel on H4 AND H8 timeframe so we're waiting or a new touch on the red trendline
here w have a valid ascending trendline that got broken so we enter a short (sell) trade
Follow us or more ideas and updates

XRP Big Picture Grinding HIGHER? XRPUSDT Buy Long only for Us! XSeeking Pips likes XRP HIGHER STILL!
Yes price has stalled somewhat but ✅️HIGHER TIMEFRAMES still call for $4 xrp MINIMUM TARGET in our opinion.
As Stated on our shared analysis last week on 15/01/25 🟢SeekingPips🟢 thinks below $5 XRPUSD REMAINS A BARGAIN as a LONG TERM HOLD.👌
Daily Chart BULL FLAG remains in play and SeekingPips continues to see BULLISH REACTIONS on our LOWER timeframe CHARTS and PRICE LEVELS we have identified and shared until now.
🔴 SUBSCRIBE NOW🔴 & Receive Our Latest Chart Analysis...

SeekingPips XRP levels like magic! XRPUSD Ripple Next Move?✅️Another example of picture perfect levels from 🟢SeekingPips🟢.
Like SUBSCRIBE & Boost Our Posts now and stay in the know!

Trump's ''idea'' to create XRP reserve? XRP could play a key role as U.S. President-elect Donald Trump considers creating a national digital asset reserve. The development was reported today by The New York Post, revealing that Trump is open to establishing an America-first strategic reserve that would prioritize U.S.-developed cryptocurrencies over offshore assets.
Bla bla bla, again...

Xrp BUY XRPUSD LONG Did You TAKE IT? SEEKINGPIPS Gave It On A PThis mornings trigger was very easy a clear did you get involved?
🟢Trading should be just like that
"if X then this if Y then that"
🟢Keep it SIMPLE thats how you make trading easier.
✅️ BOOST, LIKE & FOLLOW SeekingPips NOW

XRP 4400% @ 10x LevXRP (RIPPLE) Massive Long Trade Caught with 4400%+ open P&L (running trade)
This XRP long trade has been one of the biggest winner so far from 2024 and 2025.
Was a bit skeptical taking the trade at 10X leverage, I usually do 5x
Took a small trade of $500 which is currently at $22k odd open P&L
Let me tell you, XRP is still looking super bullish, the steam isnt over.
So, I am gonna stick around and see how it goes, or wait for the reversal on the Risological Options Trading Indicator that I have used to catch this MASSIVE trade!

XRP Longs ONLY XRPUSD BUYS - Daily Bull Flag Still Good?🟢You know by now SeekingPips is looking for any opportunities to add to our XRP holdings.
🟡Yellow line is current line in the sand.
Needs to hold $3 otherwise an equal move down on this timeframe still leaves the Daily Bull Flag Valid.📈
📉LIKE, BOOST & SUBSCRIBE NOW 👍

XRP EXPLOSION XRPUSD SeekingPips Magic! Perfect Time & Price !!!
Did you take your fill?
If not why not?
🟢SeekingPips will give you the heads up but you have to chuck your own net in with you own risk management.
👍SeekingPips is not a signal service BUT when the PICKING IS RIGHT I always like to share 😉
🌍SUBSCRIPTION NOW TO SeekingPips FOR THE NEXT SUPER CHART🌎


XRP BREAKOUT SET UPXRP moon time
Ripple Labs will leverage Chainlink’s decentralized oracle network to provide tamper-proof and accurate pricing data for its RLUSD stable coin across Ethereum DeFi markets
Take Profit 1: $2.70
Take Profit 2: $2.85
Take Profit 3: $3.00
Take Profit 4: $3.30

$4 XRP Just A Matter Of Time? XRPUSD Higher Time Frames Are Key!XRPUSDT Are you in?
$4 XRPUSD looks inevitable, the flag pole duplicated on the weekly chart gives a clear an in SeekingPips opinion an obvious next major upside target.
Don't be that guy or girls who in later years says I would have should have could have.
SeekingPips still says any price sub $5 will still be a bargain when we look back at todays prices in 5-10 years time.

XRP IdeaXRP has formed a valid descending trendline and broke the last touch of the trendline
Now its retesting it so we’re entering a buy position
GOOD Luck family
Follow us for more idea and analysis
XRPUSD - 240 min more detailedBla bla bla
gains bullish momentum again.
5. Current Price:
The current price is 2.4063 USDT, slightly below the resistance level of 2.4303 USDT. Breaking above this resistance could pave the way for a test of 2.5121 USDT.
6. Potential Scenarios:
Bullish Scenario:

XRPUSD Weekly & Daily Charts Are Key XRP RIPPLE this WEEKEND...🟢Regardless of your LONG or SHORT term bias or position the higher timeframes will be key in any decision going forward.
🟢As we come into the end of the week tomorrow will mark the first full trading week of 2025 bringing W1 to a close.
🟢Today's D1 close will be key also.
Has price finally broken out od the DAILY CHART BULL FLAG?
ℹ️Remember stick to your own plan, at the end of the day that is the obly thingvthat matters.
Have a GREAT WEEKEND!✌️
