Umm PRICE rejecting D1 FlagYaaaawn.
This D1 Flag says hurry up and wait.
Looks like price might want to fill in last weeks rally.
My indicators say lets bust up some weak hands.
A revisit below the flag mid point I would add a bit my holdings.
REMEMBER Being wrong is FINE staying WRONG is NOT.
Xrpusdforecast

XRP To the Mooòon? The squeeze is on!XRP looks ready to rip!
Fasten your seatbelts kids.
The blue shaded area is the daily chart flag sharted a few days ago on here. There really isn't much room for the daily chart to move.
It's now or never this D1 chart is looking ready to me.
Don't forget NO TRADE is a sure bet.
Manage RISK WELL if you want longevity in this game.
HAVE A GREAT WEEK 👌

Hurry Up & Wait! ● Is XRP ready to break out?It was a nice ride for those involved from the most recent lows printed on 30-31 December, however price still needs to break out of this channel if it is to get that massive next leg higher.
Until then we are still waiting for the breakout.
No need to rush we are here for the long run.

XRP - LongTerm (Spot) XRP - LongTerm (Spot) 🚀
Entry Points
From 2 to 3 $ Area
Longterm Targets 🎯
Target 1 : 4.5
Target 2 : 7
Target 3 : 11
It may take about 2years to reach 3rd target. Investment need patient 🙏 So Don't be afraid if you even lose money in a short time. Always stick to your choices and victory is yours.
Good Luck
Have fun.

Ripple XRP Huge BULL FLAG formation? XRP ALERT!Not my typical trade setup but when they are as obvious as this one has to take note.❗️
With such a strong rally over the past 24hrs or so you would be forgiven for expecting XRP to take a breather and have some sort or retracement but two things I always teach is:
🟢 Every strong trend starts with a breakout and
🟢 An asset can retrace in TIME rather than in PRICE, more commonly viewed as a consolidation on the chart.
If you plan on taking on this setup remember to consider entry on a lower timeframe to manage risk and reduce the stop level if you use one.
I know alot of you younger guys refuse to use stops "YOLO" you say BUT like I say "you can't trade without CAPITAL" so always manage your risk.👌

Will XRP Ever see sub $2 again? My thoughts inside.Will XRP Ever see sub $2 again❔️
Here is my current thoughts.🤔
📈 As we enter a new year and the close of a number of higher time frame candles it's easier to take a step back and look at the bigger picture.📉
There is no rush to act now.
One GOLD phrase I use a lot when trading is
🌟"Hurry Up & Wait"🌟 👌
Regarding XRP right now.
I do not know and it is ok to say so belive it or not.👍
It's easy to assume that after nearly 25 years of trading I should always have a trade on or know where the next one is. For me anyway that is not the case and for many other very successful traders I know that stands for them too.✅️
🟢 On the current 60min chart the 8 hour leg up that just took out my key high noted in my earlier chart yesterday will tell me where I want to be depending on the next leg, be it either the continuation or retracement/reversal created in the next 8 hours will give me a better picture.
ℹ️ However whilst price remains above 2.10 USD I do not want to take the short side of XRP.

XRP Ready to POP or FLOP? My entry bar maybe my exit too!
I shared my last short during the formation of this 240min bar (marked on the chart) and I have held onto both of my shorts however price hasn't tipped it's hand as of yet.
I don't like what I'm seeing here and being the last trading day of the year and having this position still in a very small profit I will be exiting my shorts just above break even and call it a year if price breaches the high of previous bar of my last short entry.
ℹ️ My XRP buy limits will remain in the market regardless of the outcome of my short plan.
🟢2025 I plan on sharing a lot more and helping out where and when I can.
🟢My children have all flown the nest now so I will have a bit more time to partake in discussion and answering questions when I can.
⭐️Have a great week and year⭐️
Remember Without A Plan It's Just Gambling👌

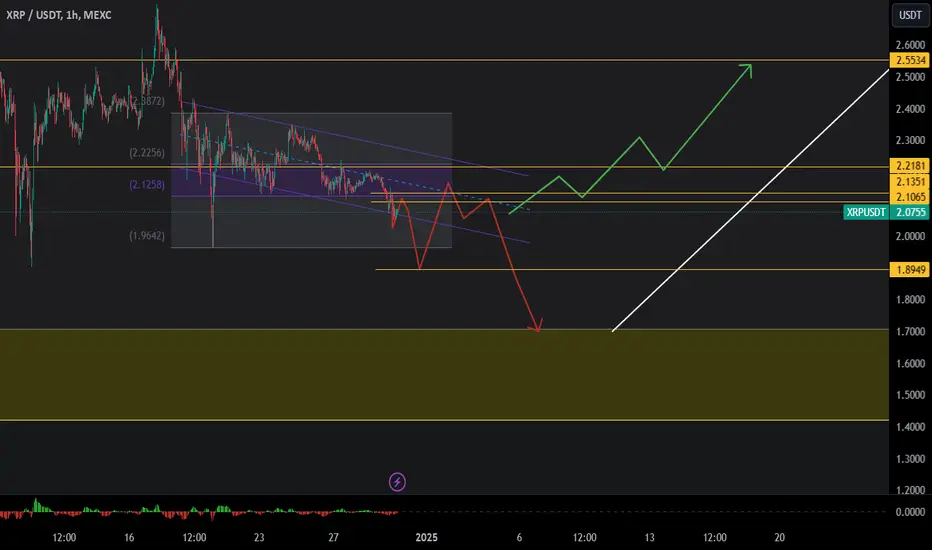
xrp update 1 hourupdate xrp usdt 1 hour chart
dont overpower the trade en look what the price action tells
have a nice day!
Disclaimer: Think carefully before making an investment and never invest more than you could afford to lose. We at legendsoffcrypto do not provide financial advice and are not responsible for any financial loss. The content we offer has purely entertaining and educational value.
XRP UpdateXRP has formed a ascending triangle on H4 timeframe
the triangle has been broken below the down trendline
this pair retested and rejected the triangle so we entered a short position
Happy trade family
Follow us for more updates

XRP/USD "Ripple" Crypto Market Heist Plan on Bearish Side🌟Hi! Hola! Ola! Bonjour! Hallo!🌟
Dear Money Makers & Robbers, 🤑 💰
Based on 🔥Thief Trading style technical analysis🔥, here is our master plan to heist the XRP/USD "Ripple" Crypto market. Please adhere to the strategy I've outlined in the chart, which emphasizes long entry. Our aim is the high-risk Red Zone. Risky level, overbought market, consolidation, trend reversal, trap at the level where traders and bearish robbers are stronger. 👀 So Be Careful, wealthy and safe trade.💪🏆🎉
Entry 📈 : You can enter a trade after the breakout & Retest
however I advise placing Multiple Buy limit orders within a 15 or 30 minute timeframe. Entry from the most recent or closest low & high level should be in retest.
Stop Loss 🛑: Using the 2H period, the recent / nearest low level.
Goal 🎯: 3.00000
Scalpers, take note : only scalp on the Long side. If you have a lot of money, you can go straight away; if not, you can join swing traders and carry out the robbery plan. Use trailing SL to safeguard your money 💰.
Warning⚠️ : Our heist strategy is incompatible with Fundamental Analysis news 📰 🗞️. We'll wreck our plan by smashing the Stop Loss 🚫🚏. Avoid entering the market right after the news release.
Take advantage of the target and get away 🎯 Swing Traders Please reserve the half amount of money and watch for the next dynamic level or order block breakout. Once it is resolved, we can go on to the next new target in our heist plan.
💖Supporting our robbery plan will enable us to effortlessly make and steal money 💰💵 Tell your friends, Colleagues and family to follow, like, and share. Boost the strength of our robbery team. Every day in this market make money with ease by using the Thief Trading Style.🏆💪🤝❤️🎉🚀
I'll see you soon with another heist plan, so stay tuned 🫂

XRP: Bullish MomentumBINANCE:XRPUSD took support from daily Anchored VWAP. Buy Entry executed on daily chart.
Note: Green Yellow Candle. It is Buy Signal triggered on daily candle close. Following candle is confirmation candle. As it broke the high of Green Yellow Candle entered long with stop loss. Use trailing stop loss to manage your position.

XRP Reborn | Bullish Momentum | Positive Fundamentals BINANCE:XRPUSD Buy Entry executed on daily chart.
Note: Green Yellow Candle. It is Buy Signal triggered on daily candle close. Following candle is confirmation candle. As it broke the high of Green Yellow Candle entered long with stop loss.

Pull back or pumpwatch the chart closely big move coming now
we either go back to 1.9 or to 3 watch closely

XRP’s Next Move: Can We Reach $2.80 and Beyond?Picture yourself on a calm evening, sitting by the window with a warm drink in hand. The day feels steady, yet there’s a sense of anticipation—you know something’s brewing. That’s where XRP is right now, inching closer to $2.80, a key level that could change the game.
If it breaks through, there’s room to climb—$3.18, $3.70, maybe even further. But if it doesn’t hold, the market might take a step back, correcting to $2.50-$2.40, or even slipping down toward $1.52 if the momentum shifts. It’s one of those moments where patience and focus matter most.
You can feel the energy in the market, a mixture of excitement and uncertainty. It’s like standing on the edge of something big, knowing it could go either way. But you’re not here to rush or panic. You’re here to watch, to analyze, to make your move when the time is right. Because trading, like life, rewards those who stay grounded in the moment.
Wellness Tip: When things feel uncertain, take a pause. Stand up, stretch, and take five slow, deep breaths. Remind yourself that every move in the market is part of a bigger picture—and you’re in control of how you respond. A calm, clear mind always makes the best decisions. 🌿✨
Trade What You See
Kris/ Mindbloome Exchange

Ripple Xrp usdt Daily analysis
Time frame 4 hours
Risk rewards ratio >2
I'm waiting for a good pump
Look at the chart. We can see 4 triangles
Price move up and down in the triangle and then it breok upper side and pumped.
Now this triangle is shaped and I hear good news about the Ripple. So!
What will happen 🤔

Technical Analysis of XRP/USDT📊 Technical Analysis of XRP/USDT (Weekly Chart)
Key Highlights:
Long-term Ascending Channel:
The chart shows a strong upward ascending channel highlighted by blue lines. 📈
The lower boundary serves as strong support, and the upper boundary acts as a key resistance. 🔵
Support and Resistance Levels:
Resistance Zone: Between $2.6 and $1.9. 🟥
Support Zone: Around $0.96 and the lower boundary at $0.29. 🟩
600% Target:
A potential bullish target of around $6.54–$6.39 has been identified. 🚀✨
✅ Possible Price Movements:
The price has recently rejected near the resistance zone and may retrace toward $1.9. 🔄
If the support level at $0.96 holds, a bullish rebound toward the channel’s upper boundary and the $6.54 target could occur. 📈💹
Breaking below critical support (below $0.46) may lead the price toward the channel's bottom, near $0.29. ⚠️📉
🎯 Trading Strategy Suggestion:
Buy Entry: Near key supports like $0.96. 🟢
Stop Loss: Below the channel’s lower boundary or $0.46. ⛔️
Take Profit: Around $3.0, $6.54, or the channel’s upper boundary. 🏆
🛑 Important Note:
This analysis is for informational purposes only. Always perform further research and apply proper risk management before making financial decisions. ⚠️

XRP IS GOING NO WHEREAs you can see XRP is entering what looks to be a consolidation phase / sideways market cycle. On the higher timeframes (daily) it is also evident. There is a lot of uncertainty and manipulation taking place with XRP, bouncing around from key level to key level.
The whales are laughing all the way to the bank as retail traders emotional decisions of buying and selling instantaneously provides them liquidity to keep entering, pumping and selling.
In moments like this it can be best to sit back & spectate as 95% loose common sense & start to pull their hair out because they cant seem to catch a pump or dump.
The bigger picture will prevail and once it presents itself we'll be able to establish a better idea of which direction XRP might be headed, at the moment there is a significant lack of data to even begin to predict price targets / points.
Sometimes sitting on your hands is the BEST risk management strategy.

XRP Next Year Target After DropNext Year Resist For XRP After Heavy Drop
Dont Save profit and be greedy !!!
You Cant See 0.7$ Again Until 2099 (We All Death)
Please Check Related publications to understand what i say

XRP/USD "RIPPLE" Crypto Market Bullish Heist PlanHola! Ola! My Dear Robbers / Money Makers & Losers, 🤑 💰
This is our master plan to Heist XRP/USD "RIPPLE" Crypto Market based on Thief Trading style Technical Analysis.. kindly please follow the plan I have mentioned in the chart focus on Long entry. Our target is Red Zone that is High risk Dangerous level, market is overbought / Consolidation / Trend Reversal / Trap at the level Bearish Robbers / Traders gain the strength. Be safe and be careful and Be rich.
Entry 📈 : Can be taken Anywhere, What I suggest you to Place Buy Limit Orders in 15mins Timeframe Recent / Nearest Low Point take entry should be in pullback.
Stop Loss 🛑 : Recent Swing Low using 2H timeframe
Target 🎯 : 31000
Attention for Scalpers : Focus to scalp only on Long side, If you've got a lot of money you can get out right away otherwise you can join with a swing trade robbers and continue the heist plan, Use Trailing SL to protect our money 💰.
Warning : Fundamental Analysis news 📰 🗞️ comes against our robbery plan. our plan will be ruined smash the Stop Loss 🚫🚏. Don't Enter the market at the news update.
Loot and escape on the target 🎯 Swing Traders Plz Book the partial sum of money and wait for next breakout of dynamic level / Order block, Once it is cleared we can continue our heist plan to next new target.
💖Support our Robbery plan we can easily make money & take money 💰💵 Follow, Like & Share with your friends and Lovers. Make our Robbery Team Very Strong Join Ur hands with US. Loot Everything in this market everyday make money easily with Thief Trading Style.
Stay tuned with me and see you again with another Heist Plan..... 🫂

XRPUSDT | Did You Enjoy It Last Time ?If we win back the green box, I would like to be involved in the long process in its retest, but if we cannot win, I would be involved in the orange box with the range low manipulation.
I tried to draw the scenarios, I hope it will be useful, you can look at my previous XRP analysis.
🔵 XRPUSDT.P: Entry Zones

XRPUSDWe will see a boost towards the uptrend. we have retest the level. be patience and you will be happy with the result. my upside target is 5$ by the end of the January or maybe more then 8 to 10$.

XRP Entering another 175 Week cycle. $220 EOY ExplainedRed projections is 2014-2017 price action. We take that entire cycle place it at the end of the prior 8 week cycle which week of 11/9/20 and get projections.
As new cycles begin that's where the red projections start price inverts the most at the start as we see and begins to slowly line up and the inversions slow down and line up the closer we get to entering a new cycle which we see.
This repeating price action & inversion it's simply predetermined algo based price action "its a a booked market place" it's masking movement but we can see it's lining up again as we enter the pump the inversions slowing fading and now price is lining up which indicates significant price movement is close.
"News is the excuse for the moves" - NeverWishing
-We have settlement approaching.
-Ripple IPO.
-Feb 7th 24 Congress wants to regulate Stable coins & the need for clear rules and federal regulatory oversight.
This is just naming a few events but the main focus is to remember the only digital asset with legal clarity in the United States is XRP. It has obtained a unique legal status being the only altcoin to enjoy such certainty. XRP is the only digital asset other then bitcoin with legal clarity in the U.S
-Neverwishing

Identifying Entry Zones in Two Blue BoxesWhen analyzing XRP for potential trading opportunities, marking two key zones as "blue boxes" can help identify areas where price action is likely to reverse or continue in a favorable direction. These zones are usually based on technical analysis principles, such as:
Support and Resistance Levels
The lower blue box represents a strong support level, where the price has historically bounced back. This is a good entry zone for long positions, especially if the market structure confirms a reversal pattern like a double bottom or bullish engulfing candle.
The upper blue box often marks a resistance zone, but if price breaks through and retests this level, it can turn into a support level. This makes it a good entry for continuation trades.
Fibonacci Retracement Zones
Use Fibonacci retracement tools to identify areas within the 0.618–0.786 range, which often coincide with one of the blue boxes. These zones are high-probability areas for market reversals.
Order Blocks or Demand Zones
The lower blue box can also represent a demand zone, where institutional buyers are likely accumulating XRP. Look for sharp moves up from these levels in the past to confirm.
Volume Profile and Imbalance Zones
The blue boxes might align with high volume nodes or areas where price moved quickly, leaving a volume imbalance. When price returns to these zones, it often acts as a magnet for entries.
Trading the Blue Boxes
If price breaks above and retests the blue box as support, consider it a bullish entry for a breakout continuation.
I don't overcomplicate things and add a ton of dirty crap to my charts, but you can check out the success of my analysis below.
I approach trading with confidence backed by experience and past success in identifying high-probability setups.
While I don’t claim to be the best, my track record speaks for itself, and I strive to let my analysis and results do the talking. Watch these levels closely—markets can confirm what charts already whisper. Let’s see how this plays out together.
My Previous Hits
🐶 DOGEUSDT.P | 4 Reward for 1 Risk (or more if you’re bold).
DOGEUSDT.P: Next Move
🎨 RENDERUSDT.P | HTF Sniper Precision
RENDERUSDT.P: Opportunity of the Month
💎 ETHUSDT.P | Buyer Zone So Accurate You’ll Double Check
ETHUSDT.P: Where to Retrace
🟢 BNBUSDT.P | Buyer Zone Mastery (CZ vibes).
BNBUSDT.P: Potential Surge
📊 Bitcoin Dominance | Called it Like a Pro
BTC Dominance: Reaction Zone
🌊 WAVESUSDT.P | The Blue Box: A Demand Zone with Potential
WAVESUSDT.P: Demand Zone Potential
🟣 UNIUSDT.P | Long-Term Trade
UNIUSDT.P: Long-Term Trade
Now sit back, relax, and watch the market do its thing. Or don’t, FOMO is real. 😉
