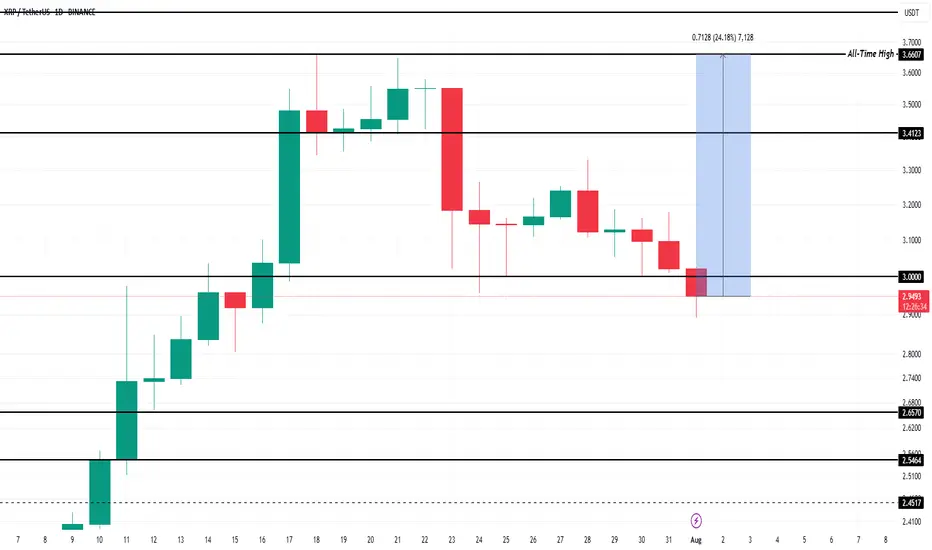
What To Expect From XRP In August 2025?Currently, BINANCE:XRPUSDT is trading at $2.99, slipping through the key support level of $3.00. While the altcoin is still over 22% away from its ATH of $3.66 , the foundation for potential growth remains strong. Historical data has shown that August typically brings bearish momentum for BINANCE:XRPUSDT , with median monthly returns of -6% .
However, given the strong buying activity observed recently and the positive technical indicators, this August might defy the usual trend. If BINANCE:XRPUSDT manages to secure support above $3.41, the altcoin could push towards its ATH once again . Alexis Sirkia, Captain at Yellow Network, discussed with BeInCrypto how XRP’s future could be looking like.
“Institutions that have been in the market for a while are gaining momentum. We're also, in the meanwhile, in a macro environment where funds are doing risk rotation… BINANCE:XRPUSDT is taking its stand with regulation and infrastructure, not hype. That's what will endure in the long run. Short-term flows are fleeting, but the groundwork laid today will define the cycle to follow.”
However, there’s a downside risk. If BINANCE:XRPUSDT fails to reclaim the $3.00 support, the price could fall to $2.65, invalidating the bullish thesis. A drop to this level would mark a four-week low and would likely lead to further selling pressure.
Xrpusdshort
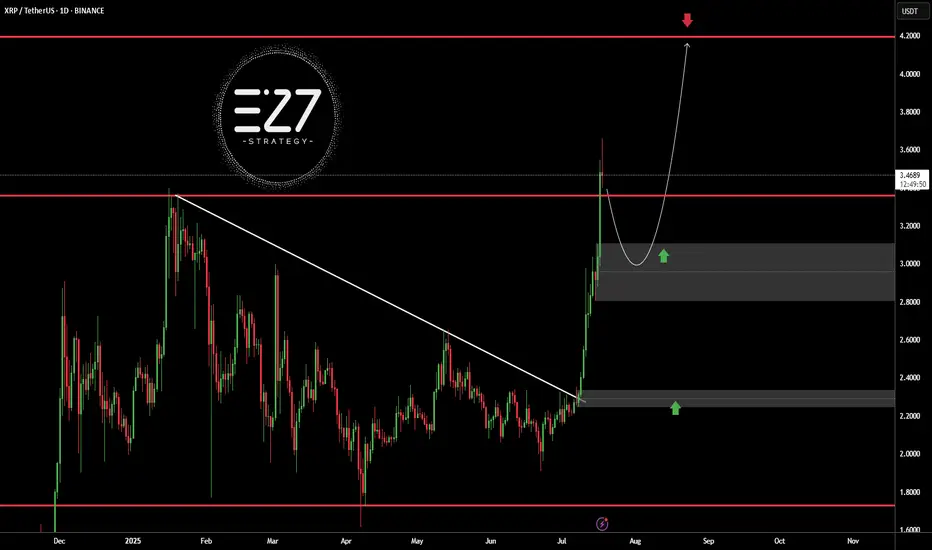
XRPUSDTBINANCE:XRPUSDT broke above its long-term downtrend line and surged to the $3.5000 resistance area, but is now undergoing a correction. The current bullish structure, with a higher high and higher low, suggests the trend remains upward. A pullback toward the $3.0000 demand zone is likely and would be a healthy retracement. Holding this area could trigger a continuation toward the key resistance at $4.2000.
Key Level Price
Main Support $2.2000
Main Resistance $4.2000
Best Buy Range $2.9500 – $3.1500
Best Sell Range $4.1000 – $4.2000
Investment Risk (Buying) Medium
⚠️Please control RISK management
XRPUSD - Target reached. Reversal on the plateSo, that was a nice long trade.
Now price is stretched at the Upper Medianline Parallel (U-MLH).
As of the time of writing, I already see price pulling back into the Fork. A open and close within the Fork would indicate a potential push to the south.
Target would be the Centerline, as it is the level where natural Meanreversion is.
Observation Hat ON! §8-)

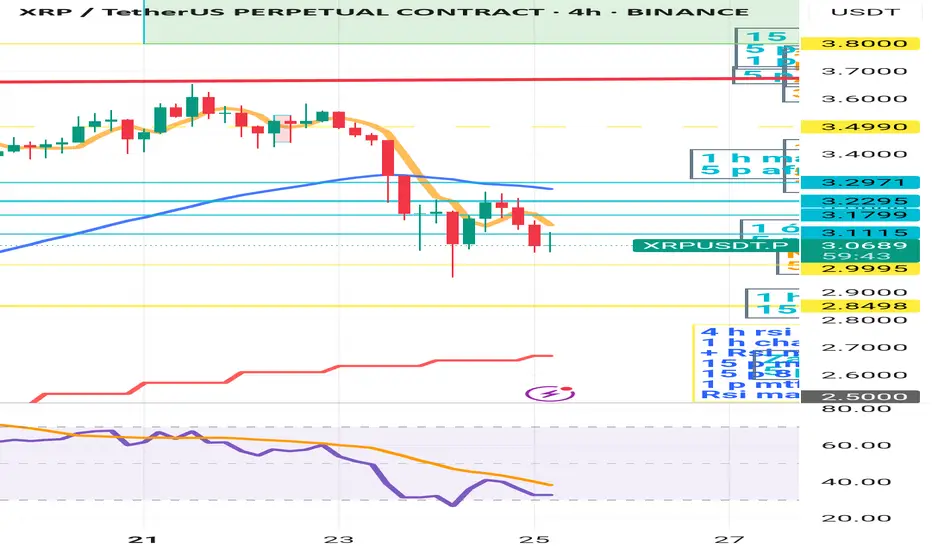
XRP is still waiting for a longI think that XRP - and looking at the Total Market Cap chart - has taken a downward trend. Although the RSI is well above 70 on the daily timeframe, the faster leg is already approaching 50. Looking at the 4-hour RSI, as long as it is below 50, I do not expect an upward movement. I see a chance for further upward movement if the chart is currently above $3.2971. It is worth watching the 4-hour 50 EMA for possible long position opening, but only if the price crosses the 4-hour 50 EMA upwards. There could be a danger if it breaks the 50 EMA on the daily, which will be around $2.7. I should add that the 4-hour 200 EMA is around $2.8, so there will be a band between 2.7-2.8 where the chart can dance before deciding which direction to take. As long as the RSI MA is above 50 on the day, long-term positions - which were started around 2023 - should not be negatively affected by this "small" sell off. I think it is worth waiting for now for longs, not to enter an upward trade into the declining chart. Attention should be focused on the 4-hour 50 ema/chart cross, and the 4-hour rsi MA 50 cross. Until these are met, starting a long is life-threatening. I am curious how you see it.
XRP : Long term analysisHello friends🙌
🔊Considering the great growth that the price has had and has set a new ceiling, be careful because we are at the ceiling and when we are at the price ceiling, we should always expect a price correction...
⚠Now, given the strong upward trend we have, you can buy with risk and capital management, but our suggestion is lower prices for the possibility of a correction and the possibility of a reversal pattern.
So we have identified important support levels for you and we have also identified price targets.
🔥Follow us for more signals🔥
*Trade safely with us*

XRPUSD - BEARISH DIVERGENCE DESPITE STRONG BULLISH PRESSUREXRPUSD SIGNALS BEARISH DIVERGENCE DESPITE STRONG BULLISH PRESSURE. WHAT TO EXPECT?👀
Ripple has been moving bullish since July 9, the same as the ETHUSD, reaching the 3.60600 resistance level. Strong bearish divergence on RSI is observed.
What is the bearish divergence?
Bearish divergence is a technical analysis pattern where the price makes higher highs in an uptrend, but a momentum indicator (e.g., RSI, MACD) forms lower highs, signaling weakening bullish momentum and a potential downward reversal. To trade, identify the divergence in a clear uptrend with the indicator showing lower highs (e.g., RSI above 70). Sell or short when the price confirms a reversal (e.g., breaks below a support level or trendline) with increased volume. Set a stop-loss above the recent high. Target the next support level.
Here the closest support level is local support 3.00000. is the price drops below the EMA20 on 4-h chart, there are high chances of reaching this level.

XRP : ETF...Hello dears
Considering the good growth we had, you can see that the price is stuck in a long-term range and has not managed to break it yet...
We must be prepared for any scenario, so the best thing to do is to buy stepwise, of course with capital and risk management.
Note that this analysis is on a daily time frame and may take a while, so if you are not patient, do not enter.
*Trade safely with us*

Ripple buy signalHello friends
Given the good growth we had, we entered a deep correction, and now we have the opportunity to buy step by step in the specified support areas with capital and risk management and move with it to the specified targets.
*Trade safely with us*

Xrp:The fate of Ripple in the long termhello friends👋
After a good price growth that we had, you can see that the buyers gradually exited and a triangle pattern was formed.
Now, according to the specified support, it should be seen whether buyers support Ripple or not...
You have to wait and nothing can be said until the failure of the pattern, but we suggest that you buy step by step with capital and risk management in the identified areas that are very good supports and move to the set goals.
And in the end, we must say that don't forget that we are in a strong upward trend, that the probability of the continuation of the Bister trend is the possibility of a fall...
🔥Follow us for more signals🔥
*Trade safely with us*

#XRP/USDT - SHORTThe chance that the asset will reach the $5 level is extremely low. This is indicated only by the 3-month timeframe. The rest of the data suggests that the movement will be in one direction.
(Not an investment recommendation).
XRPUSDT BINANCE:XRPUSDT Price broke above the downtrend line but faced resistance at 2.2770 dollars and started correcting. Key supports are at 2.1900 and 2.0800 dollars. If it bounces, resistances to watch are 2.2770, 2.3600, and 2.4620 dollars. Price is currently between key levels.
Key Levels:
Support: 2.1900 – 2.0800
Resistance: 2.2770 – 2.3600 – 2.4620
⚠️Contorl Risk management for trades.

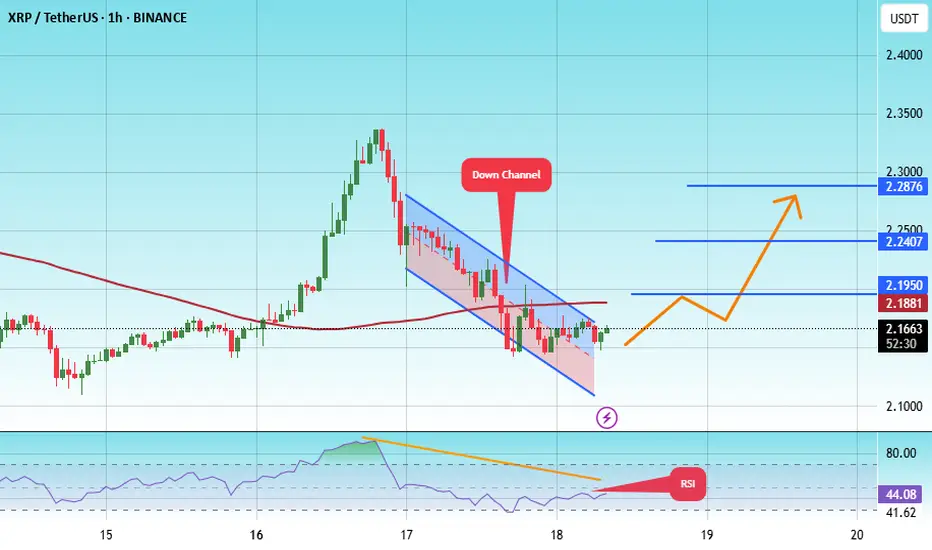
#XRP/USDT#XRP
The price is moving within a descending channel on the 1-hour frame, adhering well to it, and is heading towards a strong breakout and retest.
We are experiencing a rebound from the lower boundary of the descending channel, which is support at 2.11.
We are experiencing a downtrend on the RSI indicator that is about to be broken and retested, supporting the upward trend.
We are looking for stability above the 100 Moving Average.
Entry price: 2.16
First target: 2.20
Second target: 2.24
Third target: 2.28
XRP Still in Buy Zone – Eyes on $2.50+our chart clearly marks that XRP has bounced off a strong buy zone (around the $2.10–$2.15 range), aligning well with a classic setup: price hitting support, creating a small base, and starting an upward rotation. 👇
Support area respected – The highlighted circle shows XRP revisiting the demand zone and quickly rebounding, very bullish behavior.
Lower wicks & volume spike – Indicate absorption of selling pressure and possible institutional interest.
Green arrow projection – Suggests a break above the immediate resistance (~$2.17 EMA/Ichimoku levels) could trigger a rally toward the next resistances around $2.22, $2.47, and potentially $2.63.
“Still in buy zone” annotation – Absolutely valid: as long as XRP stays above that key base ($≈$2.10), the bullish case holds.
🔍 Market Context
Range consolidation between ~$2.10–$2.30 has been the dominant theme, awaiting a breakout catalyst (e.g., ETF approvals or legal clarity)
thecryptobasic.com
+14
fxempire.com
+14
crypto.news
+14
.
Analysts highlight a falling wedge and support zone between $2.00–$2.20—if price holds, a move toward $3–$4 is plausible .
A range-bound weekly outlook anticipates a push toward $2.50 resistance before exploring higher targets .
✔️ Summary
Buy zone holding: Bullish pattern confirmed with rebound from support.
Key resistance levels: Watch for a breakout above $2.17/EMA and then $2.22–$2.30/$2.50.
Ideal strategy: Maintain position above support; add on breakout, targeting $2.50–$3.00.
Risk points: A drop below $2.10 could test $2.00 or even $1.85 support.

XRP Back on the MENU! XRPUSD Ripple next move? XrpUsdtIt's been a while since we looked at this chart.
🌍 SeekingPips 🌎 View remains the same and so we are strictly looking for strategic LONG entry points in
TIME & PRICE. 👌
Yes it's a WEEKLY chart and I understand that many of the trigger happy TRADERS or in some cases GAMBLERS can't stand to look at anything longer than a 30 minute chart BUT really sometimes you really just have to STEP RIGHT BACK to see the BIGGER PICTURE👍
✅️This week's candle CLOSE really has the potential to setup the next few weeks for easy MULTIDAY TRENDING MOVE TRADE SETUPS 👍
ℹ️ Note the price location on what we viewed as a HTF FLAG MANY WEEKS AGO .
Yes it was breached both sides but 🌎SeekingPips🌍 doesn't trade the patterns themselves but the HUMAN PSYCHOLOGY AROUND THESE PATTERNS.🤔
ℹ️ Note where most of the volume has been trading and also note the moves around the extreems of the dead patteren too.💡
In an even higher TIMEFRAME THE FLAG would still be valid and forming the flag itself too.
📊 [ b]CHECKOUT the MONTHLY chart for the example. 📉
Anyway we will see what the next 48 hours🕦 hold but no doubt this one is on our RADAR this week.
✴️ 2.048 to hold otherwise a potential for current low of this year to be tested.
✴️ Alternatively if support starts to form on the 240min chart at current levels last weeks high could expected to be tested
✴️ if so Xrp could easily give a multiday upside trending move.
Now like a NINJA we wait and stalk...
As always ladies and gentlemen whilst Seeking Pips 🌍 SeekingPips 🌎 says
" NO TRIGGER NO TRADE"
& "STICK TO YOUR PLAN"✅️
👍 Have a GREAT WEEK and we will see you soon with an UPDATE...

This isn’t distribution. It’s preparation.XRP has spent the last sessions consolidating just under a 15M OB — not failing, just gathering energy. Most traders confuse rejection for weakness. Smart Money sees opportunity.
What matters:
We’ve got stacked 15M OBs above 2.2544 and 2.2805 — liquidity zones that will either break or sweep
Price just tapped the local low while holding above volume cluster support
If we reclaim the midrange and hold above 2.2400, the setup for expansion into 2.2805 is in play
Lose 2.2348? Expect a deeper rotation to the 2.1862 demand zone
There’s no need to predict here. Just follow structure. Volume confirms intent, and the reaction around these OBs will dictate the next leg.
Execution:
Reclaim 2.2544 → long toward 2.2805
Clean breakdown? Step aside and re-evaluate near 2.19
Bias is bullish unless 2.2348 gets invalidated with conviction
You don’t need more signals. You need fewer distractions. The chart is already speaking.
More like this? Setup-first, noise-free — check the profile description.

It wasn’t a breakout. It was a sweep.BINANCE:XRPUSDT.P didn’t rally to trend — it rallied to rebalance. The high at 2.2744 was always a liquidity draw, not a destination. Now that the market has taken what it needed, we trade the reaction — not the impulse.
Here’s how this unfolds:
Price tapped into a clean 1H OB and immediately rejected
Below that, we’ve got confluence between OB + FVG zones around 2.2220 and 2.2070 — that’s the re-entry window
Fibonacci levels reinforce the structure:
• 0.5 at 2.2287
• 0.618 at 2.2180
• 0.786 near 2.0266 — last line before deeper rotation
If price holds above the OB and starts to consolidate into a bullish MSS, I expect a rotation back toward the premium wick at 2.2744 — maybe even higher depending on volume profile buildup.
But if we lose 2.2070 decisively, all eyes go to 2.1697 and then 2.1831 — where the real volume sits.
Execution bias:
Accumulation above 2.2070 → bullish continuation valid
Break and hold below? Reversion into deeper discount zones likely
Targeting the sweep of 2.2528 and eventual test of 2.30+ if structure confirms
The move isn’t over. It’s transitioning. You either read the shift or get caught in it.
More setups built on narrative and price logic? They’re in the profile description. I don’t chase — I position.

Price delivered the signal — now it’s time to follow structure.XRP isn’t reacting randomly. It’s responding to engineered inefficiencies and prior OBs that most overlook. What looks like resistance to others is just a staging ground for continuation.
Here’s the play:
Price ran into the 1H OB at 2.2219 — hesitation here was expected
We’re now pulling back into the equilibrium zone, anchored by 0.382–0.618 fib (2.1886–2.1680)
This zone also aligns with the previous 1H OB — an accumulation base that already proved itself
If price holds above 2.1533 and shows rejection at the 0.5 fib (2.1783), I expect the next leg to take out 2.2219 and push toward the 4H OB.
Execution thesis:
Ideal long re-entry is in the 2.18–2.16 zone
Invalidation below 2.1346
Targets: 2.2476 → 2.3107, with 2.2219 as first test
This isn’t about chasing highs. It’s about aligning with structure and letting the draw on liquidity do its work.
Want more trades delivered with this level of clarity? The account description has them. I don’t forecast with hope — I forecast with models.

They waited for confirmation. I bought the retrace.XRP didn’t reverse. It refined.
After reclaiming the rounded base and pushing into a 1H OB, price rotated perfectly into the 0.5 retracement at 2.1419 — tagging the breaker wick, respecting structure, and front-running the deeper 0.618 by a hair.
This isn’t weakness. It’s an engineered dip into fresh demand. Smart Money logic doesn’t require “green candles” — it requires imbalance filled and structure respected. That’s exactly what we have here.
Now, price is boxed between two intentions:
If we hold 2.1419, the draw becomes the 1H OB above — 2.1758 to 2.2060.
If we break that level with conviction, 2.1268–2.1052 will serve as the next rebalance zone before any macro continuation.
Execution tier:
✅ Long bias above: 2.1419
🎯 Target 1: 2.1758
🎯 Target 2: 2.2060
❌ Invalidation: Clean 1H body close below 2.1268
Retail waits for signals.
Smart Money builds in silence — and exits with intent.

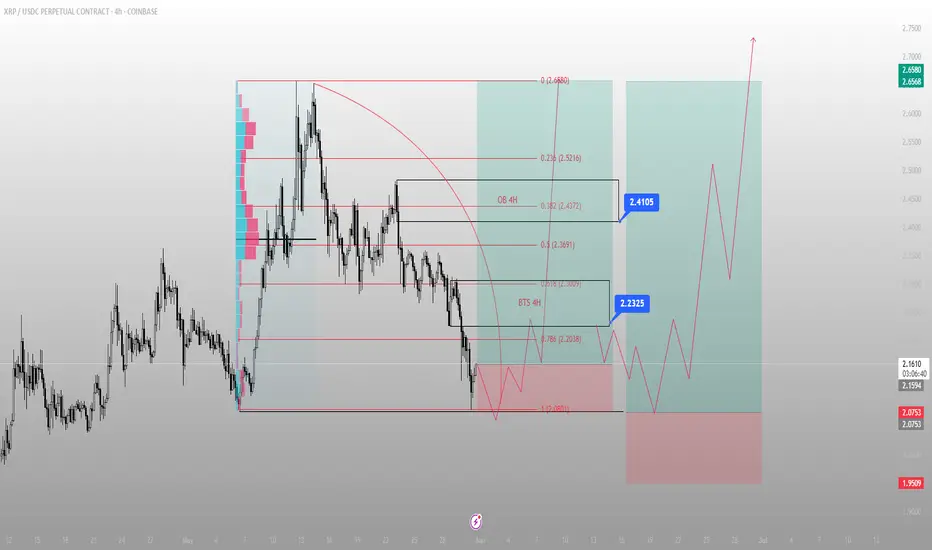
XRP didn’t break down. It just returned to origin.There was no crash. Just a clean delivery.
BINANCE:XRPUSDC swept the prior low and tapped directly into the 1.0 extension of the move — right at 2.0901 — closing below liquidity, only to reclaim it on the next candle. That’s not weakness. That’s Smart Money reloading.
Below that low sits the 4H BTS zone, overlapping the 0.618 and 0.786 retracements (2.2038–2.2325). That zone was engineered. Built. Not random. Price has already started responding.
The first draw is clear: 2.2325 — back into the inefficiency left behind on the breakdown. From there, we face a clean decision point at 2.4105. That’s where OB meets .382 retracement — and it’s a known trap zone for liquidity.
If price rips through it, 2.5216 becomes the magnet. If it rejects, I’ll be watching for a final mitigation before the full macro expansion.
Execution clarity:
✅ Entry: Inside BTS 4H zone (2.0901–2.2038)
🎯 Target 1: 2.2325
🎯 Target 2: 2.4105 (4H OB + liquidity pool)
🛑 Invalidation: Close below 1.9509
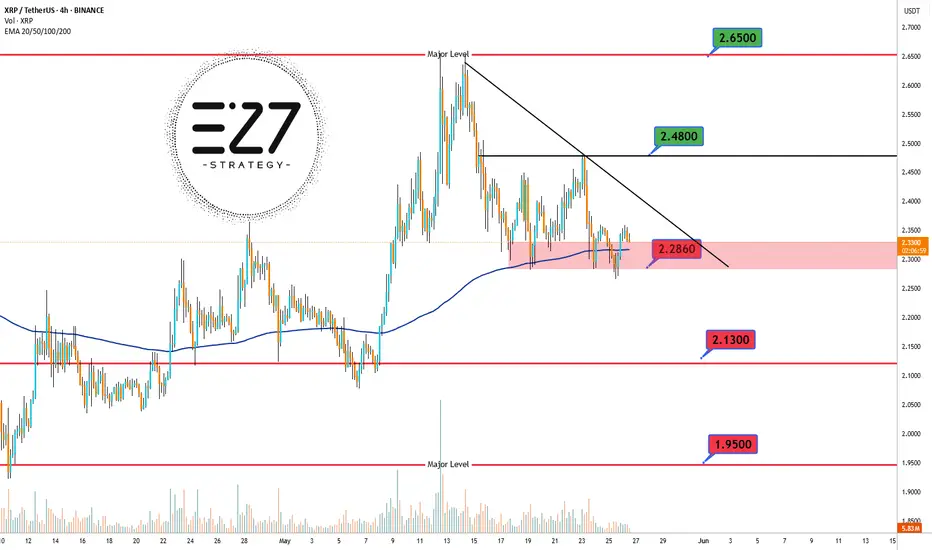
XRPUSDT The 4-hour chart of BINANCE:XRPUSDT shows that the overall trend remains bullish, but the price is currently in a corrective downward phase. 📉 At the moment, XRP is trading in a highly critical zone, right at the 2.2860 USDT support level, which aligns with the 200 EMA — often considered a dynamic support area. 🛡️ Despite this confluence, the price still sits below the descending trendline, indicating continued bearish pressure. ⚠️ If the price manages to hold this key zone and break above the trendline, a move toward the next resistance at 2.4800 USDT and potentially 2.6500 USDT could follow. 🚀 However, losing the 2.2860 support could trigger a deeper drop toward 2.1300 USDT and even 1.9500 USDT. ❗ This current level, where static support intersects with the 200 EMA, is a make-or-break zone that will likely define the short-term direction of XRP.
Support & Resistance Levels:
🔼 Major Resistance: 2.6500 USDT
🔼 Secondary Resistance: 2.4800 USDT
⚡ Dynamic Resistance (trendline): ~2.3500 USDT
🔽 Key Support (current price level): 2.2860 USDT
🔽 Secondary Support: 2.1300 USDT
🔽 Major Support: 1.9500 USDT
#XRP/USDT#XRP
The price is moving within a descending channel on the 1-hour frame, adhering well to it, and is heading for a strong breakout and retest.
We are seeing a bounce from the lower boundary of the descending channel, which is support at 2.29.
We are seeing a downtrend on the RSI indicator that is about to break and retest, supporting the upward trend.
We are looking for stability above the 100 Moving Average.
Entry price: 2.30
First target: 2.33
Second target: 2.37
Third target: 2.42

#XRP/USDT#XRP
The price is moving in a descending channel on the 1-hour frame and is expected to continue upward.
We have a trend to stabilize above the 100 moving average once again.
We have a downtrend on the RSI indicator, which supports the upward move with a breakout.
We have a support area at the lower boundary of the channel at 2.25.
Entry price: 2.34
First target: 2.42
Second target: 2.47
Third target: 2.56

XRP/USDT: BUY LIMITHello friends
Due to the price rise, you can now see that a double top pattern has formed at the price ceiling, which indicates a correction. Therefore, we have identified good support areas for you to buy in steps and with capital management and targets.
*Trade safely with us*
