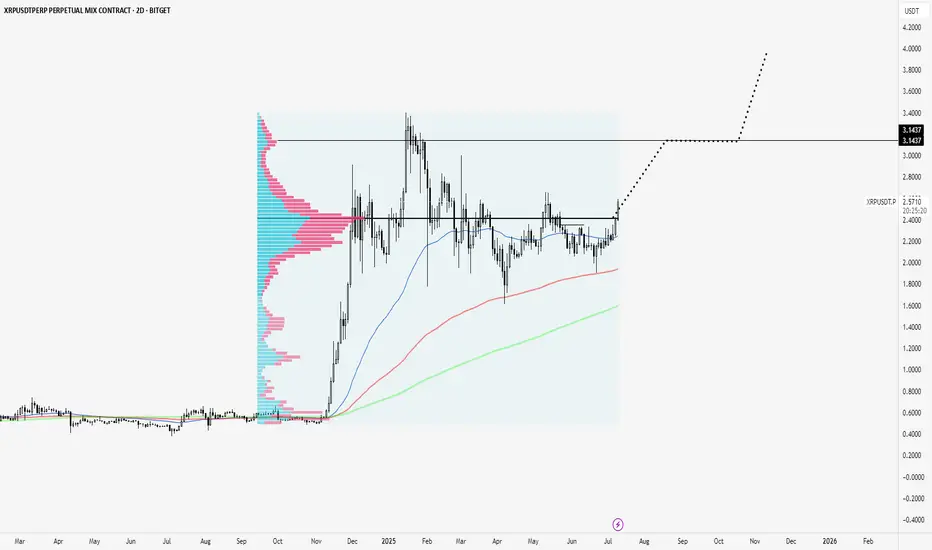
XRP clears Point of Control to test highs.XRP is breaking out of a consolidation zone and above a volume point of control that has been massive since its November rally onward.
Looks like next node is to $3.14
Super strong coin.
Ripple testimony in banking committee yesterday was bullish. Ripple partnering with BNY Melon yesterday was bullish. Ripple leading regulation standards with their XRP case is bullish. Ripple winning the status of XRP as one of a kind is bullish. Ripple getting a bank charter and fed master account is bullish.
Not much is close to XRP fundamentally.
XRPUSDT
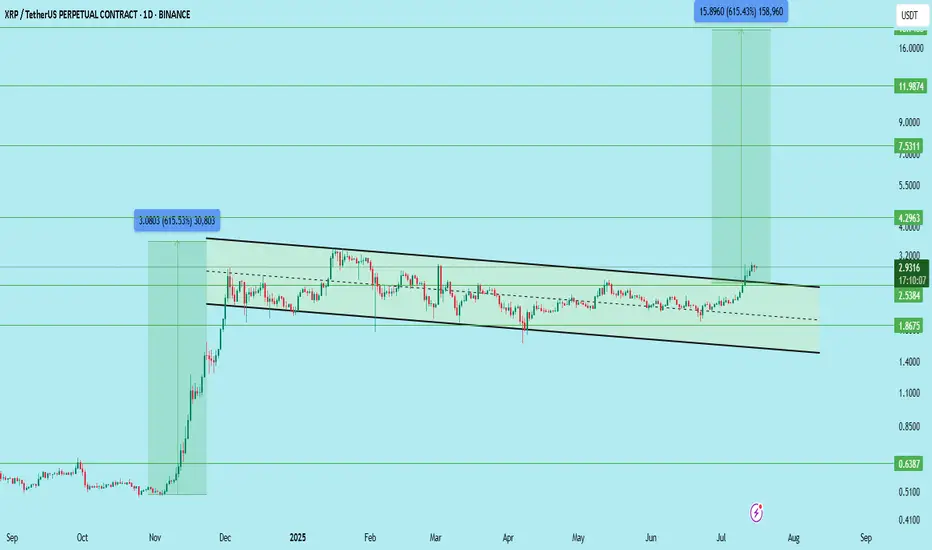
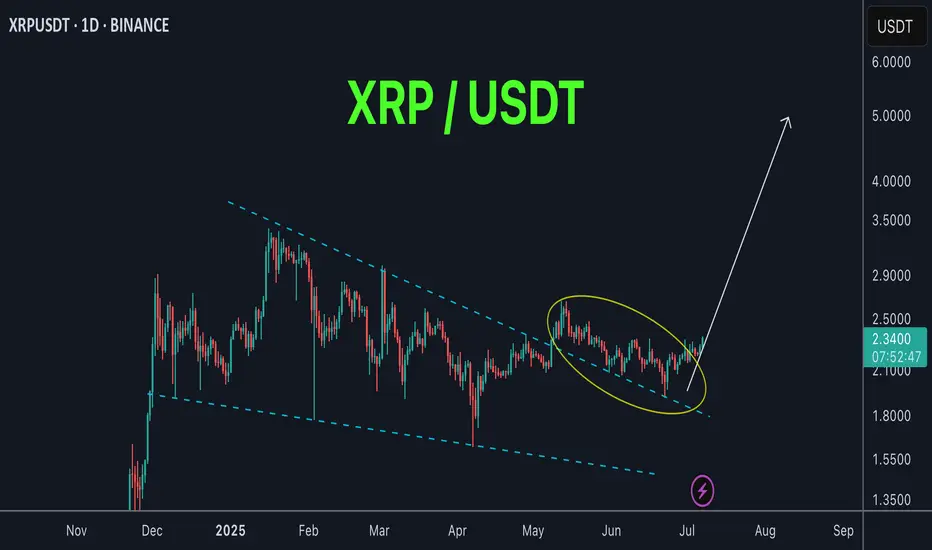
$XRPUSDT LONG TERM SETUP for SPOT !!CRYPTOCAP:XRP has officially broken out of its long-standing descending channel on the daily timeframe.
This is a major structure breakout and opens the door for a big move, but patience is key. Wait for a clean retest before entering the trade.
Trade Setup:
Entry (Ideal Retest Zone): $2.53 – $2.75
Stop Loss: Below $2.38
Resistance/Support Zones:
Immediate Support: $2.53
Resistance Levels: $4.29 / $7.53 / $11.98 / $18.00
Targets (Long-Term):
TP1: $4.29
TP2: $7.53
TP3: $11.98
TP4: $18.00
Potential Profit: Over 500%+ if it plays out fully
This is a long-term breakout structure — don’t rush. Wait for confirmation on the pullback.
DYOR | Not Financial Advice
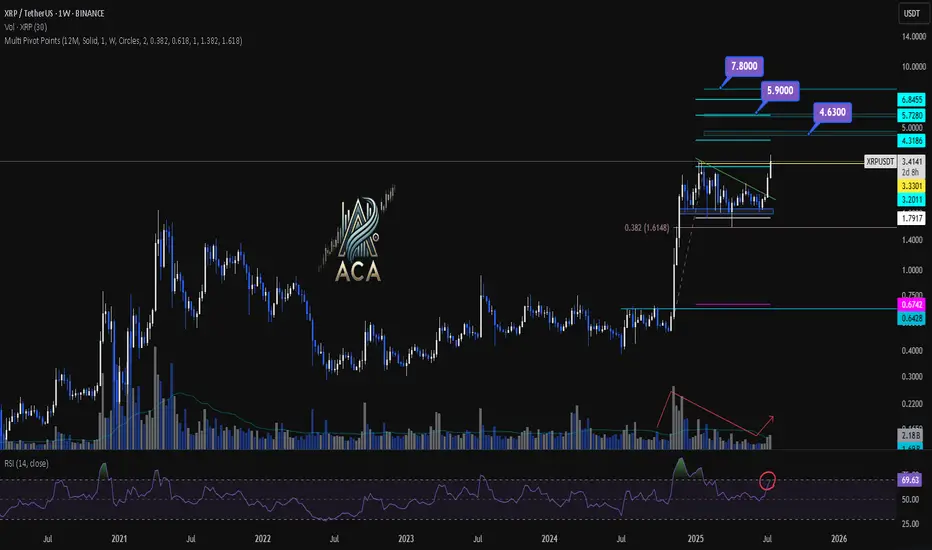
XRPUSDT Weekly Chart Analysis | Next Bullish MoveXRPUSDT Weekly Chart Analysis | Major Resistance Levels Align for Next Bullish Move
🔍 Let’s break down the XRP/USDT weekly setup, highlighting key technical signals and major upside targets for the next rally.
⏳ Weekly Overview
The weekly chart shows consolidation just below a major resistance, with price action tightening and preparing for a breakout. A recent correction found support near the 0.382 Fibonacci retracement level, which has acted as a springboard for renewed momentum. Notably, the R2 pivot point level aligns closely with this area, strengthening its importance as a decision zone for bulls.
🔺 Upside Targets & Confluences:
- First Target: $4.63 — This coincides with the R2 monthly pivot point and aligns with key Fibonacci extension targets, offering strong confluence for a reaction zone.
- Second Target: $5.90 — Our most realistic medium-term target, also backed by cluster resistance from both pivot analysis and fib projections.
- Final Target: $7.80 — This is the major Fibonacci extension level, marking the highest projected upside if momentum persists.
📊 Key Technical Highlights:
- Pivot Point R2 & Fibonacci Confluence: The R2 level reinforces a critical resistance, overlapping with the $4.63 Fibonacci target.
- Fibonacci Retracement: Price respected the 0.382 retracement during the latest correction, signaling healthy trend continuation.
- Volume Confirmation: An uptick in volume confirms that buyers are stepping in, supporting the bullish momentum.
- RSI Signal: RSI is entering the overbought zone, which typically indicates a strong surge in buying pressure and can mark the start of a momentum move.
🚨 Conclusion:
XRP is setting up for a major breakout as key technical levels align. Watch for a sustained move above $4.63 to unlock the $5.90 area, with a final potential push towards $7.80 if bulls maintain control. Volume expansion and an overheated RSI are both classic signs of an incoming momentum wave—keep your eyes on these levels for validation of the setup.
Setupsfx_ | XRPUSDT: Time For Strong Bullish Price Distribution!As previously described, the price bullish reversal did exactly that. The price has moved nicely, and this may be just the beginning of a bigger move. Long-term, we believe XRP will hit a record high, possibly even surpassing $4.
Please use accurate risk management while trading XRP.
Good luck and trade safely!

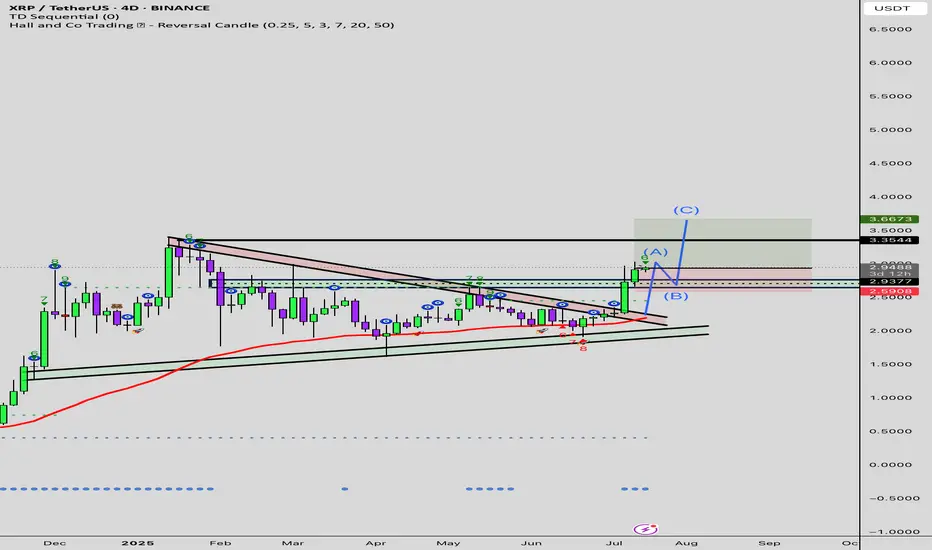
Be careful with RIPPLE !!!The pennant pattern has been broken, and the price follows an AB=CD pattern, targeting a rise above the 5 dollar.
Best regards CobraVanguard.💚

XRP's situation+ Target PredictionThe XRP is in a Bullish phase by a Falling Wedge Pattern.
A falling wedge indicates the potential for price to reach to $3.
Note if the PRZ ZONE is broken downwards with the strength of Bearish candles , this analysis of ours will be failed.
Best regards CobraVanguard.💚

XRP rally to $8.50After XRP broke above the resistance at $1.80 now that became the major support for the past few months and XRP is taking off again.
According to this huge monthly triangle and calculate from the breakout, so the next target for XRP is $8.50 for the coming months.

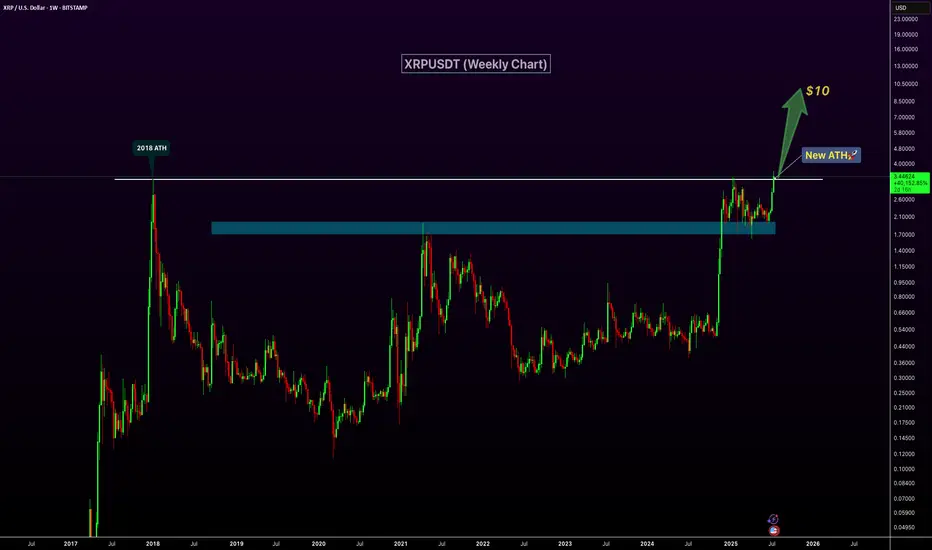
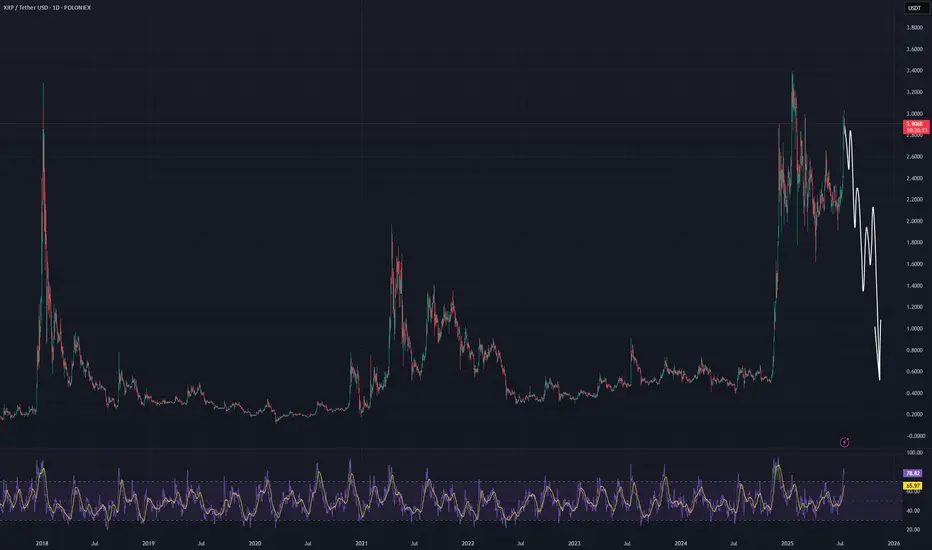
XRP Breaks 2018 High – New ATH Confirmed!XRP has officially broken above its 2018 peak, signaling a major bullish breakout and printing a new all-time high on the weekly chart. The previous resistance zone around $2.6–$3 has now flipped into strong support, confirming the strength of this move. With increasing volume and momentum behind the rally, XRP appears well-positioned for continued upside. The next key psychological target lies at $10, and current price action suggests a clear path toward that level. If bullish sentiment continues, this breakout could mark the beginning of a significant new uptrend.
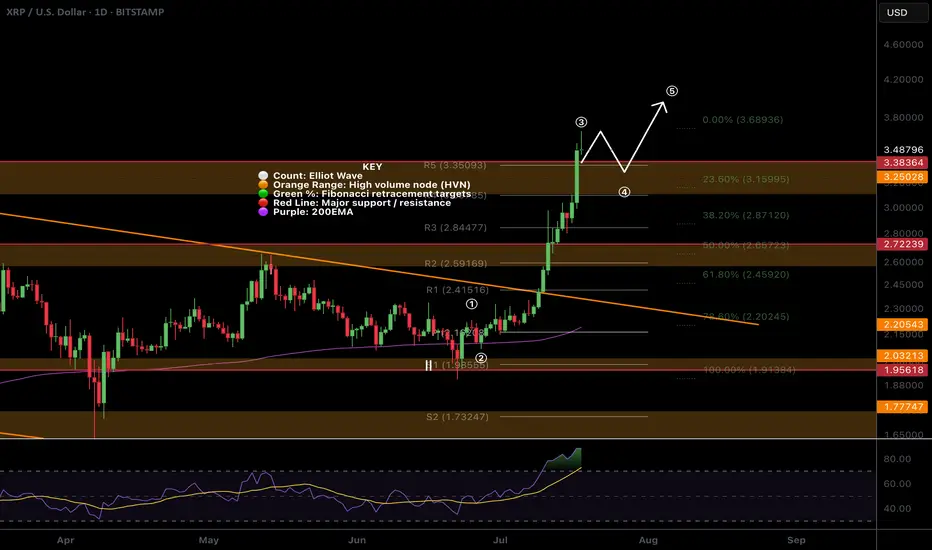
$XRP All time high! Time to sell or...?CRYPTOCAP:XRP appear to have completed wave 3 with a poke above all time high, typically this os behaviour of a wave 5.
The daily R5 pivot point has been breached so there is a significant chance of a decent pullback now but I wouldn't bet against the trend!
Wave 4 could be shallow, targeting the previous all time high, High Volume Node with waver 5 completing near $4.
Daily RSI is overbought but no bearish divergence yet which will likely emerge during wave 5.
Safe trading
Four Failed Breakouts… Then the Real One HitThe $2.22 level stopped XRP dead in its tracks four times.
Each failed breakout built more pressure — and when it finally cleared, price exploded.
Now it’s trending clean, breaking structure after structure.
This is what a proper breakout looks like.
#XRP #XRPUSD #BreakoutTrading #ChartPatterns #FailedBreakout #CryptoSetup #BacktestEverything #TradingView #QuantTradingPro

XRP new movement soon !XRP / USDT
XRP is on a long retest after breakout of accumulation zone weeks ago
successful retest here will result in strong bullish rally !
Keep an eye on it in the coming days 👀
XRP/USD (RIPPLE) BUYtitle: XRP/USD (RIPPLE) BUY
Asset: Crypto
Symbol: XRP/USD
Market Entry Price 1: $2.9450
Limit Entry Price 2: $2.7450
Stop Loss: $2.6450
Take Profit 1: $3.145 (close 10%)
Take Profit 2: $3.345 (close 25%)
Take Profit 3: $3.645(close 50%)
Take profit 4: $3.845 (close 75%)
Let any remaining Xrp run risk free
Check support above 2.5102-2.6013
Hello, traders.
If you "Follow", you can always get new information quickly.
Have a nice day today.
-------------------------------------
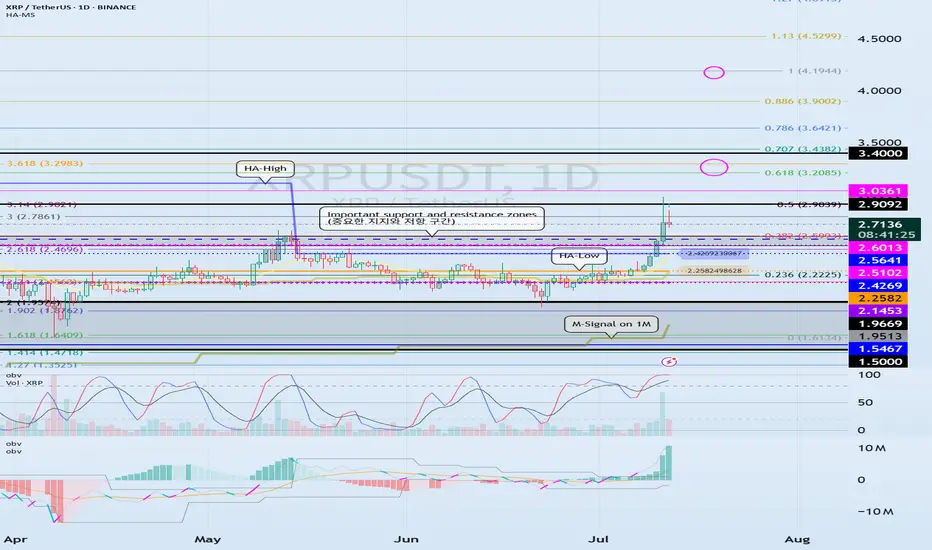
(XRPUSDT 1D chart)
It has broken through the important support and resistance zone.
Accordingly, the key is whether the price can be maintained above 2.5102-2.6013 and rise.
If the price is maintained above 2.5102-2.6013, it is possible that a stepwise rise will occur.
At this time,
1st: Right Fibonacci ratio 0.618(3.2085) ~ Left Fibonacci ratio 3.618(3.2983)
2nd: Right Fibonacci ratio 1(4.1944)
You need to check for support near the 1st and 2nd above.
The strong support area is 1.5-1.9669.
----------------------
The left Fibonacci ratio was drawn in the initial rising wave, and the right Fibonacci ratio was drawn in the recent rising wave.
Therefore, if the price rises above 3.618(3.2983) of the Fibonacci ratio drawn in the initial rising wave and maintains it, there is a high possibility of creating a new wave.
Since the Fibonacci ratio is a tool for analyzing the chart, it is not good to use this point as a support and resistance point.
Therefore, we need to check whether the DOM(60) indicator or the HA-High indicator is newly created and create a response strategy depending on whether there is support.
Currently, the DOM(60) indicator is formed at the 2.5102 point, and the HA-High indicator is formed at the 2.4269 point.
The basic trading strategy is to buy near the HA-Low indicator and sell near the HA-High indicator.
However, if it receives support in the HA-High ~ DOM(60) section and rises, it is likely to show a stepwise upward trend, and if it receives resistance in the DOM(-60) ~ HA-Low section and falls, it is likely to show a stepwise downward trend.
Therefore, trading begins by checking whether there is support in the DOM(-60) ~ HA-Low section and the HA-High ~ DOM(60) section.
-
Thank you for reading to the end.
I hope you have a successful transaction.
--------------------------------------------------
- Here is a description of the big picture.
(3-year bull market, 1-year bear market pattern)
I will explain more details when the bear market starts.
------------------------------------------------------
Why XRP Holders Are About to Get Super Rich!I believe XRP is heading into a mass adoption cycle—something even bigger than what Bitcoin saw in 2021. We’re looking at a truly sustainable growth pattern fueled by a longer accumulation phase and crypto being adopted and invested in by major institutions.
This means we could see XRP skyrocket to $22 as my lowest target— and potentially even well over $100 per coin . This coin is truly ready for massive things. Be prepared!
Let me know what you think: Will XRP crash? Or is it heading for mass adoption? Share your thoughts in the comments below.
As always, stay profitable,
– Dalin Anderson

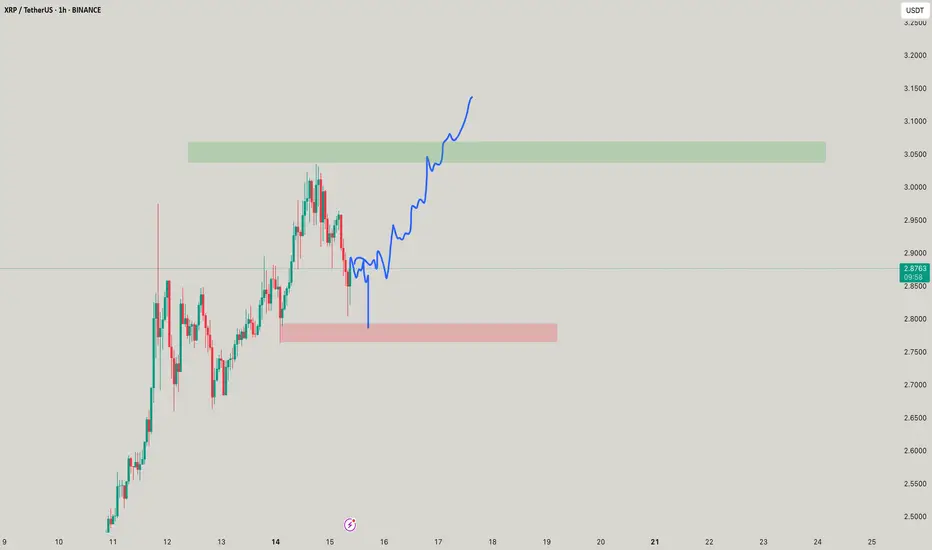
#XRP Update #2 – July 15, 2025#XRP Update #2 – July 15, 2025
XRP had previously completed the correction of its first impulsive move. Now, it has also completed the correction of the second impulsive leg. The current target for XRP stands around the $3.15 zone.
However, before reaching that level, it first needs to break through the $3.00 resistance area, which previously acted as a strong support/resistance zone. If XRP fails to gain enough volume and momentum for a strong breakout, there is a risk it may reverse from this level, potentially forming a double top pattern.
Because of this uncertainty, I do not recommend taking a long or short position on XRP at this stage.

LIVE TRADE (XRP)Hello friends🙌
🔥Here we are with live trading Ripple, please follow capital management.
📈Given the resistance break, we can enter a buy trade and move with it to the specified targets.
🔥Follow us for more signals🔥
*Trade safely with us*

Ripple buy signalHello friends
Given the good growth we had, we entered a deep correction, and now we have the opportunity to buy step by step in the specified support areas with capital and risk management and move with it to the specified targets.
*Trade safely with us*

Xrp:The fate of Ripple in the long termhello friends👋
After a good price growth that we had, you can see that the buyers gradually exited and a triangle pattern was formed.
Now, according to the specified support, it should be seen whether buyers support Ripple or not...
You have to wait and nothing can be said until the failure of the pattern, but we suggest that you buy step by step with capital and risk management in the identified areas that are very good supports and move to the set goals.
And in the end, we must say that don't forget that we are in a strong upward trend, that the probability of the continuation of the Bister trend is the possibility of a fall...
🔥Follow us for more signals🔥
*Trade safely with us*

#XRP/USDT - SHORTThe chance that the asset will reach the $5 level is extremely low. This is indicated only by the 3-month timeframe. The rest of the data suggests that the movement will be in one direction.
(Not an investment recommendation).
$XRP All Tie High After Shallow Pullback?CRYPTOCAP:XRP had a fantastic week smashing all resistances. I am looking for a shallow pull back to test the High Volume Node support at $2.7 at the .236 Fibonacci retracement before continuing to challenge the all time high.
Wave (3) of a motif wave appears complete adding confluence to a shallow retracement for wave (4).
Daily RSI is extremely overbought.
Safe trading

Make WAYYYY for !!! ~~ XRPPP!! ~$3.1?XRP as suggests moves if it doesnt breaks the red box or just pukes below, eitherways looks strong enough
XRP $6.5, $9.5, $12.5 & $15.5 · Which One?XRP broke a small local downtrend and managed to close above a small resistance zone around $2.76. It managed to do this on a full green candle with rising volume.
XRPUSDT weekly is currently trading above all moving averages, extremely bullish: MA200, EMA377, EMA233, EMA89 and the rest.
If we look at a bull market cycle as a series of three steps, we have the first two missing the last one. Compare current action with 2021 while noticing the 1,2,3 numbers on the chart. This leaves us wondering about the next target: How high can XRP go in its next bullish move?
It seems something extraordinary is brewing behind the scenes, I can feel it. What we've been saying all along but rather than just words, a new feeling came up. "It is not the same to live through an event vs talking about it." That kind of feeling.
I can continue to say that market conditions are extremely positive now especially when we compare it to several years ago. But we have not seen the effect this positive conditions will have on the market, the price of the different projects and the charts, but we are getting close.
XRP has big plans and continue to grow, expand and evolve.
The 2021 bull market from bottom to top produced more than 1,800%. In 2025, if we start counting from the July 2024 low, a target of $6.50 would mean a total of ~1,585% growth. Market conditions are better now so we can aim higher, expect more.
A target of $9.51 sounds great, this would mean a nice ~230% from current price and from the same low as before, a total of ~2,400%. This sounds better but we can do more.
The next two targets based on an extension of the current trend would lead to $12.5 and $15.5. I'll let you calculate the potential yourself.
$6.5, $9.51, $12.5 or more; whatever the market ends up giving us, we are happy to be part of this adventure and we are always grateful for the amazing results.
Aim high. I will be here reading the charts live when we are getting close to the top. There will be time to sell, time to adapt, time to decide. There will be enough time for everything if you start now. Prepare now and success is yours.
We are early for the last phase of the XRP 2025 bull market. The first half is in, we are due the second half; it will be great.
Namaste.

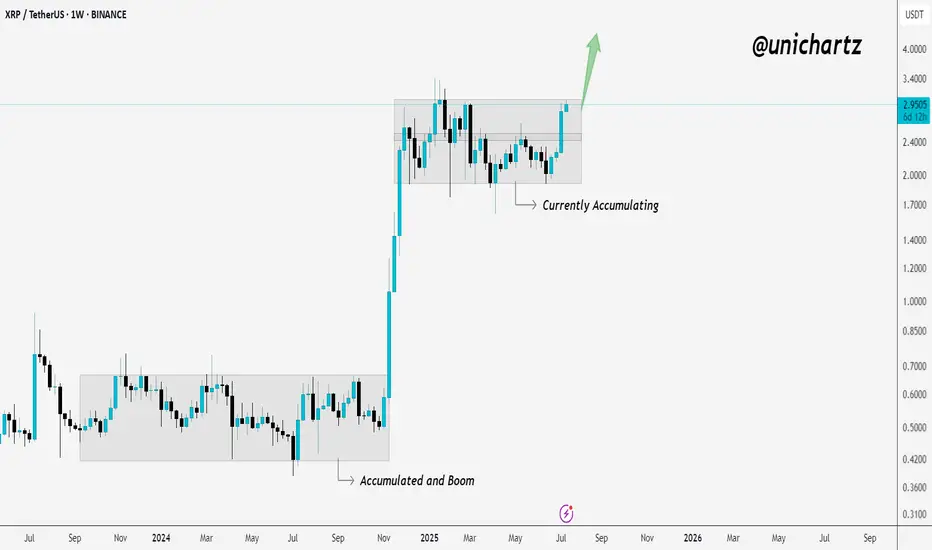
Accumulation Ending? XRP Showing Signs of BreakoutXRP is in the process of breaking out of its weekly accumulation range.
The last time we saw this kind of structure — it led to a massive move.
Now, price is pushing toward the top of the zone again… and momentum is picking up.
If it closes strong above this level, it could trigger the next big leg higher.
Stay alert — this could be the start of something big!