XRP Moves Forward—How To Maximize Profits, Aim At $4.5 Or Higher5-June gave us the confirmation for a higher low.
8-June is telling us the continuation of the bullish move is true. XRP moves forward.
How are you doing my friend in this beautiful Sunday?
I hope you are doing great.
The bottom happened 7-April, the peak happened 12-May.
24 Days for the retrace to be completed, between 12-May and 5-June.
It's been 27 days since we last saw some bullish action, almost an entire month.
I fully understand how people become bored, it is just too long, the market never moves straight up. But this can be taken in different ways. If the market were to move straight up, there is no chance to adapt, to recover, to plan and to learn. Now that the market made a full pause, we are ready for a new wave of growth and this time we can maximize profits on the way up.
How to maximize profits?
Hold strong. Hold long. Wait for higher targets.
Let's revisit the targets and how to approach them.
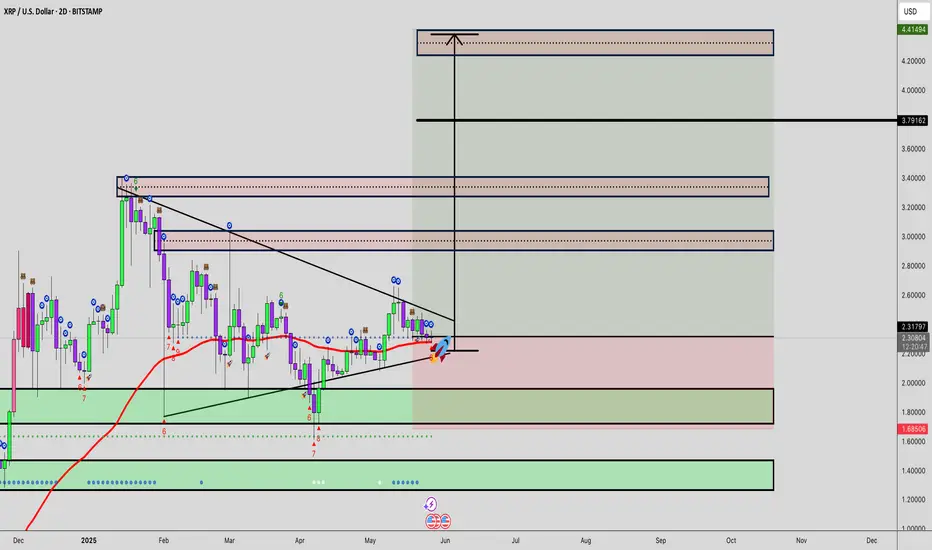
The "selling for profits" strategy where we sell a portion at each target is for blind traders. This method is used when we are trading with a high level of uncertainty about the next wave top. This method we can ignore here because we know where prices are headed next. To maximize profits with XRPUSDT, ignore $2.71, ignore $3.02, ignore the new ATH and aim straight at $4.51 with your full position with high lev. That's how to maximize profits.
Take some profits at this level only to buy more when the next retrace shows up. We are going higher, so you can keep on holding and wait for $6 or more. While we ignore the lower targets, when prices are higher we do not ignore them anymore. It doesn't matter how far up it goes, but we have to be careful after reaching $4.4.
Aim high because we are going high. The market is preparing for several months of sustained growth. Some of the older projects, mid-size and small size based on market cap., are showing signals of an entire year of bullish action ahead. It is not yet confirmed, but if it happens, this will be the biggest and best bull market in the altcoins history. A very big one.
For example, XRP peaks early because it started early and we get maximum profits from this pair. When the correction starts for XRP, the rest of the market continues growing. We can move capital from this pair to smaller pairs. And there will be thousands of those.
While XRP can grow 50% in a matter of weeks or months, a small pair can grow 150% in a single day. We have to take advantage of the big and the small ones. Diversification.
If you enjoy the content, consider follow.
Thanks for the continued support.
I'll see you at the top.
Namaste.
XRPUSDT

XRPUSDTHi snipers. We are witnessing good news regarding XRP. The price has also grown well in the one-day timeframe and has reached a sensitive point. If it breaks and crosses the (black) moving average line, we will witness another price jump. I am learning and practicing. This is not a trading offer.

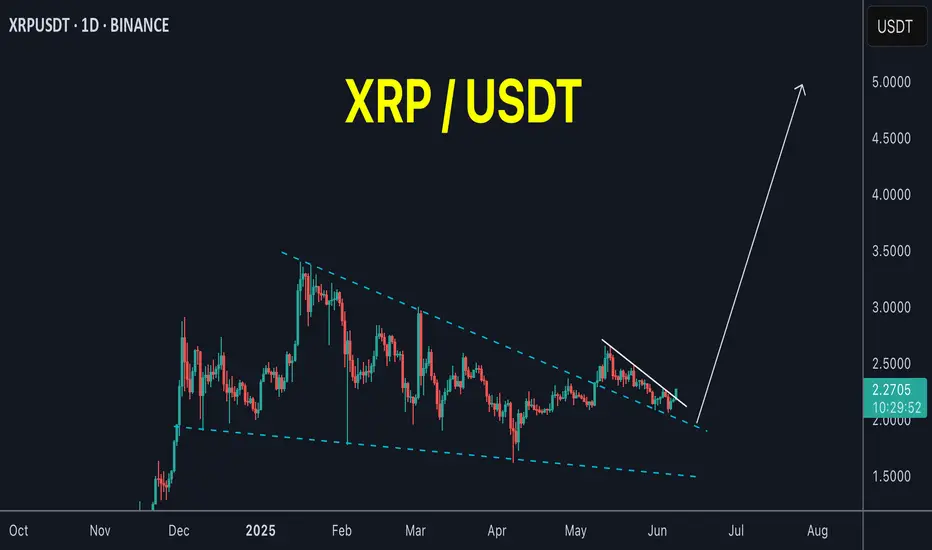
XRP is preparing for breakout !XRP / USDT
Xrp is forming small flag pattern above previous big accumulation zone
Looks like a breakout could happen soon
Keep an eye on this chart and trade / follow accordingly
Best of wishes
XRP Back on the MENU! XRPUSD Ripple next move? XrpUsdtIt's been a while since we looked at this chart.
🌍 SeekingPips 🌎 View remains the same and so we are strictly looking for strategic LONG entry points in
TIME & PRICE. 👌
Yes it's a WEEKLY chart and I understand that many of the trigger happy TRADERS or in some cases GAMBLERS can't stand to look at anything longer than a 30 minute chart BUT really sometimes you really just have to STEP RIGHT BACK to see the BIGGER PICTURE👍
✅️This week's candle CLOSE really has the potential to setup the next few weeks for easy MULTIDAY TRENDING MOVE TRADE SETUPS 👍
ℹ️ Note the price location on what we viewed as a HTF FLAG MANY WEEKS AGO .
Yes it was breached both sides but 🌎SeekingPips🌍 doesn't trade the patterns themselves but the HUMAN PSYCHOLOGY AROUND THESE PATTERNS.🤔
ℹ️ Note where most of the volume has been trading and also note the moves around the extreems of the dead patteren too.💡
In an even higher TIMEFRAME THE FLAG would still be valid and forming the flag itself too.
📊 [ b]CHECKOUT the MONTHLY chart for the example. 📉
Anyway we will see what the next 48 hours🕦 hold but no doubt this one is on our RADAR this week.
✴️ 2.048 to hold otherwise a potential for current low of this year to be tested.
✴️ Alternatively if support starts to form on the 240min chart at current levels last weeks high could expected to be tested
✴️ if so Xrp could easily give a multiday upside trending move.
Now like a NINJA we wait and stalk...
As always ladies and gentlemen whilst Seeking Pips 🌍 SeekingPips 🌎 says
" NO TRIGGER NO TRADE"
& "STICK TO YOUR PLAN"✅️
👍 Have a GREAT WEEK and we will see you soon with an UPDATE...

XRP Looking Better But... Mixed. Comment, Support Me!XRP is looking much better now. It closed four days green after a higher low but something is off.
I mean, it is good you can see the chart the rising channel but I am sensing some weakness. There is zero volume.
Normally, when the retrace ends and produces a higher low there is always at least a small spike in volume. But, it can happen that there is no volume because it is early and there will be long-term growth and so volume only shows up when resistance is being removed.
Since doubt can creep upon us we focus on the price and the chart.
Higher low the bears showed no strength with several days green we can see prices continue to increase. Let's keep it easy.
Set at stop below $2.07 and go all-in. Do what you think is right already LONG on XRPUSDT since 30-May. We have to wait and see for the market to produce the results.
I mean, what is your take?
You are an expert too give me something, give me something in the comments because it is not an easy chart but it is clearly pointing higher. The problem is that sometimes the chart signals are fake.
Leave a comment with your view.
Thank you for reading.
Namaste.

XRP Bullish, The Retrace is Over! Aim HighWhat we need to consider here is the size and duration of each move.
The rise from 7-April through 12-May amounts to 64%.
The retrace from 12-May to present week amounts to 24%.
» So the retrace is more than a third part the size of the advance.
The rise lasted 6 weeks.
The retrace so far has 3 weeks.
» So the retrace is half the length of the rise.
Both these readings are super standard for a bull market. A retrace can easily end this week or early next week followed by 2-3 months of growth. Within this new wave of growth, there will be other retraces but a correction only comes at the end of the main wave. After the correction comes another advance and then a bear market.
Ok. We have a higher low and the chart is pointing up.
After three weeks of bearish action there is no sellers pressure, trading volume is really low.
The bears have no steam, no force, no momentum; the bears are gone.
Knowing this, we can aim high...
The retrace is over!
Thanks a lot for your continued support.
Namaste.

This isn’t distribution. It’s preparation.XRP has spent the last sessions consolidating just under a 15M OB — not failing, just gathering energy. Most traders confuse rejection for weakness. Smart Money sees opportunity.
What matters:
We’ve got stacked 15M OBs above 2.2544 and 2.2805 — liquidity zones that will either break or sweep
Price just tapped the local low while holding above volume cluster support
If we reclaim the midrange and hold above 2.2400, the setup for expansion into 2.2805 is in play
Lose 2.2348? Expect a deeper rotation to the 2.1862 demand zone
There’s no need to predict here. Just follow structure. Volume confirms intent, and the reaction around these OBs will dictate the next leg.
Execution:
Reclaim 2.2544 → long toward 2.2805
Clean breakdown? Step aside and re-evaluate near 2.19
Bias is bullish unless 2.2348 gets invalidated with conviction
You don’t need more signals. You need fewer distractions. The chart is already speaking.
More like this? Setup-first, noise-free — check the profile description.

It wasn’t a breakout. It was a sweep.BINANCE:XRPUSDT.P didn’t rally to trend — it rallied to rebalance. The high at 2.2744 was always a liquidity draw, not a destination. Now that the market has taken what it needed, we trade the reaction — not the impulse.
Here’s how this unfolds:
Price tapped into a clean 1H OB and immediately rejected
Below that, we’ve got confluence between OB + FVG zones around 2.2220 and 2.2070 — that’s the re-entry window
Fibonacci levels reinforce the structure:
• 0.5 at 2.2287
• 0.618 at 2.2180
• 0.786 near 2.0266 — last line before deeper rotation
If price holds above the OB and starts to consolidate into a bullish MSS, I expect a rotation back toward the premium wick at 2.2744 — maybe even higher depending on volume profile buildup.
But if we lose 2.2070 decisively, all eyes go to 2.1697 and then 2.1831 — where the real volume sits.
Execution bias:
Accumulation above 2.2070 → bullish continuation valid
Break and hold below? Reversion into deeper discount zones likely
Targeting the sweep of 2.2528 and eventual test of 2.30+ if structure confirms
The move isn’t over. It’s transitioning. You either read the shift or get caught in it.
More setups built on narrative and price logic? They’re in the profile description. I don’t chase — I position.

Price delivered the signal — now it’s time to follow structure.XRP isn’t reacting randomly. It’s responding to engineered inefficiencies and prior OBs that most overlook. What looks like resistance to others is just a staging ground for continuation.
Here’s the play:
Price ran into the 1H OB at 2.2219 — hesitation here was expected
We’re now pulling back into the equilibrium zone, anchored by 0.382–0.618 fib (2.1886–2.1680)
This zone also aligns with the previous 1H OB — an accumulation base that already proved itself
If price holds above 2.1533 and shows rejection at the 0.5 fib (2.1783), I expect the next leg to take out 2.2219 and push toward the 4H OB.
Execution thesis:
Ideal long re-entry is in the 2.18–2.16 zone
Invalidation below 2.1346
Targets: 2.2476 → 2.3107, with 2.2219 as first test
This isn’t about chasing highs. It’s about aligning with structure and letting the draw on liquidity do its work.
Want more trades delivered with this level of clarity? The account description has them. I don’t forecast with hope — I forecast with models.

XRP Repeating 2024 Setup? Monitor the RangeCRYPTOCAP:XRP is once again in a familiar phase — accumulation. After its previous range-bound phase led to a powerful breakout, we’re now seeing a similar structure forming on the weekly chart.
The price is consolidating within a clear range, showing signs of strength but awaiting a breakout to confirm the next move. History suggests this kind of accumulation can often lead to explosive upside — but patience is key here.
📌 Key takeaway: Until a clean breakout occurs, it’s best to observe, not chase. Keep your eyes on the upper range boundary for confirmation.
Let the market come to you.
DYOR, NFA
Thanks for following along — stay tuned for more updates!

They waited for confirmation. I bought the retrace.XRP didn’t reverse. It refined.
After reclaiming the rounded base and pushing into a 1H OB, price rotated perfectly into the 0.5 retracement at 2.1419 — tagging the breaker wick, respecting structure, and front-running the deeper 0.618 by a hair.
This isn’t weakness. It’s an engineered dip into fresh demand. Smart Money logic doesn’t require “green candles” — it requires imbalance filled and structure respected. That’s exactly what we have here.
Now, price is boxed between two intentions:
If we hold 2.1419, the draw becomes the 1H OB above — 2.1758 to 2.2060.
If we break that level with conviction, 2.1268–2.1052 will serve as the next rebalance zone before any macro continuation.
Execution tier:
✅ Long bias above: 2.1419
🎯 Target 1: 2.1758
🎯 Target 2: 2.2060
❌ Invalidation: Clean 1H body close below 2.1268
Retail waits for signals.
Smart Money builds in silence — and exits with intent.

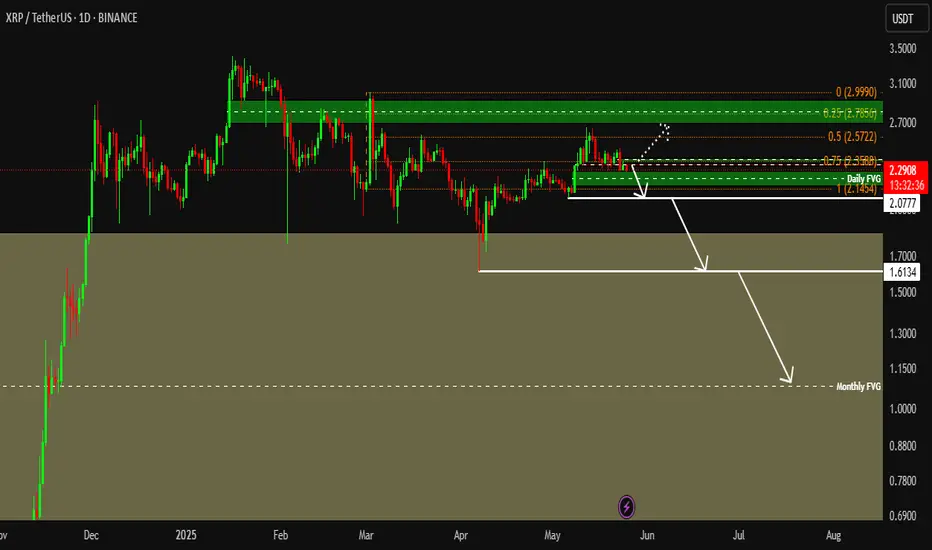
Support Zone: 2.1453-2.2582
Hello, traders.
If you "Follow", you can always get the latest information quickly.
Have a nice day today.
-------------------------------------
(XRPUSDT 1D chart)
The most important thing on the current chart is whether the price can hold above the previous ATH zone.
That is, can the price be maintained above the 1.5000-1.9669 range?
In order for an uptrend to begin, it is expected that the price will have to rise above the important support and resistance range of 2.6013 to start.
-
Currently, the channel of the High Line ~ Low Line of the OBV indicator is forming an uptrend channel.
We need to see if the uptrend channel can be maintained.
-
The 2.1453 point is the DOM (-60) indicator point, which corresponds to the low point range.
The key is whether it can receive support at this point and rise above 2.2582.
If not, it is expected to fall to the previous ATH range.
-
Thank you for reading to the end.
I hope you have a successful trade.
--------------------------------------------------
- This is an explanation of the big picture.
(3-year bull market, 1-year bear market pattern)
I will explain more details when the bear market starts.
------------------------------------------------------

XRP's Potential Path: A June Surge and a 2040 Vision The world of cryptocurrency is a realm of constant motion, characterized by breathtaking innovation, fervent communities, and, undeniably, significant price volatility. Among the many digital assets vying for attention and adoption, XRP stands out with its clear focus on revolutionizing cross-border payments and its long-standing, often tumultuous, relationship with regulatory bodies. Investors and enthusiasts alike are perpetually analyzing its next potential move, from short-term price surges to ambitious long-term valuations.
This article delves into two distinct yet interconnected facets of XRP's potential trajectory. First, we will explore four plausible catalysts that could ignite a significant, perhaps even 50%, price surge for XRP in the upcoming month of June. Following this near-term speculation, we will broaden our horizon to the year 2040, contemplating what XRP's price might look like and whether holding it could realistically pave the way for individuals to achieve the dream of quitting their traditional 9-to-5 employment. It is crucial to preface this exploration with a clear understanding: all cryptocurrency investments carry inherent risks, and future predictions, especially long-term ones, are speculative by nature.
Part 1: Four Potential Catalysts for a 50% XRP Surge in June
June is often a dynamic month for financial markets, and the cryptocurrency sphere is no exception. For XRP, several specific factors could converge to create a potent bullish environment, potentially driving its price upwards by a significant margin. While a 50% surge in a single month is ambitious, it's not unprecedented in the volatile crypto markets, especially for an asset with XRP's history and dedicated following.
1. Landmark Progress in the SEC Lawsuit
The most significant shadow looming over XRP for the past several years has undoubtedly been the lawsuit initiated by the U.S. Securities and Exchange Commission (SEC). This legal battle has created immense uncertainty, deterring some institutional investors and suppressing XRP's price performance compared to peers that enjoy greater regulatory clarity in the United States.
However, June could bring a pivotal development. Imagine a scenario where the courts deliver a summary judgment ruling that is overwhelmingly favorable to Ripple, the company most closely associated with XRP. This could involve a definitive statement that XRP, in its current form or in secondary market sales, is not a security. Alternatively, a settlement between Ripple and the SEC could be reached – one that the market perceives as a net positive for Ripple, perhaps involving a manageable fine and clear guidelines for future operations without crippling XRP's utility.
Such a breakthrough would be monumental. The removal of this regulatory overhang could unleash a torrent of buying pressure. Exchanges that delisted or halted XRP trading in the U.S. might swiftly relist, opening up a massive market. Institutional investors who have been waiting on the sidelines for legal clarity could finally enter, bringing substantial capital. The psychological impact alone would be immense, shifting sentiment from cautious to overtly bullish. In this environment, a 50% price surge, or even more, driven by relief, renewed confidence, and fresh capital inflows, is a distinct possibility.
2. Major Institutional Adoption or RippleNet Expansion
Beyond the courtroom, Ripple continues to build and expand its network, RippleNet, which leverages XRP for its On-Demand Liquidity (ODL) service to facilitate faster and cheaper cross-border payments. While progress has been steady, a blockbuster announcement in June could act as a powerful price catalyst.
Consider the possibility of a leading global bank, a household name in international finance, publicly announcing a strategic partnership with Ripple to utilize ODL for a significant payment corridor. Or perhaps a consortium of financial institutions in a major economic region declares its intention to adopt Ripple's technology, with XRP at its core. News of this magnitude would provide tangible proof of XRP's real-world utility and its potential to disrupt the traditional correspondent banking system.
Such an announcement would not only drive direct demand for XRP as ODL volume increases but also serve as a powerful validation of Ripple's business model. It would signal to the broader market that XRP is not just a speculative digital asset but a functional tool solving a multi-trillion-dollar problem. The narrative would shift towards adoption and utility, attracting investors focused on long-term fundamentals. This kind of news has historically moved XRP's price, and a sufficiently impactful partnership could easily fuel a 50% rally as the market recalculates XRP's potential market share in global payments.
3. A Resurging Altcoin Market Fueled by Broader Crypto Momentum
The cryptocurrency market often moves in waves, with Bitcoin typically leading the charge. When Bitcoin experiences a strong bullish phase, it tends to lift the entire market, eventually leading to what is known as an "altseason," where alternative cryptocurrencies (altcoins) like XRP see outsized gains as capital rotates from Bitcoin into higher-risk, higher-reward assets.
If June witnesses a significant Bitcoin rally, perhaps driven by macroeconomic factors, new institutional products, or positive regulatory news affecting the entire sector, XRP could be a prime beneficiary. Historically, XRP has demonstrated a tendency to make sharp, aggressive moves once broader market sentiment turns decisively bullish. It possesses a large, dedicated community and significant name recognition, making it a go-to choice for many investors looking to capitalize on altcoin rallies.
A 50% surge in this context would be a function of overall market exuberance. As "fear of missing out" (FOMO) kicks in, liquidity pours into the market, and assets like XRP, which may have underperformed during market consolidation phases, can quickly catch up and even outperform. If the broader crypto tide rises strongly in June, XRP is likely to be carried along with it, potentially reaching and exceeding that 50% gain threshold.
4. Significant Technical Breakout and Renewed Trader Sentiment
Financial markets, and particularly cryptocurrency markets, are heavily influenced by technical analysis – the study of price charts and trading volumes to predict future price movements. XRP's price chart currently shows several key long-term resistance levels. These are price points where selling pressure has historically overcome buying pressure, capping rallies.
A scenario where XRP decisively breaks above a critical multi-month or even multi-year resistance level in June could act as a powerful technical catalyst. Such a breakout often signals to traders that the previous downtrend or consolidation phase is over and a new uptrend is beginning. This can trigger a cascade of buying activity:
• Algorithmic traders: Automated systems programmed to buy on such breakouts would activate.
• Momentum traders: Those who follow trends would jump in, anticipating further upside.
• Retail investors: Seeing a strong upward move and positive commentary from technical analysts, many would enter the market, driven by FOMO.
This self-reinforcing cycle of buying pressure can lead to rapid price appreciation. A clean break above a well-established resistance, confirmed by high trading volume, would shift trader sentiment dramatically. The narrative would change from "XRP is stuck" to "XRP is finally on the move." In the world of crypto, where sentiment and momentum play such crucial roles, a technical breakout of this nature could readily propel XRP towards a 50% gain as it seeks new, higher price ranges.
Part 2: XRP Price Prediction for 2040: A Pathway to Quitting the 9-to-5?
Shifting our gaze from the immediate horizon of June to the distant future of 2040 requires a different kind of analysis, one steeped far more in broad secular trends and ambitious possibilities than in specific, near-term events. Predicting the price of any asset, let alone a cryptocurrency, over a 15+ year timeframe is an exercise in informed speculation. However, by considering the fundamental goals of XRP and the potential evolution of the financial world, we can explore what might need to happen for XRP to reach a valuation that could allow its holders to achieve financial independence.
Factors Influencing XRP's 2040 Price:
For XRP to achieve a truly transformative price by 2040, several significant, long-term developments would likely need to occur:
• Global Adoption of Ripple's Payment Solutions: The cornerstone of XRP's potential long-term value lies in the widespread, global adoption of RippleNet and its associated services, particularly ODL. If, by 2040, Ripple's technology becomes a standard, or at least a major player, in facilitating international payments for banks, financial institutions, and multinational corporations, the demand for XRP as a bridge asset would be immense. This implies successfully navigating complex regulatory landscapes across dozens of countries and outcompeting both legacy systems and emerging alternatives.
• XRP as a Dominant Bridge Currency: Beyond RippleNet, XRP's utility as a neutral, efficient bridge asset between various forms of value – different fiat currencies, other digital assets, and potentially even Central Bank Digital Currencies (CBDCs) – would need to be firmly established. If CBDCs become prevalent, the need for interoperability and seamless exchange between them could create a significant role for assets like XRP.
• Comprehensive Regulatory Clarity and Supportive Global Frameworks: The current patchwork of crypto regulations globally would need to evolve into clear, supportive, and harmonized frameworks that recognize the utility of digital assets like XRP. This would foster greater institutional confidence and pave the way for mainstream integration.
• Overall Crypto Market Maturation and Growth: The total market capitalization of the entire cryptocurrency asset class would likely need to grow by orders of magnitude. If digital assets become a more integral part of the global financial system, the valuations of leading utility-focused projects like XRP could rise substantially.
• Sustained Utility and Network Effects: Continuous innovation within the Ripple ecosystem, expanding use cases for XRP, and strong network effects (where each new participant adds more value to the network) would be crucial. This includes the ongoing efforts of the XRP Ledger community to enhance the technology and foster new applications.
• Tokenomics and Scarcity: While XRP has a large total supply, if its utility drives consistent and growing demand, and if a significant portion of the supply is locked up in active use (e.g., in payment channels or DeFi applications on the XRP Ledger), relative scarcity could contribute to price appreciation.
What Price Would Enable Financial Freedom?
The dream of "quitting your 9-to-5" is deeply personal and depends entirely on an individual's financial needs, desired lifestyle, and the amount of XRP they hold. There's no magic price number for XRP that universally guarantees financial independence.
Let's consider some purely hypothetical scenarios, without suggesting these are likely outcomes:
• If an individual desires an annual income of $100,000 to live comfortably, and they aim for a conservative 4% withdrawal rate from their investments, they would need an investment portfolio of $2.5 million.
o If they held 100,000 XRP, the price of XRP would need to reach $25.
o If they held 1,000,000 XRP, the price would need to be $2.50.
• For a more modest early retirement, say needing $50,000 annually, the portfolio requirement would be $1.25 million.
o With 100,000 XRP, the price target becomes $12.50.
o With 1,000,000 XRP, the target is $1.25.
These are simplistic calculations. A truly transformative price for XRP, one that creates generational wealth for early adopters holding substantial amounts, would likely need to be in the double or even triple digits per token. This would imply XRP capturing a very significant share of the global cross-border payments market, a market valued in the tens of trillions of dollars annually.
It’s also important to consider that "quitting the 9-to-5" doesn't just mean cashing out a lump sum. If the XRP ecosystem evolves to offer reliable staking or yield-generating opportunities, holders might be able to earn a passive income from their assets without selling them, providing another path to financial independence.
The "Quit Your 9-to-5" Dream: Possibilities and Pitfalls
The allure of turning a modest crypto investment into a life-changing sum is a powerful motivator. For XRP, the vision of frictionless global payments is compelling, and if realized, could indeed propel its value to extraordinary heights by 2040.
However, the path to such a future is fraught with immense risks and uncertainties:
• Market Volatility: The cryptocurrency market is notoriously volatile. Even if the long-term trend is upward, there will likely be severe bear markets and periods of stagnation along the way.
• Regulatory Headwinds: While clarity is hoped for, adverse regulations in key jurisdictions could severely hamper XRP's adoption and value.
• Technological Disruption: The technology landscape changes rapidly. A new, superior technology for cross-border payments could emerge, displacing Ripple and XRP.
• Competition: Ripple faces competition from established players (like SWIFT, which is also innovating), other blockchain projects, and emerging fintech solutions.
• Execution Risk: Ripple's ability to execute its vision, build partnerships, and navigate global complexities is not guaranteed.
• Black Swan Events: Unforeseen geopolitical, economic, or technological events could dramatically impact the crypto market.
Therefore, while dreaming of a 2040 where your XRP holdings allow you to bid farewell to traditional employment is enticing, it must be tempered with a strong dose of realism. Relying on any single speculative asset for one's entire financial future is highly inadvisable. Diversification, continuous learning, and prudent risk management remain essential principles for any investor.
Conclusion: Navigating XRP's Present and Future
XRP stands at an interesting crossroads. In the near term, as we look towards June, specific catalysts like legal breakthroughs, major partnerships, broader market rallies, or technical breakouts could indeed provide the impetus for a significant price surge. The potential for a 50% gain, while speculative, is within the realm of possibility given the right confluence of events.
Looking further ahead to 2040, the vision for XRP is far grander, but also far more uncertain. Its ambition to reshape the landscape of global payments is immense. If it achieves even a fraction of this ambition, its value could be substantially higher. Whether this translates into "quit your 9-to-5" money for its holders depends on a multitude of factors, many of which are currently unknowable.
The journey of XRP, like that of the broader cryptocurrency market, will likely be a rollercoaster of triumphs and setbacks. For those invested, or considering an investment, it requires a blend of optimism for its potential and a clear-eyed understanding of the risks involved. Whether for a short-term trade or a long-term hold, due diligence and a sound investment strategy are paramount. The future of XRP is yet to be written, but its ongoing story is undoubtedly one of the most compelling in the digital asset space.
XRP (Daily) Complex Correction WXYXZXRP appears to have a complex correction underway with a series of ABCs in a descending channel after reaching all time high.
Price is just above the 61.8 Fibonacci retracement and high volume support node which is likely to test at $1.95.
Analysis is invalidated if price breaks above wave X swing high.
Ultimately it is trapped in a large range.
Safe trading

XRP/USD Crypto Profit Raid: Steal Gains with This Blueprint!🔥 Chart Heist Blueprint: Snag Profits in XRP/USD "Ripple vs U.S Dollar"! 🚀💰
Crafted for sharp traders ready to raid the XRP/USD "Ripple vs U.S Dollar" market, this sleek strategy fuses razor-sharp technicals with savvy fundamentals to maximize your gains. 📊🕵️♂️ Surf the bullish surge, but watch for traps in the Overbought Resistance Zone where bears could strike! 🐻 Lock in your loot before the tide turns. 🌊
- 🎯 **Entry Tactics: Hit the Sweet Spot**
- Long on pullbacks near 1.9000 (or) above the price level 🏹
- The Breakout entry : at 2.5000
- Set alerts for breakouts or pullbacks to strike in real-time. 🔔
- 🛡️ **Stop Loss Hacks: Guard Your Gains**
- Place stops below the nearest 1 Day swing low or candle wick. 🔧
- Tailor stops to your risk and lot size—precision over recklessness! ⚡
- 💸 **Profit Goals: Cash In Big**
- Bullish traders aim for 3.2000 or exit early if momentum dips. 📈
- Scalpers focus on long-side quick wins, trailing stops behind big players. 🚀
- 📡 **Market Edge: Why This Plan Wins**
- XRP/USD "Ripple vs U.S Dollar" is charging bullish, driven by COT data, macro shifts, sentiment outlook, and intermarket flows. 🔍
- Check the linkss for deeper insights. 🌐
- ⚠️ **News Alert: Dodge the Chaos**
- Skip new trades during major news releases. 📰
- Use trailing stops to secure profits on active trades. 🔒
- 🤝 **Join the Profit Crew**
- Boost this plan, share the vibe, and let’s raid the markets together! 🤑
- Stay sharp for the next big score in the XRP/USD "Ripple vs U.S Dollar" heist! 💥
Happy trading, chart bandits! 🎭📉

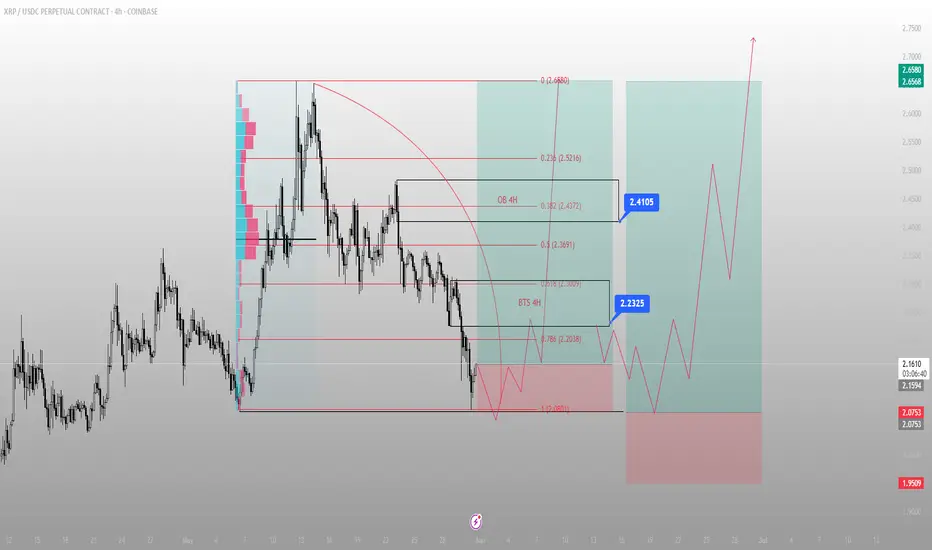
XRP didn’t break down. It just returned to origin.There was no crash. Just a clean delivery.
BINANCE:XRPUSDC swept the prior low and tapped directly into the 1.0 extension of the move — right at 2.0901 — closing below liquidity, only to reclaim it on the next candle. That’s not weakness. That’s Smart Money reloading.
Below that low sits the 4H BTS zone, overlapping the 0.618 and 0.786 retracements (2.2038–2.2325). That zone was engineered. Built. Not random. Price has already started responding.
The first draw is clear: 2.2325 — back into the inefficiency left behind on the breakdown. From there, we face a clean decision point at 2.4105. That’s where OB meets .382 retracement — and it’s a known trap zone for liquidity.
If price rips through it, 2.5216 becomes the magnet. If it rejects, I’ll be watching for a final mitigation before the full macro expansion.
Execution clarity:
✅ Entry: Inside BTS 4H zone (2.0901–2.2038)
🎯 Target 1: 2.2325
🎯 Target 2: 2.4105 (4H OB + liquidity pool)
🛑 Invalidation: Close below 1.9509
XRPUSDT: Bearish Move Likely Before the Next RallyXRPUSDT is currently exhibiting a bearish structure, with the price recently falling to around $2.28 and showing a decline of about 1.25% over the last week. Technical analysis across multiple timeframes reveals that bearish momentum is prevailing, but the setup is forming for a potential bullish reversal after further downside.
XRP's Correction Might Not Be OverIt looks like XRPUSDT can recover any minute now but the correction might not be over.
Good morning my fellow Cryptocurrency trader, what an unpredictable market we have today.
The action has been bearish since 12-May and bearish momentum continues to grow. It seems the bearish action is stopping now but XRP has not reached support. While a recovery can happen any day, the signals are bearish and we have three consecutive days the action being red, plus more than two weeks seeing lower prices.
We are bullish long-term but short-term anything can happen.
Bearish volume is very, very low which means that the down-move has no strength. How much lower can it go? Always a higher low because XRP will continue to grow long-term.
The correction might not be over.
Namaste.

XRPUSD at weekly support, ready to aim for 3$XRPUSDT is currently sandwiched between weekly support WS1 and weekly resistance WR1.
The price is currently trading inside weekly support WS1.
This is the place from where it should find support and gather necessary momentum for a bounce.
The bounce from WS1 shall lead the price to the daily resistance around 2.57 marked with horzontal blue line on the chart.
There the price is likely to face some pullback towards 2..36 only to come back again with force to go beyond this daily resistance zone.
This next move upward after the pullback from daily resistance around 2.57, shall lead the price to weekly resistance WR1 around 3$.

XRP 5X Lev. Full PREMIUM Trade-Numbers (PP: 1380%)Good afternoon my fellow Cryptocurrency trader, this is a great weekend and a wonderful day.
The bullish bias for XRP has been confirmed more than enough. It is time. The time is right and the time is ripe to go LONG.
I am publishing to give you full trade-numbers for you to enjoy.
This is a high probability chart setup.
I am wishing you success and great profits. Crypto is going up.
We are doing mid-leverage on this pair. We are going with 5X because the action is already moving. Earlier, we would go higher, but we like to keep risk moderate.
Full trade-numbers below:
_____
LONG XRPUSDT
Leverage: 5X
Current price: $2.15
Entry levels:
1) $2.18
2) $2.12
3) $2.05
4) $1.98
Targets:
1) $2.50
2) $3.02
3) $4.51
4) $6.29
5) $8.08
Stop-loss:
Close weekly below $1.95
Potential profits: 1380%
Capital allocation: 5%
_____
I am wishing you great profits and tons of success.
This is for advanced traders.
You decide how to secure profits, how to adapt to market conditions and how to trade.
You also decide your own level of risk. If you win, all the profits are yours.
If you lose, that's ok, the market offers endless opportunities and life goes on.
It is not about winning them all. It is about winning and growing.
Thanks a lot for your continued support.
Namaste.

XRP 5X Lev. Full PREMIUM Trade-Numbers —New Entry (PP: 815%)When the market is over-leveraged, when there are too many people out of control, you can feel a kind of tension; anxiety in the air... Sure enough, the market starts to shake and all these over-leveraged hands are removed. Once removed, the market becomes calm... Can you feel the calm? It is as if the gamblers are now gone.
Good morning my fellow Cryptocurrency trader, we have many charts, my leveraged trades, all green. We have second entries for BTC, ETH and ADA but none for XRP.
So, if you missed the first one, here is another one... It is risky, but the show must go on.
We are set to experience a very strong wave of growth. Getting in before the breakout can be live changing, just keep in mind that nothing is certain, leveraged trading is high risk. High risk vs a high potential for reward.
The signals here are not strong, but I believe we have very good timing, and if the timing is good, the price must also be.
_____
LONG XRPUSDT
Leverage: 5X
Entry levels:
1) $2.45
2) $2.35
3) $2.30
4) $2.26
5) $2.07
Targets:
1) $3.05
2) $3.40
3) $3.82
4) $4.08
5) $4.50
6) $5.18
7) $5.67
8) $6.29
Stop-loss:
Close weekly below $2.05
Potential profits: 815%
Capital allocation: 3%
_____
When the market calms down, it means that no more gamblers are around. When no more gamblers are around, the growth process can continue.
This is an unconventional signal, but you can't deny the change. One day, everybody is going wild, the next day, only the usual suspects remain.
When the market grows and moves to resistance, everybody wants to go LONG. When prices are low, people tend to detach and ignore. It is the other way around, sell at resistance and buy at support.
Time to go LONG.
Namaste.

XRP Ready for PUMP or what ?Ripple has successfully broken out of the falling wedge pattern and retested the breakout zone,the price is holding firmly above previous resistance, which now acts as strong support.
Continued strength could lead to upward movement toward targets at $2.65, $2.95, and $3.35
Stay Awesome , CobraVanguard

XRP/USD LONG SET UPTitle: XRP/USD (RIPPLE) BUY
Asset: Crypto
Symbol: XRP/USD
Market Entry Price 1: $2.28
Limit Entry Price 2: $2.08
Stop Loss: $1.88
Take Profit 1: $2.48 (close 10%)
Take Profit 2: $2.78 (close 25%)
Take Profit 3: $3.38 (close 50%)
Take profit 4: $3.88 (close 75%)
Take profit 5: $4.38 (close 100%)
Status: ACTIVE