XRPUSDT 4H | Untested Demand Zone RevisitIn this 4-hour chart analysis of XRPUSDT, I’m focusing on a clear and well-defined untested demand zone between 2.05–2.13 USDT . Unlike the first demand zone (already tested and played out), this second zone has not been retested since its formation, making it a fresh area of interest for a potential long setup.
Why this matters :
Untested demand zones often act as powerful magnets for price when revisited, as they represent areas where large buy orders might be waiting to be filled. Because this zone has not been revisited yet, there’s a higher probability for a bullish reaction when price returns to it.
Key Technical Factors :
✅ The 2.05–2.13 demand zone was formed following a significant bullish impulse that created a clear break of structure to the upside.
✅ Price is currently consolidating above this demand zone and also above a potential bearish CHoCH at 2.0784 . This suggests that the bullish structure is still valid unless price breaks below 2.0784.
✅ My bullish target is 2.65 USDT , where previous highs were formed and potential liquidity exists.
✅ My stop loss is set just below the demand zone, around 2.05 , to protect against a deeper retracement or a shift in market structure.
My Thought Process :
I expect that if price returns to the demand zone, there will be a strong chance for buyers to step in and push the market higher. However, I’m aware that if price breaks below 2.0784 , it would signal a bearish CHoCH and invalidate the long scenario. Therefore, patience is key — I’ll wait for price to either test the zone and react strongly or stay above 2.0784 to keep the bullish bias intact.
Clear Trade Setup :
📌 Entry Zone : 2.05–2.13
🛑 Stop Loss : Below 2.05
🎯 Take Profit : 2.65
🧩 Invalidation : Break below 2.0784
💬 Let me know if you have a similar zone marked out or if you see a different setup! Let’s share ideas and refine our strategies together.
XRPUSDT

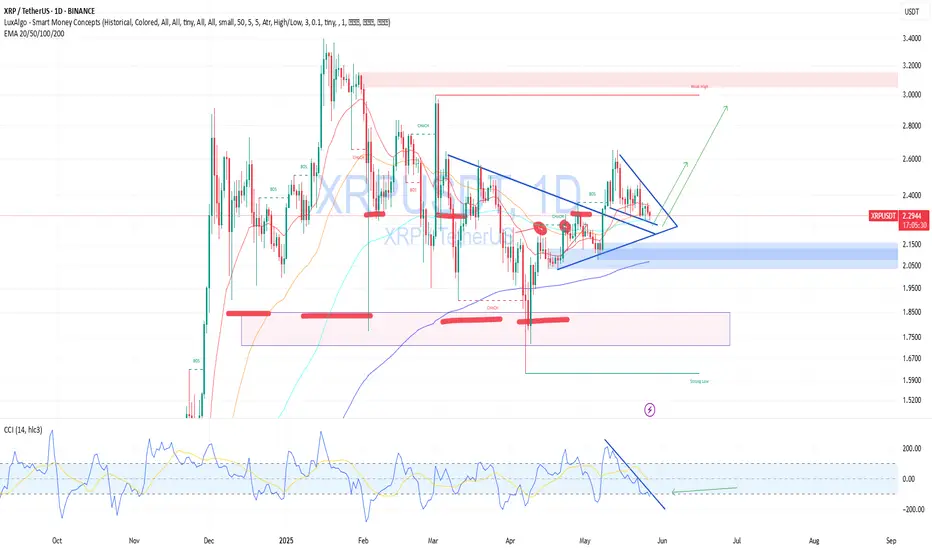
XRPUSDT — Buy From Support, Waiting for Triangle BreakoutOn the 4H chart, XRP is consolidating inside a symmetrical triangle and holding above an ascending trendline — a key support zone that has held multiple times.
🧠 Fundamentally:
Ripple continues expanding partnerships with fintech and banks.
The SEC lawsuit has lost its grip on price action.
A potential Fed rate cut could push crypto sentiment up again.
📌 I’m entering positions near $2.31, gradually accumulating. A breakout above the triangle could trigger a strong move.
🎯 Targets:
$2.50 — initial resistance
$2.65+ — if breakout is confirmed with strong momentum
🔽 If price breaks below $2.20, I’m looking to buy confidently near $1.80, where major demand sits. I don't expect such a dip, but markets can surprise.
Xrp- a small case for upsideRipple is a coin that is loved fervently by retail and despised vehemently by crypto natives. People who spend the bear market in the trenches tend to avoid it due to skepticism about FDV and other metrics and then retail comes in for a blip in time and pumps it to Valhalla and dumps on crypto natives and leaves without explaining.
If bitcoin hits 250k , retail is coming back and pumping this to $9.
Downside : price is currently trending near previous ATH of 2018 so there's a risk of double top and crash to 50¢
Upside : dark days are behind us. Why zoom out more than necessary. Worst is behind us. We're in an uptrend.
minor downside : oh no, we zoomed in too hard and the chart seems to be in a downtrend. well it doesn't matter unless you're high leveraged . Zoom out moderately, relax for a bit, and wait for retail to arrive.

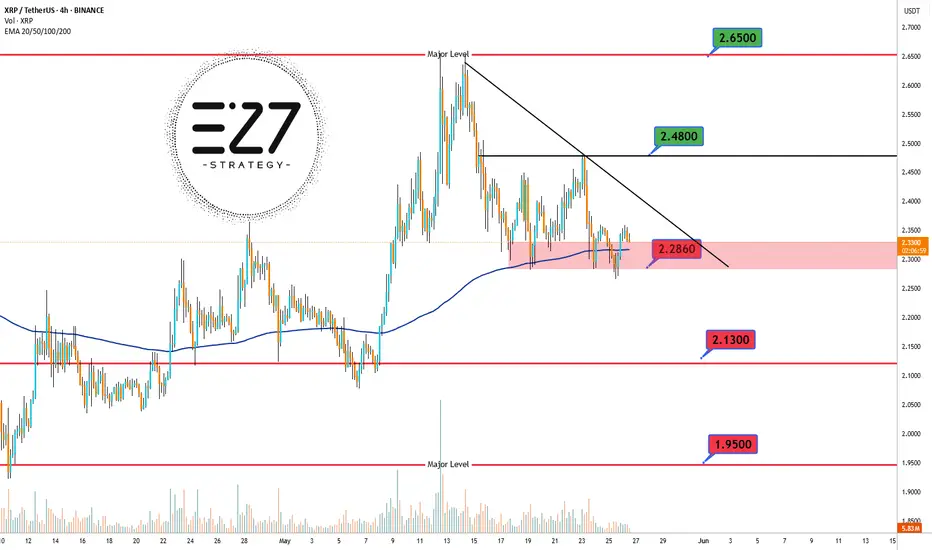
XRPUSDT The 4-hour chart of BINANCE:XRPUSDT shows that the overall trend remains bullish, but the price is currently in a corrective downward phase. 📉 At the moment, XRP is trading in a highly critical zone, right at the 2.2860 USDT support level, which aligns with the 200 EMA — often considered a dynamic support area. 🛡️ Despite this confluence, the price still sits below the descending trendline, indicating continued bearish pressure. ⚠️ If the price manages to hold this key zone and break above the trendline, a move toward the next resistance at 2.4800 USDT and potentially 2.6500 USDT could follow. 🚀 However, losing the 2.2860 support could trigger a deeper drop toward 2.1300 USDT and even 1.9500 USDT. ❗ This current level, where static support intersects with the 200 EMA, is a make-or-break zone that will likely define the short-term direction of XRP.
Support & Resistance Levels:
🔼 Major Resistance: 2.6500 USDT
🔼 Secondary Resistance: 2.4800 USDT
⚡ Dynamic Resistance (trendline): ~2.3500 USDT
🔽 Key Support (current price level): 2.2860 USDT
🔽 Secondary Support: 2.1300 USDT
🔽 Major Support: 1.9500 USDT
XRUSD Price Market Trend Day TF Long Term BUYXRPUSD is trading at 2.33674, with a strong recommendation to buy for long-term gains. The chart indicates a potential upward trajectory, with price targets set at:
TP1: 2.44200 (Near-term resistance)
TP2: 3.00500 (Mid-term target)
TP3: 3.40000 (Long-term bullish goal)
The mention of 3.40000 at the top of the chart suggests this is a psychological resistance level, reinforcing the optimistic outlook if bullish momentum sustains.

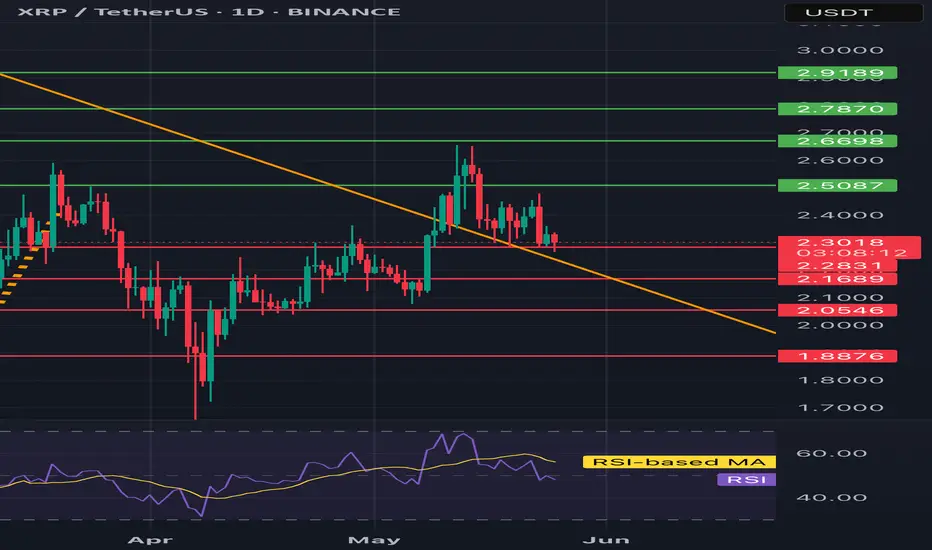
XRP/USDT 1D chart reviewHello everyone, let's look at the 1D XRP chart to USD, in this situation we can see how the price lasts above the downward trend line.
Going further, let's check the places of potential target for the price:
T1 = $ 2.51
T2 = $ 2.67
Т3 = 2.79 $ t4 = $ 2.92
Let's go to Stop-Loss now in case of further declines on the market:
SL1 = $ 2.31
SL2 = $ 2.17
SL3 = $ 2.06
SL4 = $ 1.89
Looking at the RSI indicator, you can see how he reacted and returned to the middle of the range, which creates a place for a panty growth.
#XRP/USDT#XRP
The price is moving within a descending channel on the 1-hour frame, adhering well to it, and is heading for a strong breakout and retest.
We are seeing a bounce from the lower boundary of the descending channel, which is support at 2.29.
We are seeing a downtrend on the RSI indicator that is about to break and retest, supporting the upward trend.
We are looking for stability above the 100 Moving Average.
Entry price: 2.30
First target: 2.33
Second target: 2.37
Third target: 2.42

#XRP/USDT#XRP
The price is moving in a descending channel on the 1-hour frame and is expected to continue upward.
We have a trend to stabilize above the 100 moving average once again.
We have a downtrend on the RSI indicator, which supports the upward move with a breakout.
We have a support area at the lower boundary of the channel at 2.25.
Entry price: 2.34
First target: 2.42
Second target: 2.47
Third target: 2.56

XRPUSDT - UniverseMetta - Signal#XRPUSDT - UniverseMetta - Signal
D1 - Formation of ABC structure in continuation of the upward trend. Stop behind the minimum.
Entry: 2.4470
TP: 2.6527 - 2.8878 - 3.0311 - 3.2662
Stop: 2.2670

XRPUSDT: Price has reversed, what's next? XRPUSDT has smoothly reversed from our designated reversal buy zone, as clearly pointed out in this chart and our previous analysis. We expect a smooth price reversal taking the price to $4 in the coming weeks. Please use accurate risk management while trading XRP. Crypto is likely to remain more volatile in the coming days.
Two targets are pointed out, which you can set based on your analysis.
If you’d like to contribute, here are a few ways you can assist us:
- Like our ideas
- Comment on our ideas
- Share our ideas
Team Setupsfx_🚀❤️

Next levels for XRP!This Gann arc held as support and price will go right to the next arc. I'm seeing a confluence with th 1.618!
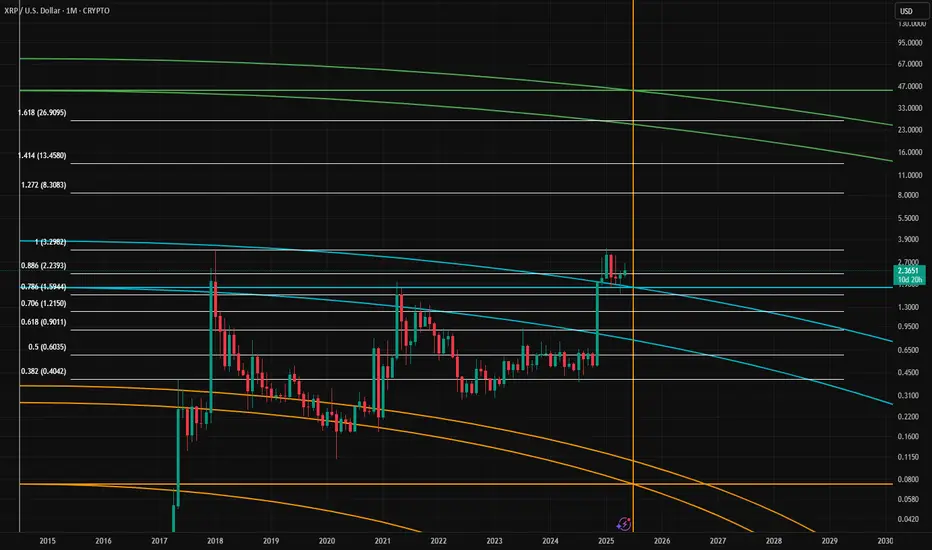
Next levels for XRPThis Gann arc held as support and price will go right to the next arc. I'm seeing a confluence with th 1.618!

XRP's situation+ Target PredictionThe XRP is in a Bullish phase by a Falling Wedge Pattern.
A falling wedge indicates the potential for price to reach to $3.
Note if the Wedge Pattern is broken downwards with the strength of Bearish candles , this analysis of ours will be failed.
Give me some energy !!
✨We spend hours finding potential opportunities and writing useful ideas, we would be happy if you support us.
Best regards CobraVanguard.💚
_ _ _ _ __ _ _ _ _ _ _ _ _ _ _ _ _ _ _ _ _ _ _ _ _ _ _ _ _ _ _ _
✅Thank you, and for more ideas, hit ❤️Like❤️ and 🌟Follow🌟!
⚠️Things can change...
The markets are always changing and even with all these signals, the market changes tend to be strong and fast!!

XRP : LONG FOR THIS WEEK !Hello friends
Considering the good growth we had, you can see that the price has formed a double top pattern and corrected after reaching its ceiling.
Now, with the price correction, there is a good opportunity to buy in stages and with capital management and move with it to the specified goals.
*Trade safely with us*

Is XRP About to Rebound? Bullish Signals EmergeXRP Flashes Bullish Signal: Technical Indicator Hints at Imminent Rebound – 100x Gains Coming? The Future Is Closer Than You Think—Analyst
The cryptocurrency market is a volatile and often unpredictable space, where fortunes can be made and lost in the blink of an eye. Among the myriad of digital assets vying for attention, XRP, the cryptocurrency associated with Ripple Labs, has consistently been a topic of intense debate and speculation. While it has faced its fair share of challenges, including regulatory scrutiny and market fluctuations, XRP continues to hold the interest of investors and analysts alike.
Recently, XRP has been displaying what some experts are interpreting as bullish signals, suggesting a potential rebound in its price. These signals are primarily derived from technical analysis, a method of evaluating assets by analyzing statistical trends gathered from trading activity, such as price movement and volume. One particular technical indicator is hinting at an imminent upswing, leading some analysts to predict significant gains for XRP in the near future.
This article delves into the technical indicators flashing bullish signals for XRP, examines the factors that could contribute to a potential rebound, and explores the possibility of a 100x gain, a prospect that has captured the imagination of many XRP enthusiasts.
Technical Indicators Pointing Towards a Rebound
Technical analysis plays a crucial role in understanding potential price movements in the cryptocurrency market. Several indicators are currently suggesting a bullish outlook for XRP:
1. Moving Averages: Moving averages are commonly used to smooth out price data over a specific period, helping to identify trends. When a shorter-term moving average crosses above a longer-term moving average, it is often seen as a bullish signal, indicating that the price is likely to rise. XRP has recently exhibited this "golden cross" pattern on certain timeframes, suggesting a potential upward trend.
2. Relative Strength Index (RSI): The RSI is a momentum indicator that measures the magnitude of recent price changes to evaluate overbought or oversold conditions in the price of an asset. An RSI value below 30 typically indicates that an asset is oversold and may be due for a rebound. XRP's RSI has been hovering in oversold territory, suggesting that buying pressure could soon increase.
3. Fibonacci Retracement Levels: Fibonacci retracement levels are horizontal lines that indicate potential support and resistance levels based on the Fibonacci sequence. These levels are often used to predict where the price of an asset might find support during a downtrend or resistance during an uptrend. XRP has been testing key Fibonacci retracement levels, and a successful breakout above these levels could signal a significant price increase.
4. Chart Patterns: Technical analysts also look for specific chart patterns that can provide clues about future price movements. Some patterns, such as the "inverse head and shoulders" or the "double bottom," are considered bullish formations, suggesting that the price is likely to rise. XRP has been forming patterns that resemble these bullish formations, further supporting the possibility of a rebound.
Factors Contributing to a Potential XRP Rebound
While technical indicators can provide valuable insights, it is essential to consider the fundamental factors that could influence XRP's price. Several factors could contribute to a potential rebound:
1. Ripple's Ongoing Legal Battle with the SEC: The most significant factor weighing on XRP's price has been Ripple's legal battle with the U.S. Securities and Exchange Commission (SEC). The SEC alleges that Ripple sold XRP as an unregistered security, a claim that Ripple vehemently denies. A favorable outcome in this case could significantly boost XRP's price, as it would remove a major source of uncertainty and regulatory risk.
2. Growing Adoption of XRP for Cross-Border Payments: Ripple has been actively promoting XRP as a solution for cross-border payments, touting its speed, efficiency, and low cost compared to traditional methods. Increased adoption of XRP by financial institutions and payment providers could drive demand for the cryptocurrency, leading to a price increase.
3. Expansion of Ripple's Ecosystem: Ripple has been expanding its ecosystem by developing new products and services that utilize XRP. These include RippleNet, a network of financial institutions that use Ripple's technology for cross-border payments, and On-Demand Liquidity (ODL), a service that allows businesses to use XRP to source liquidity for cross-border transactions. A thriving ecosystem could attract more users and investors to XRP, further supporting its price.
4. Overall Cryptocurrency Market Sentiment: XRP's price is also influenced by the overall sentiment in the cryptocurrency market. A positive market sentiment, characterized by rising prices and increased investor confidence, could lift XRP along with other cryptocurrencies. Conversely, a negative market sentiment could put downward pressure on XRP's price.
The Possibility of a 100x Gain: A Realistic Scenario?
The prospect of a 100x gain in XRP's price has captured the imagination of many investors. While such a gain is certainly possible, it is essential to approach this scenario with a healthy dose of skepticism and realism.
To achieve a 100x gain, XRP's price would need to increase by a factor of 100 from its current level. This would require a massive influx of capital into XRP, driven by a combination of factors, such as a favorable outcome in the SEC case, widespread adoption of XRP for cross-border payments, and a significant increase in overall cryptocurrency market capitalization.
While these factors are not entirely out of the realm of possibility, they are by no means guaranteed. The cryptocurrency market is inherently unpredictable, and unforeseen events could derail any potential rally in XRP's price.
Analyst Perspective: The Future Is Closer Than You Think
Despite the inherent risks and uncertainties, some analysts remain optimistic about XRP's future. These analysts point to the potential for XRP to disrupt the traditional cross-border payments industry, the growing adoption of Ripple's technology, and the possibility of a favorable outcome in the SEC case as reasons for their bullish outlook.
One analyst, in particular, has stated that "the future is closer than you think" for XRP, suggesting that significant gains could be realized in the near future. This analyst believes that XRP is currently undervalued and that its price could surge once the regulatory uncertainty surrounding Ripple is resolved.
Conclusion: Navigating the XRP Landscape
XRP presents a complex and often contradictory picture. Technical indicators are flashing bullish signals, suggesting a potential rebound in its price. Factors such as Ripple's ongoing legal battle with the SEC, growing adoption of XRP for cross-border payments, and the overall cryptocurrency market sentiment could all play a role in determining XRP's future.
While the possibility of a 100x gain is enticing, it is essential to approach this scenario with caution and realism. The cryptocurrency market is inherently volatile, and unforeseen events could impact XRP's price.
Ultimately, whether XRP achieves its full potential remains to be seen. However, the recent bullish signals and the ongoing developments surrounding Ripple suggest that the future of XRP is closer than many might think. As always, investors should conduct their own research, assess their risk tolerance, and make informed decisions before investing in any cryptocurrency, including XRP.

Is XRP the Next Crypto Rocket?$2,5 Breakout Targets $3.5 or moreI see a clear setup with actionable insights. The chart shows XRP forming a range and deviation at 1.77$, with a recent bullish breakout attempt. Here’s my breakdown:
Technical Analysis
Deviation of the global range points at potential consolidation(blue horizontal line)
Breakout Attempt: A sharp green candle pushed above the $2,36 resistance, but it’s yet to close convincingly above it. The red arrow projecting upward suggests optimism for a move toward $3–$3,5if the breakout holds.
Given today’s date (May 18, 2025, 03:40 PM EEST), this setup aligns with recent crypto market trends. XRP’s price action could be reacting to broader market sentiment, regulatory news, or Ripple-related developments, which have historically driven volatility.
This chart screams opportunity if the breakout holds. However, watch for a false breakout—crypto is notorious for shakeouts. A failure to close above $2,5 could see price retrace to $2,3 or lower. I’d monitor the next 2-3 weeksfor confirmation.

#XRP #XRPUSD #XRPUSDT #Ripple #Analysis #Eddy#XRP #XRPUSD #XRPUSDT #Ripple #Analysis #Eddy
I have identified the important supply and demand zones of the higher timeframe for you.
This analysis is based on a combination of different styles, including the volume style with the ict style.
Based on your strategy and style, get the necessary confirmations for this analysis to enter the trade.
Don't forget about risk and capital management.
The responsibility for the transaction is yours and I have no responsibility for your failure to comply with your risk and capital management.
💬 Note: Important liquidity is marked on the chart. Be careful of liquidity hunting. In my opinion, the important entry point for buying spot and long futures is at 1.0987$, and it will most likely be a sniper entry. The first target from the specified point will be $4 and the second target will be $10.
Be successful and profitable.

XRPHighly likely XRP retest $2.20 before moving higher.
Long-term investors are looking for lower prices before a tariff deal with China. A liquidity sweep is needed before we move higher, or we will continue moving lower.
We break $2.50 and we will see $3 quickly after. ETF going Live on the 19th, China deal, SEC case ending will all catapult price.
LOCK IN 🔐

XRP Failed Advance?The corrections are red yes?
An advance is green.
Consolidation is blue. In this case we have bullish consolidation.
Is this a failed advance?
No. So far the chart is saying that current price action is simply an extension of the consolidation phase. That is, XRPUSDT continues with a bullish consolidation. Sideways while growing slowly.
Four days red and no major retrace. Four days red is literally the maximum since August 2024.
This is an interesting signal. Since August 2024, XRPUSDT has never closed more than four consecutive days red. We can interpret this signal in several ways.
A red close today would lead to a green day tomorrow.
Today can produce any type of move, can be lower but as soon as the candle closes we can expect a green day next. That is because the market continues to fluctuates and it never stays the same for too long.
The green day doesn't have to be a big green candle but it can be the continuation of the slow bullish consolidation. The good news is that bullish consolidation will lead to a strong bullish advance at some point. The bad news is that it tends to become boring to wait. Prices are not growing super fast but it is growing and this is were most people make mistakes.
Beginners want to see 100% growth daily or else nothing is happening but that is not the case. XRPUSDT has been growing since 7-April and look at this, more than 60% growth in a month. With a good entry at the low this can translate into huge profits and that's how it goes. It can grow slowly but surely for months and then boom, out of nowhere a sudden jump. But still, it is growing daily and that's what is most important if you are holding this coin.
It will keep on growing and that's an easy call.
Namaste.

$ORDI/USDT Breakout Alert!$ORDI/USDT Breakout Alert!
After months of a brutal downtrend, ORDI has finally broken the descending trendline with strong bullish momentum. 👀
Entry:- CMP
Targets:- $ 10, $16, $23, $32, $49
Stop loss:-5.67
Risk/Reward looks 🔥 if this move holds.
Eyes on continuation! 🚀

$XRP Breakout Alert!CRYPTOCAP:XRP Breakout Alert!
XRP has broken out of a long-term falling wedge on the daily chart
This classic bullish reversal pattern could drive price toward the $4.50 zone, nearly +89% upside from here! 👀
As long as it holds above the breakout zone, momentum looks strong

XRP – Long Swing Trade Setup Near Key SupportXRP is pulling back toward a major support zone around $2.25, a level that previously acted as a breakout region. With the market showing signs of rotating into strength across large caps, this could offer a solid risk-reward entry for a medium- to long-term swing trade.
🔹 Entry Zone:
$2.25 support zone
🎯 Take Profit Targets:
🥇 $2.60 – $2.75 (prior supply zone & range mid-point)
🥈 $3.15 – $3.40 (macro resistance / high timeframe target)
🛑 Stop Loss:
Just below $2.15 (invalidates the reclaim thesis & opens risk to deeper correction)

Liquidation Begins With a Thought, Not a CandleHave you ever found yourself opening a trade you knew you shouldn’t?
That whisper in your head saying, “This setup looks different…” only for you to get stopped out or liquidated hours later?
It probably wasn’t your strategy that failed — it was your brain.
Hello✌
Spend 3 minutes ⏰ reading this educational material. The main points are summarized in 5 clear lines at the end
🎯 Analytical Insight on XRP: A Personal Perspective:
XRP is approaching a key daily resistance confluence with a descending trendline, after breaking out of its recent bearish channel and reclaiming prior structure levels 📈. I anticipate a gradual upside continuation with a minimum projected move of +14%, targeting the $2.85 zone. Two major daily supports — aligned with Fibonacci retracements — have also been identified as key demand zones for potential retests 🔍.
🧠 How Your Brain Leads You to Liquidation
A Psychological Trap Every Trader Must Know
Let’s explore how your mind tricks you into losses and which TradingView tools can help you stay focused and objective in the heat of the market.
🛠️ How to Protect Yourself (And Your Capital)
✅ Use multi-timeframe analysis:
Sometimes a bullish move on the 15-min chart is just a retest on the 4H. TradingView makes it easy to monitor several timeframes side-by-side.
✅ Set alerts instead of staring at charts:
Let TradingView notify you when your trade setup actually appears. Reduce emotional overtrading.
✅ Trust neutral tools like EMA, VWAP, or Volume Profile:
They offer structure and objectivity — less prone to emotional interpretation.
✅ Keep a trading journal:
Use the idea publishing feature or private notes to reflect on why you entered a trade. Most mistakes repeat when they’re not reviewed.
🔍 Cognitive Biases in Action
Your brain is wired for survival, not profits. It reacts emotionally — especially under pressure.
One of the most common psychological traps in trading is confirmation bias:
You form an opinion first, then only look for information that supports it.
It’s like spotting a resistance level on BTC but ignoring bearish signals because you want the price to break out.
You're not analyzing anymore — you're convincing yourself.
😨 FOMO: The Invisible Hand That Pushes Bad Trades
Bitcoin rallied from $93.4K to $102K in early January 2025.
The crowd on social media went wild: “ATH is coming!” was everywhere.
But on the chart? RSI was overbought, MACD flashed a bearish divergence.
Still, traders entered blindly — emotionally. Days later, BTC encounter with more loss.
This wasn’t technical failure. It was pure psychological FOMO.
🧘♂️ Train Your Mind Before You Train the Market
The charts don’t lie — but your interpretation of them might.
That’s why the best traders don’t just study the market, they study themselves.
Master your mindset, and the market won’t master you.
However , this analysis should be seen as a personal viewpoint, not as financial advice ⚠️. The crypto market carries high risks 📉, so always conduct your own research before making investment decisions. That being said, please take note of the disclaimer section at the bottom of each post for further details 📜✅.
🧨 Our team's main opinion is: 🧨
XRP has broken out of its downward channel and is now approaching key resistance; I’m eyeing a steady move toward the $2.85 target with at least +14% potential upside 📊.
Trading mistakes often come from our own minds, not the market. Emotional biases like confirmation bias and FOMO can trick you into bad trades—just like BTC’s in early January 2025 jump that fooled many 📉. To protect your capital, use TradingView’s multi-timeframe analysis, alerts, and objective tools like EMA or VWAP. Remember, mastering your mindset is as crucial as reading the charts.
Give me some energy !!
✨We invest countless hours researching opportunities and crafting valuable ideas. Your support means the world to us! If you have any questions, feel free to drop them in the comment box.
Cheers, Mad Whale. 🐋
