💡 Don't miss the great buy opportunity in XRPUSDTTrading suggestion:
. There is a possibility of temporary retracement to suggested support line (0.41). if so, traders can set orders based on Price Action and expect to reach short-term targets.
Technical analysis:
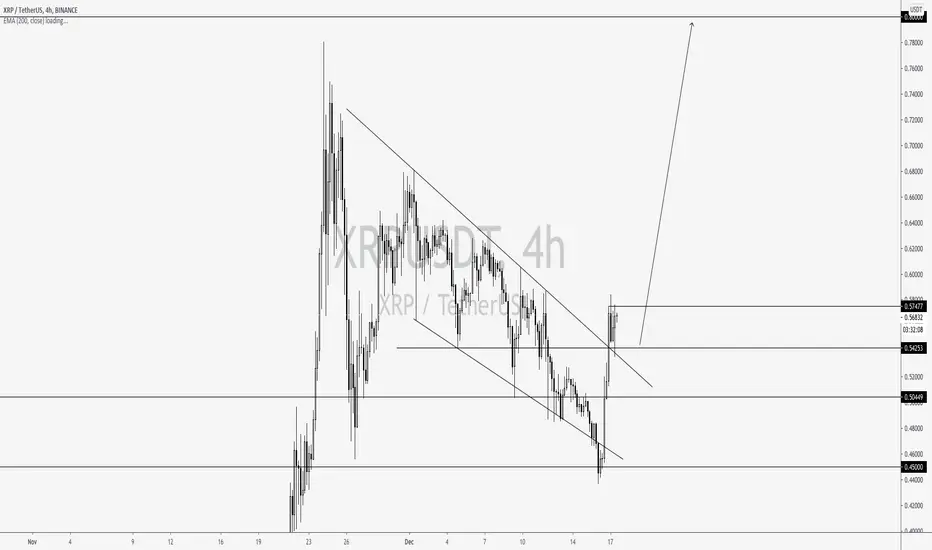
. XRPUSDT is in a range bound and the beginning of uptrend is expected.
.The price is above the 21-Day WEMA which acts as a dynamic support.
. The RSI is at 60.
Take Profits:
TP1= @ 0.45
TP2= @ 0.50
TP3= @ 0.56
TP4= @ 0.62
TP5= @ 0.67
TP6= @ 0.75
SL= Break below S2
❤️ If you find this helpful and want more FREE forecasts in TradingView
. . . . . Please show your support back,
. . . . . . . . Hit the 👍 LIKE button,
. . . . . . . . . . . Drop some feedback below in the comment!
❤️ Your Support is very much 🙏 appreciated! ❤️
💎 Want us to help you become a better Forex trader ?
Now, It's your turn !
Be sure to leave a comment let us know how do you see this opportunity and forecast.
Trade well, ❤️
ForecastCity English Support Team ❤️
Xrpusdtlong

XRP LONG postion update and targetsThis is just an update as I woke up and saw the E formed we are now more bullish than ever
On chart target short and mid term


XRPUSDT, long after correction.Hi friends. XRP have a chance to correction but bulls are not exhausted. In this time and few hours ago (i mark this zone) exchange actively purchased traders closings and now we can going to invest zone after part of this was satisfy and then price will going upper to bulls targets. I mark all interesting levels on the chart window. Levels thanks to X-Lines script. Volume analysis - "Earned Pro".

XRPUSDT, restoring bulls potential.Hi friends. We have good bulls accumulation zone under 0.39 and i think long will be. Target for bulls: 0.428 (first one) and maybe 0.46 if nothing will change. Follow me.


XRPUSDT, long to resist 0.41.Hi friends. XRP showing good bears satisfaction and also much price points when market purchase bulls closing on downward candles - information thanks to "Earned Pro" script. Levels thanks to X-Lines. Target for bulls 0.41.

XRPUSDT long term continue look bulish.Hi friends. Daily chart and 3H chart show stable long in near future. There maybe some correction of course but long term clear bullish. Optimal and first bulls target in future is 0.5536 strong daily level. All bulls from 0.46 was re-buy from 0.41. Levels thanks to X-Lines script. Follow me

XRPUSDT, long to 0.27483 after closingsHi friends. XRP want to go upper after traders sold they long to exchange. Target for bulls 0.27483. I mark interesting market processes on the chart window. Levels thanks to X-Lines. Follow me.

XRPUSDT, accumulation continue. Long to 0.41.Hi friends. Exchange continue to accumulation long position for XRPUSDT. Our target still 0.41. Big correction cant come becouse we have too much volume under 0.275. My opinion long to 0.41 and nothing change from previous idea. Levels thanks to X-Lines script. Follow me.

XRPUSD Potential Long.. HUGE RRRFrom what I can see price has broken its recent resistance area and has now come down to retest support.. We could be looking for a big move to the upside

XRPUSDT, long after solds was bought.Hi friends. Now picture on xrpusdt chart window is identical to that with bitcoin and ethereum. So we have investing from levels what i predict in last idea. Long will continue until 0.41. Levels thanks to X-Lines script. Follow me.


XRPUSDT, investors are scared and close they longs.Hi friends. Yes its TIME to go long! First Target 0.41. I mark all interesting market processes on the chart window. Investors are scared and close they longs, exchange bought it and now long will be. Levels thanks to X-Lines script. Follow me. I update previous idea.


XRP Sell a break setup.Ripple - Intraday - We look to Sell a break of 0.2128 (stop at 0.2274)
Daily signals are bearish.
Trading within a Bullish Channel formation.
Although the market broke to the upside in early trade, bespoke resistance at 0.2630 capped the gains.
We look for losses to be extended today.
Trend line support is located at 0.2220.
A break of 0.2220 is needed to confirm follow through negative momentum.
Our profit targets will be 0.1702 and 0.1512
Resistance: 0.2300 / 0.2550 / 0.2700
Support: 0.2180 / 0.2075 / 0.1700

XRPUSDT, long agter big solds. Target 0.295 and upper.Hi friends lets go up on XRPUSDT chart window. Modified "Earned" script show too big volume of solds now. Picture like that: people start to purchase and ofcourse they was right but exchange sold them big volume of XRP price go down people close they positions and exchange bought this xrp. So first bulls target is 0.295.
Follow me.
Levels thanks to X-Lines script.

XRPUSDT does it still have some juice?XRP/USDT If there is no more negative news, the price should continue with an uptrend to the resistance level, which has already begun with a nice Ascending triangle. Forming nice higher lows and consolidation. The chart looks promising.
U can buy it at the current rate of $0,2320 or if you wanna play safe wait for the Ascending triangle breakout.
Stop-loss is a must on this coin: #0,250
The target (resistance): $0,322 break this next one should be $0,447

XRPUSDT purchase from the currentXRPUSDT purchase from the current price. Main goal for the whole year price 15 $
✅ If you like my analytics bet 👍
Subscribe to keep abreast of my predictions.
I would also be glad to see your comments under the idea, what do you think about this?

Where to buy XRP? | Wave AnalysisHaving legal issues with SEC, XRP has lost a big % of its value lately, causing many buyers to panic sell, due to the negative nature of the news. Although these dips must remind us that we should start take the chance and fill our bags will XRP, before the storm is over and price retreats to new highs.
Personally, I have already started buying the small dips, but what about the major buying opportunity. Well, by analyzing the recent wave sequence of XRP price and realizing that a falling wedge is being formed, I have no reasons to not chase a good buy.
All the details are already mentioned in the chart, so there's nothing more from me to mention here but a tip. When these situations appear, try to split your capital in pieces and never use it all on one price level, because if you try to catch a falling knife, the chances of you getting hurt are big.
Hope I helped some people by sharing my clarity, and gave some food for thought to any wave theory enthusiasts like me.

XRP/USD 🦈XRP/USD 1D
Due to bad news, the price drops to ( 0.20 / 0.15 / 0.10 )
Do not miss the opportunity !
Today's price in 2021 will be remembered
Thursday - 2020 31 December
🚀🚀🚀🚀🚀🚀

XRPUSDT, long now or long from 0.135 after accumulation.Hi friends, very intresting situation on XRPUSDT chart window. We have big distance between too close strong resist 0.175 and minimal daily level 0.135. My opinion of exchange want to sold down to 0.135 they must to accumulate this short between 0.175 and 0.19. So my opinion there is only two ways:
1) Long from now to 0.25
2) Long to maximum 0.2 and accumulation then short to 0.135 and long to 0.25.
Will see. Now exhange start to purchase traders solds so we go up 0.19 at near time. Will see.
Levels thanks to X-Lines script. Follow me.

XRP BULLISH CONTINUATIONEverything looks bullish from here. It seems like a continuation of the bullish trend.