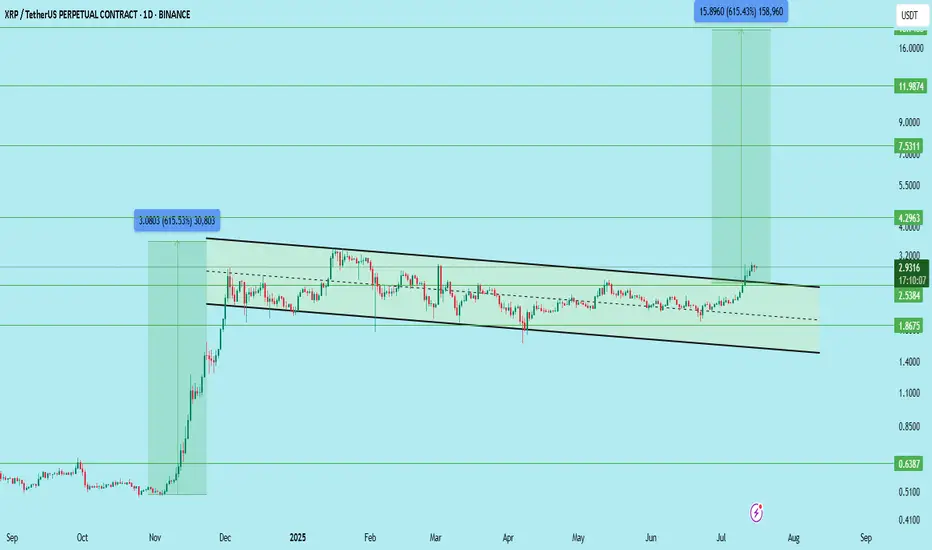
$XRPUSDT LONG TERM SETUP for SPOT !!CRYPTOCAP:XRP has officially broken out of its long-standing descending channel on the daily timeframe.
This is a major structure breakout and opens the door for a big move, but patience is key. Wait for a clean retest before entering the trade.
Trade Setup:
Entry (Ideal Retest Zone): $2.53 – $2.75
Stop Loss: Below $2.38
Resistance/Support Zones:
Immediate Support: $2.53
Resistance Levels: $4.29 / $7.53 / $11.98 / $18.00
Targets (Long-Term):
TP1: $4.29
TP2: $7.53
TP3: $11.98
TP4: $18.00
Potential Profit: Over 500%+ if it plays out fully
This is a long-term breakout structure — don’t rush. Wait for confirmation on the pullback.
DYOR | Not Financial Advice
XRPUSDTPERP
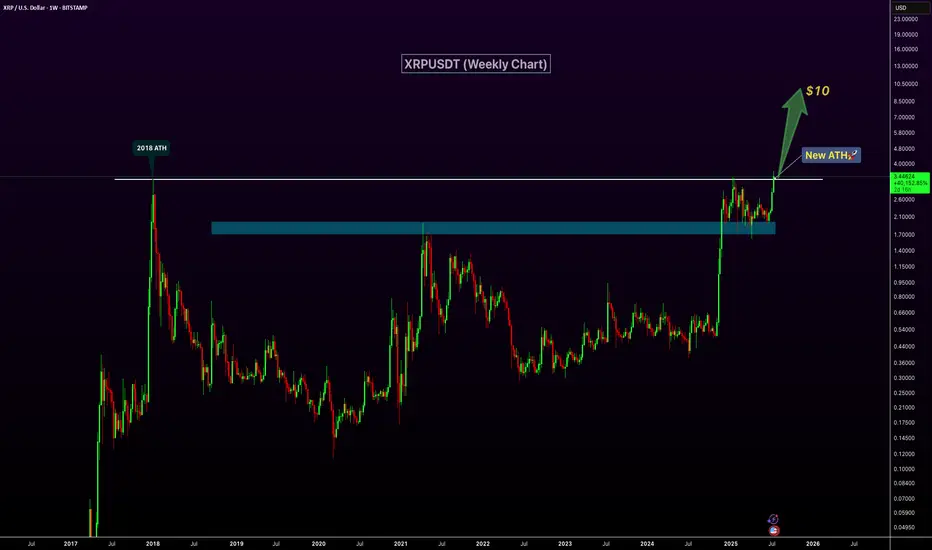
XRP Breaks 2018 High – New ATH Confirmed!XRP has officially broken above its 2018 peak, signaling a major bullish breakout and printing a new all-time high on the weekly chart. The previous resistance zone around $2.6–$3 has now flipped into strong support, confirming the strength of this move. With increasing volume and momentum behind the rally, XRP appears well-positioned for continued upside. The next key psychological target lies at $10, and current price action suggests a clear path toward that level. If bullish sentiment continues, this breakout could mark the beginning of a significant new uptrend.
Check support above 2.5102-2.6013
Hello, traders.
If you "Follow", you can always get new information quickly.
Have a nice day today.
-------------------------------------
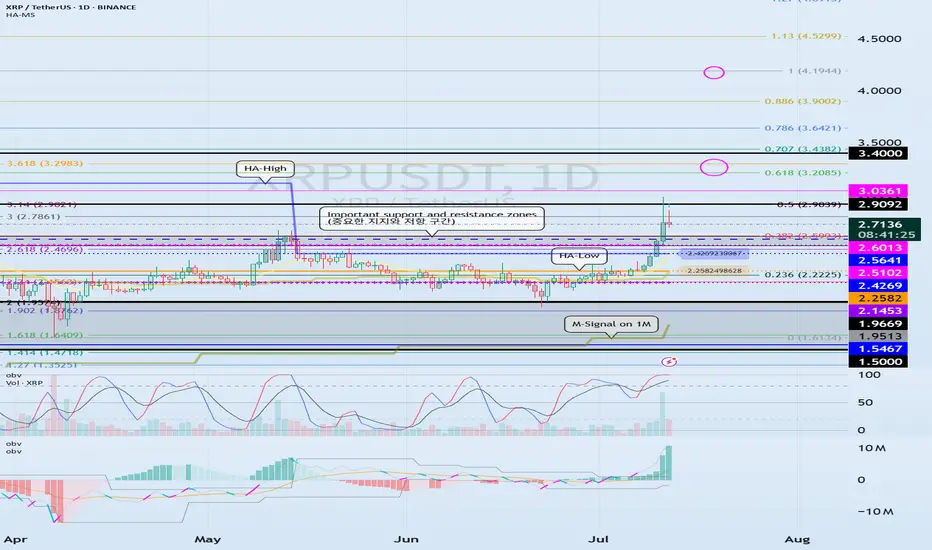
(XRPUSDT 1D chart)
It has broken through the important support and resistance zone.
Accordingly, the key is whether the price can be maintained above 2.5102-2.6013 and rise.
If the price is maintained above 2.5102-2.6013, it is possible that a stepwise rise will occur.
At this time,
1st: Right Fibonacci ratio 0.618(3.2085) ~ Left Fibonacci ratio 3.618(3.2983)
2nd: Right Fibonacci ratio 1(4.1944)
You need to check for support near the 1st and 2nd above.
The strong support area is 1.5-1.9669.
----------------------
The left Fibonacci ratio was drawn in the initial rising wave, and the right Fibonacci ratio was drawn in the recent rising wave.
Therefore, if the price rises above 3.618(3.2983) of the Fibonacci ratio drawn in the initial rising wave and maintains it, there is a high possibility of creating a new wave.
Since the Fibonacci ratio is a tool for analyzing the chart, it is not good to use this point as a support and resistance point.
Therefore, we need to check whether the DOM(60) indicator or the HA-High indicator is newly created and create a response strategy depending on whether there is support.
Currently, the DOM(60) indicator is formed at the 2.5102 point, and the HA-High indicator is formed at the 2.4269 point.
The basic trading strategy is to buy near the HA-Low indicator and sell near the HA-High indicator.
However, if it receives support in the HA-High ~ DOM(60) section and rises, it is likely to show a stepwise upward trend, and if it receives resistance in the DOM(-60) ~ HA-Low section and falls, it is likely to show a stepwise downward trend.
Therefore, trading begins by checking whether there is support in the DOM(-60) ~ HA-Low section and the HA-High ~ DOM(60) section.
-
Thank you for reading to the end.
I hope you have a successful transaction.
--------------------------------------------------
- Here is a description of the big picture.
(3-year bull market, 1-year bear market pattern)
I will explain more details when the bear market starts.
------------------------------------------------------
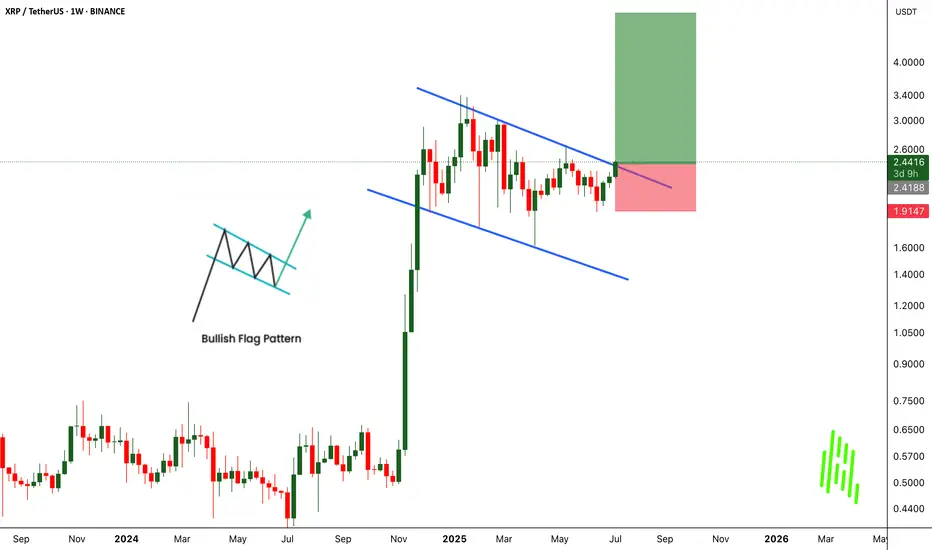
XRPUSDT Breaks Out of Bullish Flag - Big Moves Ahead!BINANCE:XRPUSDT has broken out of a classic bullish flag pattern on the weekly chart, signaling a strong continuation to the upside. This textbook setup is known for its high success rate, and the breakout suggests the potential for significant gains if momentum continues.
The CRYPTOCAP:XRP community remains strong, with long-term holders showing confidence and resilience. With the current market structure and support from loyal investors, there’s a real possibility for the price to double from this breakout zone.
The strategy is simple. Buy and hold for the long term. But as always, traders must manage risk carefully and use a proper stop loss. Let the flag fly high. CRYPTOCAP:XRP could be ready for a major pump from this level.
BINANCE:XRPUSDT Currently trading at $2.43
Buy level : Above $2.4
Stop loss : Below $1.9
Target : $5
Max leverage 3x
Always keep stop loss
Follow Our Tradingview Account for More Technical Analysis Updates, | Like, Share and Comment Your thoughts
XRPUSDT Forming Bullish BreakoutXRPUSDT is showing an interesting setup with a bullish breakout potential that could fuel gains of 60% to 70% or more in the coming weeks and months. The recent price action suggests that XRP is breaking out of a long-standing consolidation pattern, with price pushing above a descending trendline and holding well above key support levels. This breakout is attracting both retail traders and big investors who see Ripple’s strong fundamentals and unique use case in the cross-border payment sector as major catalysts for its long-term growth.
The trading volume has remained healthy, signaling strong market participation and increasing confidence that XRP’s next move could be substantial. If momentum continues, traders can expect a potential rally towards major resistance zones, with increased interest from whales likely to accelerate the bullish scenario. Market sentiment around XRP has also improved thanks to positive developments in its legal battles and expanding partnerships, which add further conviction for investors.
XRP’s performance has historically shown that when it moves, it often does so aggressively, rewarding patient holders and active traders alike. This pattern aligns well with broader altcoin market cycles, where XRP tends to outperform during bullish phases. As always, it’s essential to monitor price action around key levels, adjust stop-losses wisely, and stay updated with market news to make the most of this potential run.
✅ Show your support by hitting the like button and
✅ Leaving a comment below! (What is You opinion about this Coin)
Your feedback and engagement keep me inspired to share more insightful market analysis with you!

XRP 4H TIMEFRAME ANALYSISXRPUSDT strcuture shifted into bullish after CHoCH, Thats why I have marked OB+FVG as POI for long.

XRP/USDT Poised for Breakout from Symmetrical Triangle!Pattern Identified: Symmetrical Triangle
The symmetrical triangle is a consolidation pattern formed by a series of lower highs and higher lows, converging into a triangle shape. It reflects market indecision and often precedes a significant breakout, either upward or downward, depending on momentum and volume.
🔍 Pattern Description:
Upper Resistance Line (Descending): Connecting the lower highs since February 2025.
Lower Support Line (Ascending): Connecting the higher lows since December 2024.
Consolidation Zone: Price has been moving sideways within the triangle, indicating accumulation.
Critical Breakout Level: Around $2.23 — the price is currently testing this resistance.
📈 Bullish Scenario:
If the price successfully breaks above the upper triangle resistance with strong volume:
Target 1: $2.5855 (previous minor resistance)
Target 2: $2.9534 (key historical resistance)
Target 3: $3.2781
Maximum Target: $3.40 (local previous high and psychological level)
Breakout Confirmation: A daily candle close above $2.30 with significant volume could signal a long entry.
📉 Bearish Scenario:
If the price fails to break out and instead breaks down below the lower trendline:
Support 1: $2.00 (psychological & horizontal support)
Support 2: $1.85
Major Support: $1.55 (strong historical demand zone)
Breakdown Confirmation: A daily close below the lower triangle boundary with high volume would signal further downside.
📌 Summary:
XRP is nearing the apex of a symmetrical triangle — a major move is imminent.
A confirmed breakout could trigger a rally towards $3.40.
A breakdown may lead to a drop toward $1.55.
Recommendation: Wait for confirmation before entering long or short positions.
#XRP #XRPUSDT #CryptoBreakout #SymmetricalTriangle #XRPAnalysis #Altcoins #TradingView #TechnicalAnalysis #BullishCrypto #CryptoSignal

XRPUSDT Forming 2017-Style Flag — Major Breakout Loading! BINANCE:XRPUSDT is currently forming a classic bullish flag pattern, a setup that looks strikingly similar to what we saw back in 2017 before CRYPTOCAP:XRP went on a massive run. The price has been consolidating within a tight range, and this could be the calm before a powerful breakout.
Back in 2017, a similar flag formation led to a parabolic uptrend once the resistance was broken. While history doesn’t repeat exactly, this pattern suggests the potential for a significant upside move if the breakout confirms. Traders and investors should keep a close eye on this structure — a breakout from this flag could reignite bullish momentum and open the door for a sharp rally.
This is a buy and hold scenario for those who believe in XRP’s potential, but remember — risk management is key. Always use a stop loss below the flag support to protect your capital. Momentum could build quickly, so stay alert and watch for volume confirmation on the breakout.

#XRP/USDT#XRP
The price is moving within a descending channel on the 1-hour frame, adhering well to it, and is heading for a strong breakout and retest.
We are seeing a bounce from the lower boundary of the descending channel, which is support at 2.29.
We are seeing a downtrend on the RSI indicator that is about to break and retest, supporting the upward trend.
We are looking for stability above the 100 Moving Average.
Entry price: 2.30
First target: 2.33
Second target: 2.37
Third target: 2.42

#XRP/USDT#XRP
The price is moving in a descending channel on the 1-hour frame and is expected to continue upward.
We have a trend to stabilize above the 100 moving average once again.
We have a downtrend on the RSI indicator, which supports the upward move with a breakout.
We have a support area at the lower boundary of the channel at 2.25.
Entry price: 2.34
First target: 2.42
Second target: 2.47
Third target: 2.56

#XRP #XRPUSD #XRPUSDT #Ripple #Analysis #Eddy#XRP #XRPUSD #XRPUSDT #Ripple #Analysis #Eddy
I have identified the important supply and demand zones of the higher timeframe for you.
This analysis is based on a combination of different styles, including the volume style with the ict style.
Based on your strategy and style, get the necessary confirmations for this analysis to enter the trade.
Don't forget about risk and capital management.
The responsibility for the transaction is yours and I have no responsibility for your failure to comply with your risk and capital management.
💬 Note: Important liquidity is marked on the chart. Be careful of liquidity hunting. In my opinion, the important entry point for buying spot and long futures is at 1.0987$, and it will most likely be a sniper entry. The first target from the specified point will be $4 and the second target will be $10.
Be successful and profitable.

XRPUSDT 1D AnalysisXRP ~ 1D Analysis
#XRP Buy gradually after successfully breaking through this resistance line with a short-term target of at least 10%+ from here.

XRPUSDT The Calm Before the Storm: Major Breakout Loading…BINANCE:XRPUSDT has been trading within a well-defined horizontal channel for an extended period, signaling a prolonged consolidation phase. This kind of price behavior often precedes a major breakout, and all signs now point toward an explosive move to the upside.
What makes this setup even more compelling is the presence of an inverse head and shoulders pattern within the channel a classic bullish reversal formation. This pattern, forming after a long sideways trend, adds serious weight to the bullish narrative. It suggests that the accumulation phase is coming to an end, and buyers are preparing to take control.
A breakout above the upper boundary of the channel would confirm the pattern and could trigger a strong rally. Once XRP breaks out with volume, it may leave the consolidation zone behind for good and momentum could carry it to much higher levels.
Traders should watch closely for confirmation and manage risk accordingly. Always use a stop-loss to protect your capital. The opportunity is clear. CRYPTOCAP:XRP is gearing up, and the breakout could be unstoppable.
BINANCE:XRPUSDT Currently trading at $2.19
Buy level : Above $2.2
Stop loss : Below $1.95
Target : $3.5
Max leverage 3x
Always keep stop loss
Follow Our Tradingview Account for More Technical Analysis Updates, | Like, Share and Comment Your thoughts

XRPUSDT 1DXRP ~ 1D Analysis
#XRP Buy after successfully penetrating this resistant line with a short -term target of at least 10%+ from here.

XRPUSDT 1DXRP ~ 1D Analysis
#XRP Need to maintain this level of support, Break Down from this support level will re -test the support of $1,48

XRPUSDT 1DXRP ~ 1D Analysis
#XRP Buying when re -testing this support line may not be too bad.
with a short -term target of at least 10%+ from here.

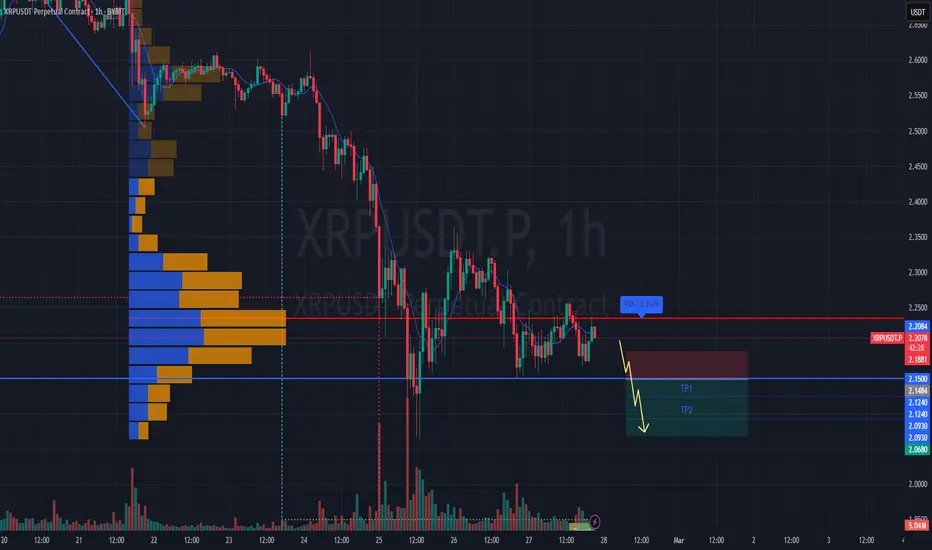
#XRPUSDT – Bearish Scenario, Expecting a Breakdown📉 SHORT BYBIT:XRPUSDT.P from $2.1484
🛡 Stop Loss: $2.1881
⏱ 1H Timeframe
⚡ Trade Plan:
✅ The BYBIT:XRPUSDT.P price is consolidating below POC (Point of Control) at $2.2119, indicating strong seller dominance.
✅ Attempts to push higher have been quickly rejected, suggesting buyer weakness.
✅ If the current support breaks, a strong downward move is likely.
🎯 TP Targets:
💎 TP 1: $2.1240
🔥 TP 2: $2.0930
⚡ TP 3: $2.0680
📢 A close below $2.1484 would confirm further downside movement.
📢 POC at $2.2119 is a major volume area, now acting as resistance.
📢 Increasing volume on the drop supports the bearish outlook.
📢 Taking partial profits at TP1 ($2.1240) is a smart risk-management strategy.
🚨 BYBIT:XRPUSDT.P remains under selling pressure – monitoring for confirmation and securing profits at TP levels!
XRPUSDT - LONG FROM POI 4HTechnically, XRP looks good for a mid-term trade!
The sloping line breaks through, but there is no volume as such due to market uncertainty. Therefore, I plan to wait for a local correction as opposed to retail traders and in the POI range , I will consider a long position
If my personal expectations are confirmed, I will consider the position in the format as indicated on the trading chart.
Targets:
$2.2695
$2.3663
$2.4492
Risk management - 1% on stop order

#XRPUSDT is testing key resistance—expecting a correction!📉 LONG BYBIT:XRPUSDT.P from $2.8320
🛡 Stop Loss: $2.8025
⏱ Timeframe: 1H
✅ Overview:
➡️ BYBIT:XRPUSDT.P is showing strong bullish momentum after breaking out of the consolidation zone, supported by increasing volume and a breakout above 2.8301.
➡️ The price continues its upward movement, and the current accumulation suggests a possible further rally.
➡️ POC (Point of Control) at 2.4307 indicates a major liquidity level, making a deeper retracement unlikely in the short term.
⚡ Plan:
➡️ Long from 2.8320, considering the current trend and demand zone confirmation.
➡️ Stop Loss: 2.8025 to minimize risk in case of a false breakout.
🎯 TP Targets:
💎 TP1: 2.8720 – the first resistance level where partial profit-taking is recommended.
💎 TP2: 2.9220 – the next key level for securing the remaining position.
📢 BYBIT:XRPUSDT.P is showing strong buying interest, and as long as the trend remains bullish, further upside potential exists.
📢 Keep an eye on resistance reactions, as profit-taking by larger players could trigger local corrections.
📢 If 2.9220 is broken with confirmation, further movement toward 2.9670 is possible.
🚀 BYBIT:XRPUSDT.P remains in an uptrend — expecting TP targets to be reached!

XRPUSDT 1DXRP ~ 1D Analysis
#XRP Buy gradually from this pattern. This bullish pattern will be broken soon. Just a matter of time. with a minimum target of 15%+

XRP/USD "Ripple vs US Dollar" Altcoin Market Heist Plan🌟Hi! Hola! Ola! Bonjour! Hallo!🌟
Dear Money Makers & Robbers, 🤑💰🐱👤
Based on 🔥Thief Trading style technical and fundamental analysis🔥, here is our master plan to heist the XRP/USD "Ripple vs US Dollar" Altcoin market. Please adhere to the strategy I've outlined in the chart, which emphasizes long entry and short entry. 🏆💸Be wealthy and safe trade.💪🏆🎉
Entry 📈 :
"The loot's within reach! Wait for the breakout, then grab your share - whether you're a Bullish thief or a Bearish bandit!"
Buy entry above 2.7000
Sell Entry below 2.2000
However, I recommended to place buy stop for bullish side and sell stop for bearish side.
Stop Loss 🛑:
Thief SL placed at 2.4500 (swing Trade Basis) for Bullish Trade
Thief SL placed at 2.5000 (swing Trade Basis) for Bearish Trade
Using the 4H period, the recent / nearest low or high level.
SL is based on your risk of the trade, lot size and how many multiple orders you have to take.
Target 🎯:
-Bullish Robbers TP 3.4000 (or) Escape Before the Target
-Bearish Robbers TP 1.4300 (or) Escape Before the Target
📰🗞️Fundamental, Macro, COT, Sentimental Outlook:
XRP/USD "Ripple vs US Dollar" Altcoin market is currently experiencing a Neutral trend (there is a higher chance for Bearishness)., driven by several key factors.
💎 Fundamental Analysis
Ripple's fundamentals are currently weak, with a decline in adoption and usage.
The company's partnerships and collaborations have not yet translated into significant price increases.
💎 Technical Analysis
The technical analysis gauge displays a neutral signal, with oscillators indicating a sell signal in the shorter timeframes but a buy signal in the longer timeframes. Moving averages suggest a neutral signal.
💎 Sentimental Market Analysis
The sentimental market analysis indicates a bearish trend, with the formation of a bearish divergence in XRP's price and DAA metrics. However, some traders believe that XRP is due for a rebound, with a potential target of $0.5.
💎 Macro Economics
The macroeconomic analysis indicates that the cryptocurrency market is highly volatile, with Ripple's price affected by global economic trends and investor sentiment.
💎 COT Report
According to the latest COT report, institutional traders are net short on XRP, with a significant increase in short positions over the past week.
- Non-Commercial Traders (Speculators): 30% Long, 70% Short
- Commercial Traders: 40% Long, 60% Short
- Non-Reportable Traders: 20% Long, 80% Short
💎 Positioning
The positioning analysis suggests that XRP is net short, with a large pin-bar indicating a short bias until price action changes. However, some traders are bullish, anticipating a breakout above the resistance level.
- Institutional Traders: 20% Bullish, 50% Bearish, 30% Neutral
- Banks: 15% Bullish, 55% Bearish, 30% Neutral
- Hedge Funds: 25% Bullish, 45% Bearish, 30% Neutral
- Corporate Traders: 10% Bullish, 60% Bearish, 30% Neutral
- Retail Traders: 30% Bullish, 40% Bearish, 30% Neutral
💎 Overall Outlook
Based on the analysis, the overall outlook for Ripple (XRP/USD) is bearish in the short term, with a potential decline in price due to the bearish divergence and net short positioning. However, some traders are bullish, anticipating a rebound and a potential target of $0.5. In the long term, the fundamental analysis suggests a stable market.
⚠️Trading Alert : News Releases and Position Management 📰 🗞️ 🚫🚏
As a reminder, news releases can have a significant impact on market prices and volatility. To minimize potential losses and protect your running positions,
we recommend the following:
Avoid taking new trades during news releases
Use trailing stop-loss orders to protect your running positions and lock in profits
📌Please note that this is a general analysis and not personalized investment advice. It's essential to consider your own risk tolerance and market analysis before making any investment decisions.
📌Keep in mind that these factors can change rapidly, and it's essential to stay up-to-date with market developments and adjust your analysis accordingly.
💖Supporting our robbery plan will enable us to effortlessly make and steal money 💰💵 Tell your friends, Colleagues and family to follow, like, and share. Boost the strength of our robbery team. Every day in this market make money with ease by using the Thief Trading Style.🏆💪🤝❤️🎉🚀
I'll see you soon with another heist plan, so stay tuned 🤑🐱👤🤗🤩

XRP Ideaxrp is forming an ascending channel on H4 AND H8 timeframe so we're waiting or a new touch on the red trendline
here w have a valid ascending trendline that got broken so we enter a short (sell) trade
Follow us or more ideas and updates

#XRP is forming a symmetrical triangle pattern! #XRP is forming a symmetrical triangle pattern!
We expect a strong bounce once it breaks out. 🚀
Keep an eye on this setup—it could be a great opportunity!
DYOR, NFA
#Crypto #BullRun2025 #Altseason
