Crypto Black Friday Sale!!The Crypto market is feeling the pressure today and has dropped a decent amount, i definitely am not worried too much at all i look at this as a great opportunity to scoop up coins at a nice discounted price and that is exactly my plan! Looking to grab some more XTZ today as we are down nearly 47% since the beginning of october and down roughly 25% on the week. Tezos is an absolute gem project i personally think and the gains in the long term i believe will be huge, the other great aspect and reason i am going to buy the dip here is too add to my already nice bag to continue staking which is a great option and good way to compound your gains. Price action has come all the way down to the 0.6 FIB level and i don't see us pushing much further if any further, we have heavy support here and aswell as downtrend support coming from our bullish wedge pattern which could give us that nice boost to the upside to kickstart another uptrend! Now looking at the MACD we are slowly but surely coming to what looks like an end to our red cycle with the histogram bars shrinking day after day and coming up on the midline where we could turn bullish! Also considering we have had 2 red cycles on the MACD a mega green cycle could be looming! Now the Squeeze momentum indicator, we are currently in the squeeze release part of this cycle but it seems to be winding down as the most explosive part has already happened, we can notice this by seeing the red bars starting to decrease day after day and ultimately until we push back into bullish territory, this is another reason i think we aren't going to see more heavy downside or anymore at all! Finally the Wavetrend, we have definitely bottomed out here on the WT and we are waiting for that boost from price action for us to reverse into our next bullish wave, we have been sitting in the buy zone for some time now and i think its a matter of days before we see this next bullish wave, which should be a big and explosive one! Keep in mind BTC has a tight grip on the whole market and can most definitely ruin the party especially with BTC dominance still pretty high, but also note BTC.D is in a downtrend and continues to fall! Not financial advice just my opinion!
Xtz

XTZ drops to $5Tezos price analysis is bearish today.
XTZ/USD saw bearish momentum take over yesterday.
Next support at $4.65.
Tezos price analysis is bearish today as we expect more downside to follow after a strong selloff over the last 24 hours. Likely, XTZ/USD will move to test the $4.65 previous low over the next 24 hours.

$XTZ Tezos near buy-zone! Tezos is an open-source platform for assets and applications backed by a global community of validators, researchers, and builders.
Rank 44 atm.
Depends on BTC if the correction is over.
Healthy correction and finds support, good moment for a buy IMO.
Good luck! Take profits on the road or sit on your hands.
Feedback welcome!
DYOR and please let me know what you think.

Tezos to $11Tezos is an open-source platform that addresses key barriers facing blockchain adoption for assets and applications backed by a global community of validators.

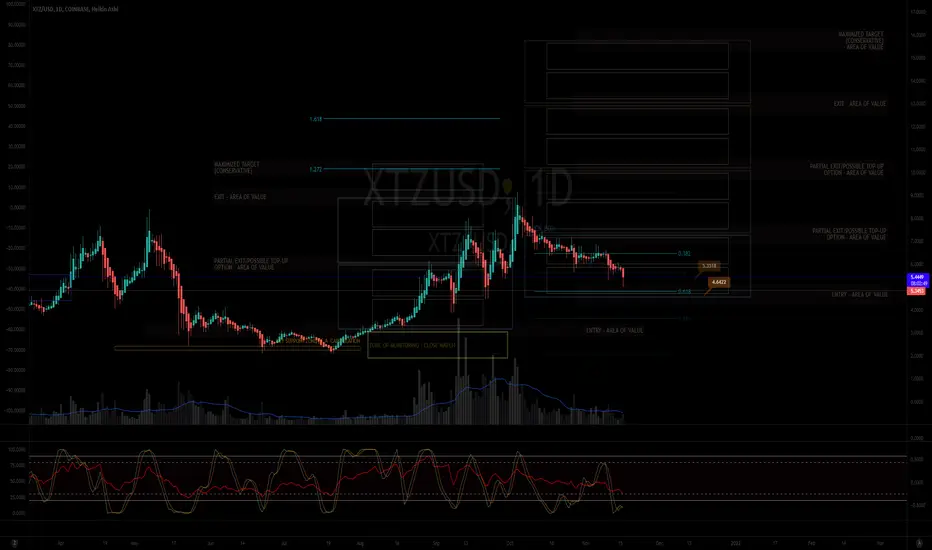
MY MINIMALIST ANALYSIS FOR TEZOS $XTZ
11.16.21
2353H +8 PACIFIC
ALERT: ENTRY POINTS
The Market has amazingly moved along the TOPS and BOTTOMS of our BOXES, signifying TURNING POINTS of PRICE ACTION.
JUST DYOR ENTRIES. Watch for Price action/ RSI and STOCH, VOLUME, and FIBS. Set your tight stop loss as any geopolitical, natural/man-made calamities will change the course for our TARGET AREAS OF VALUES.
REMINDER:
INDICATED ARE ENTRIES, PARTIAL EXITS/TOP-UPS, EXITS, and MAXIMIZED AREAS OF VALUE
"FOLLOW THE WHITE RABBIT!"
Just Follow the TOPS and BOTTOMS of the BOXES as a GUIDE where the MARKET will take you.
HOW TO USE THIS MINIMALIST CHART
Created on a MONTHLY, WEEKLY & DAILY Analysis (The Dynamics of the Market.)
It is designed for SWING TRADES at the BOTTOM. I do not SHORT, though, you can still use it.
You can CLICK AND hold THE CHART and PAN or DRAG IT.
TARGET ZONE IDENTIFICATION
The LARGE BOXES (Tops and Bottoms) are MAJOR pivot points that will occur sometime in the future. While the SMALL BOXES (Tops and Bottoms) are MINOR pivot points.
These can be entries to a BUY/ SELL POSITION, EXIT/PARTIAL EXIT/TOP-UP AREAS,
and, if you wish to hold longer for a MAXIMUM TARGET EXIT AREA OF VALUE - CONSERVATIVE (If price action conditions are right at that given moment.)
At times I include WAY BEYOND PARABOLIC Price TARGETS depending on The Character of the Market (CRYPTOS ONLY).
Watch out for your Volume, Chart Patterns, Candlestick Math, FIB COILS ( ABC ), Price Action, FIB LEVELS, Market Dynamics, especially institutional and retailer trading psychology.
Wishing you all The Best Trades and Thank you all for your Appreciation and Support of My Work.
Much thanks to My 3 Mentors. They are so much of a Blessing that I also wish to Share.
Vive Le Autist!
Vive Le Egalitarianism!
#XTZ LONG 🟩🔼 #XTZ LONG 🟩🔼
3rd try here. The bigger the fall, the higher the catapult.
Also on the 382 fib line play.

XTZ ready to bounce? 1:3 trade ideanice bullish trend in the big timeframes, we are facing big demand levels so I think we could bounce a little and maybe catch a nice gain
let's see if we have hit enough demand for now or we'll continue to absorbe them and tank lower
let's try

XTZ is in new descending channelHello To All
as we can see XTZ is in new descending channel & volume is decreasing any moment
I think it will fall more...
NOT A COMMERCIAL ADVICE , JUST AN IDEA
LOVE YA'LL

XTZ/USDT Long XTZ most undervalue crypto in my opinion possible huge cap and handle on daily time frame buy when RSI touched lower green line first tp is last high at falling wedge but then that is the break out of cup and handle pattern again this happens only if BTC doesn't shit the bed.

🔥 XTZ Long-Term Bullish Channel UpdateAround a month ago, I made an analysis on XTZ and the long-term bullish channel it was trading in.
Since then, XTZ has indeed bounced off the channel top resistance and has been trading down ever since.
By the looks of it, there's a decent chance that XTZ will continue to move downwards in the near future. In that case, I'd be looking at the purple reversal area for a potential bounce.
Happy trading!

If tezos can confirm this c&h breakout it will double in priceOf course I won’t be taking this pattern seriously until I see a clear break above the rim line and then witness the rim line get retested as solidified support. Until then a variety of things could occur to invalidate the pattern. As of right now however it is looking pretty promising and worth keeping an eye on. Until then I will remain neutral.

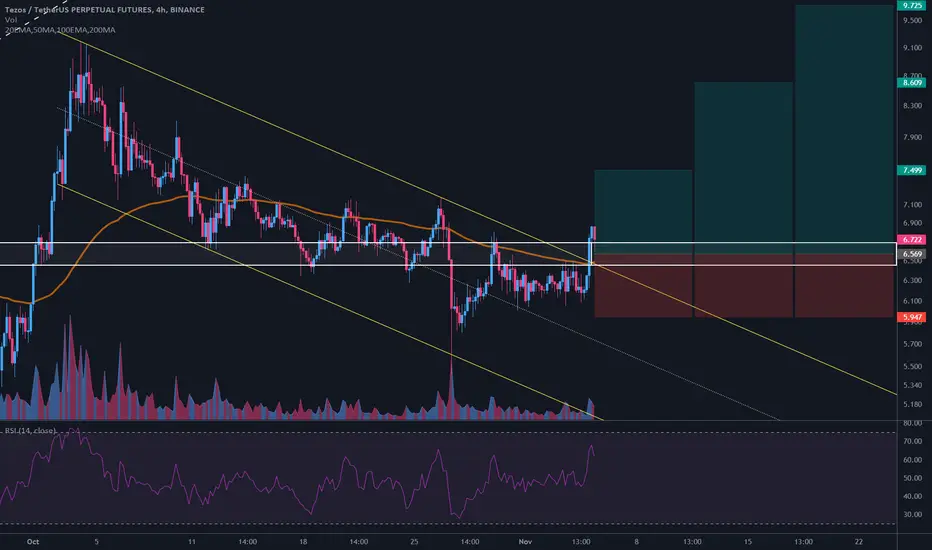
$XTZ/USDT 4h (Binance Futures) Descending channel breakoutTezos regained 100EMA and this time it seems ready to resume the up-trend for good!
Working with a PoS consensus algorithm, this is one of the fastest growing ecosystem for NFT, DeFi / BSC and Gaming, more info on tezos.com
Current Price= 6.722
Buy Entry = 6.685 - 6.453
Take Profit= 7.499 | 8.609 | 9.725
Stop Loss= 5.947
Risk/Reward= 1:1.5 | 1:3.28 | 1:5.07
Expected Profit= +28.32% | +62.10% | +96.08%
Possible Loss= -18.94%
Fib. Retracement= 0.618 | 0.883 | 1.117
Margin Leverage= 2x
Estimated Gain-time= 3 weeks
xtzusd 4h scaleindecision till the consistency and consolidation above or bellow the indicate box. after that we can expect the trend down or upward to the point triggered. ...
time analysis is on 13th of november


XTZ Slow and SteadyXTZ is coming to a point where it can give a sharp move to the upside if supported by the market.
Buying area - 6.20 to 6.50
Targets: 7.05, 7.39 and 8.0
Stop loss - as per your risk management. I usually put 10% on the downside as stop loss.
If it closes above 8 on day charts then 9+ is on cards.
Do your own research and trade at your own risk.

XTZ 1D Good growth, but needs correctionOur idea is first for those who trade XTZUSDT and hold a long
To begin with, it is worth saying that over the last month the price of Tezos made x3 rise, from $2 to $6 , and the rise was almost without correction, and they are needed.
We hardly believe that the price of XTZUSD will be able to rise above $6.25 again in the nearest future, maybe not even that and go straight down.
One of the factors that allows us to think so: critically large volumes at the recent theoretical highs.
The area where we would personally consider opening a long is around $3.60-4.20 . And the decision to go long should be made if and when the XTZ price approaches this zone.
In general, if you look at this chart and want a lot, you can see that the price is quite technically moving from level to level. And then it's every man for himself)
_____________________
Do you like the idea fulfilment? Does it help you trade and make a profit?
Do you want more forecasts from us?
Give us motivation! (Like, comment and donate). These little things won't make us rich, but they will warm the trader's soul while writing the next idea!

XTZUSDTHello Crypto Lovers,
Mars Signals team wishes you high profits.
We are in a daily time frame.
As you can see, the price is fluctuating on the support line that has supported the price several times.
There are two scenarios, if the trend can stabilize above the specified area, it can touch our target, but if it stabilizes below the support line, we predict a fall.
Warning: This is just a suggestion and we do not guarantee profits. We advise you analyze the chart before opening any position.
Wish you luck

TEZOS reached to its dynamic support #XTZUSDT need to close daily above 6.3 then it could be pump to 7.1 and next target will be 8
If #TEZOS lose it's support in 6.28 , next support gonna be 6

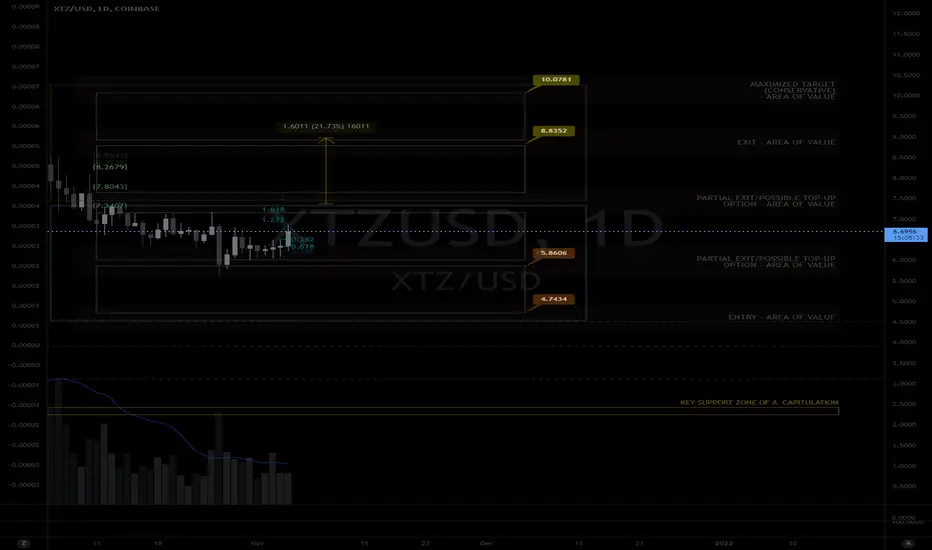
MY MINIMALIST ANALYSIS FOR TEZOS$SHIBA
11.05.21
1653H +8 SINGAPORE
ALERT:
AN AREA OF OPPORTUNITY FOR AN ENTRY! A coiled Market would be the best entry at PRICE MARK INDICATOR (RUST.)
Watch Volume Indicator and Price action at PRICE MARK.
INDICATED ARE ENTRIES, PARTIAL EXITS, EXITS, and MAXIMIZED AREAS OF VALUE
Disclaimer:
The findings of the following analysis are the sole opinions of the publisher of this idea and should not be taken as a piece of investment advice.
"FOLLOW THE WHITE RABBIT!"
Just Follow the TOPS and BOTTOMS of the BOXES as a GUIDE
HOW TO USE THIS MINIMALIST CHART
Created on a MONTHLY, WEEKLY & DAILY Analysis (The Dynamics of the Market.)
It is designed for SWING TRADES at the BOTTOM. I do not SHORT, though, you can still use it.
TARGET ZONES IDENTIFICATION
The LARGE BOXES (Tops and Bottoms) are MAJOR pivot points that will occur sometime in the future. While the SMALL BOXES (Tops and Bottoms) are MINOR pivot points.
These can be entries to a BUY/ SELL POSITION, EXIT/PARTIAL EXIT/TOP-UP AREAS
and if you wish to hold longer for a MAXIMUM TARGET EXIT AREA OF VALUE -CONSERVATIVE (If price action conditions are right.)
At times I include WAY BEYOND PARABOLIC Price TARGETS depending on The Character of the Market.
Watch out for your Volume, Chart Patterns, Candlestick Math, FIB COILS (ABC), Price Action, FIB LEVELS, Market Dynamics, and especially trading psychology.
Wishing you all The Best Trades and Thank you all for your Appreciation and Support of My Work.
Much thanks to My 3 Mentors!
Note:
Master your Trading Discipline
, Trader's Psychology and Institutional Trading Psychology