XTZUSD

Short Term accumulation zone and long term trendWith strong fundamentals in the background as far as news and usage goes (although I don't trade either of those), Tezos has been trading in a common accumulation range before previous spikes up, as you can see by the volume profile and historical movement.
While it can break either way or keep ranging, it's maintaining the long term trend line(s) support while ranging. Right now, BTC is bullish, and one possible scenario is that BTC takes a pause and XTZ makes it's move back up to possible resistance around $3ish, since crypto moves in rotations. Must break 2.75 at a minimum first though.

XTZUSD H2: Detailed trade plan BULLS/BEARS (SL/TP)(NEW)Why get subbed to to me on Tradingview?
-TOP author on TradingView
-15+ years experience in markets
-Professional chart break downs
-Supply/Demand Zones
-TD9 counts / combo review
-Key S/R levels
-No junk on my charts
-Frequent updates
-Covering FX/crypto/US stocks
-24/7 uptime so constant updates
XTZUSD H2: Detailed trade plan BULLS/BEARS (SL/TP)(NEW)
IMPORTANT NOTE: speculative setup. do your own
due dill. use STOP LOSS. don't overleverage.
🔸 Summary and potential trade setup
::: XTZUSD 2hour/candle chart review/outlook
::: currently we are range locked
::: mid-term also BEAR MODE
::: ongoing distribution / stuck in range
::: bulls unable to break the current range
::: spells more trouble mid-term
::: 2.75 range highs / 2.40 range lows
::: shorting near range highs makes sense
::: BEARS should get ready to SHORT HIGH
::: we are setting up for another correction
::: final TP bears is near 2.10 (20%+ correction)
::: recommended strategy: SHORT IT 2.75/2.80
::: TP BEARS is 2.10
::: higher risk strategy: BUY LOW 2.35/2.40
::: TP BULLS is 2.75 which is 15% gains
::: SWING trade setup / no fast gains here
::: SHORT/HOLD / do not expect miracle gains
::: SL is 5% max
::: good luck traders!
🔸 Supply/Demand Zones
::: N/A
::: N/A
🔸 Other noteworthy technicals/fundies
::: TD9/Combo update: N/A
::: Sentiment mid-term: BEARS/CORRECTION
::: Sentiment outlook short-term: RANGE/MIXED

XTZUSD to see a slight uptrend(1D) | Lower highs observedMarket in last 1 week
XTZUSD saw a slight uptrend after riding the lower band and moving up
Price volatility was very high. The market moved ~14.3%, between $2.74 and $2.4
Today’s Trend analysis
XTZUSD expected to see an uptrend as the price is trading between midline and lower band with lower highs observed
Price at time of publishing: $2.67
XTZ’s market cap: $1.98 Billion
Oscillator indicators are mostly neutral. RSI at 41
Moving average indicators are biased towards a downtrend. Ichimoku Cloud is neutral and Hull MA indicates a buying opportunity
Volume indicators saw a decrease in initial candles while an increase afterward with a low value for red candle
Price expected to see an uptrend as the price is trading between midline and lower band with lower highs observed. Most of the Oscillator indicators are neutral. MACD line crossed above the signal line with the histogram moving from negative to positive region, suggesting a bullish bias. RSI at 41, below the midline still in the neutral region. CCI is around -33, in the neutral region with an up move. Another interesting point to notice here is that volume saw a decrease in initial candles while an increase afterward with a low value for red candles indicating a shift from sellers to buyers.
----------------------------------------------------------------------------------------
The analysis is based on signals from 28 technical indicators, out of which 17 are moving averages and remaining 11 are oscillators. These indicator values are calculated using 1 D candles.
DM to get details of the above analysis and list of indicators & their values used to arrive at the above conclusion.
Note: Above analysis would hold true if we do not encounter a sudden jump in trade volume .
----------------------------------------------------------------------------------------
If you find the analysis useful, please like and share our ideas with the community!
- Mudrex

$Xtz hovering in critical zone but uptrend still continue$Xtz weekly dead cross wiped out the bullish scenario for shorter time frame. It is now in accumulation zone. A daily bullish crossover is about to happen which will save it from falling wedge and the downtrend. All over we are still in uptrend. The price may hover between $2.50 to $3.20 for the next 2 weeks. If it gets below $2.50 it will be a buy and won't last longer. As we see all coins get shaken out when $btc moves. If $btc drop $Xtz will drop with it but before that happen we might see the daily cross over and price moves higher approximately $2.50 to $3.20. if that happen we might not go below $2.30. Let's see how it plays out. Today it did excellent against $btc ponzu drop. I see bull step in to save it. We are going to see sell off for next two weeks as price gets closer to 3.20. In the long run I am still bullish. Accumulation right now can be very wise and profitable in the long run.


XTZUSD, Bullish Accumulation formingBullish Accumulation forming... If it continues down then we going to 2.1-2.2.


Tezos! Where did you go my love? XTZUSDGame's turning here guys, post tumble. RSI divergent, Fib goals and invalidation noted, Fib time zones suggest by the by the 7th we should see goals reached if we do. Anyway. I'm still bullish on XTZ.

tezos everyones least favoriteTezos has proven to be a failure for many traders. Its quickly become one of the most popular revenge traded charts and ultimately rekking everyone who trades it.
I actually think xtz has bottomed, and there is no where but up from here, as it gains momentum it should rocket it to new highs because everyone will buy it to "get their money back".

XTZ/USD LONG SET UP BUY XTZ/USD
ENTRY 1 $2.60
ENTRY 2 $2.30
SL 2.00
TP.1 $3.00
TP.2 $3.30
TP.3 $3.60
TP.4 $4.00


Tezos XTZUSDXTZ closed below 200 SMA.
For me it seems similar to the past. And still on this trade.
I think BTC will decide the direction.
P.S. If you need indicator I have in this chart, message me I will give it for free.
Kind Regards

XTZUSD to move sideways(1D) | Price riding the lower bandMarket in last 1 week
XTZUSD saw a downtrend and started riding the lower band
Price volatility was very high. The market moved ~49.9%, between $3.47 and $2.31
Today’s Trend analysis
XTZUSD expected to see a sideways movement as the price after riding the lower band got support from lower band
Price at time of publishing: $2.56
XTZ’s market cap: $1.9 Billion
Oscillator indicators are mostly neutral. RSI at 36
Moving average indicators are biased towards a downtrend. Ichimoku Cloud is neutral and Hull MA indicates a buying opportunity
Volume indicators saw an increase in recent red candles while a decrease in the blue candles with the decrease in the 20-candle moving average
Price expected to see a sideways movement as the price after riding the lower band got support from lower band. Most of the Oscillator indicators are neutral. MACD moving below the signal line with histogram size decreasing in the negative direction, suggesting a bearish bias. RSI at 36, below the midline still in the neutral region. CCI is around -113, in the oversold region indicating an uptrend. Another interesting point to notice here is that volume saw an increase in recent red candles while a decrease in the blue candles indicating a weakening buying pressure.
----------------------------------------------------------------------------------------
The analysis is based on signals from 28 technical indicators, out of which 17 are moving averages and remaining 11 are oscillators. These indicator values are calculated using 1 D candles.
DM to get details of the above analysis and list of indicators & their values used to arrive at the above conclusion.
Note: Above analysis would hold true if we do not encounter a sudden jump in trade volume .
----------------------------------------------------------------------------------------
If you find the analysis useful, please like and share our ideas with the community!
- Mudrex

$xtz loves breaking this support New cycle? Seems xtz likes to reset after breaking this support, as long it continues up with a higher low this could be the bottom

XTZ/USD - TEZOS GOING HIGHER?!We've been watching Tezos for quite some time.
We played the last rally from the $2.40 support zone and we're here again after a massive crypto sell off. We noticed a bounce slightly higher than the previous lows around this level.
Short term LONG trade idea to $3.20 level.
*NOT A FINANCIAL ADVICE, THIS IS JUST OUR PERSPECTIVE AND WE DO NOT RECOMMEND ANY TRADES WE PUBLISH ON OUR CHANNEL. YOU WILL LOSE MONEY.

XTZ currently at a historic support. How to play it?While XTZ has disappointed many because it hasn't broken out of this range, it's still been VERY profitable for anyone who traded it.
XTZ is currently at a solid support level. I personally entered a long position at 25k sats, a bit premature but I am ready to exit.
According to the previous XTZ price pattern, I expect at least 20% up to 47% BTC gains in the upcoming 7-15 days.
LONG CASE:
Buy @ 25k - 27k sats.
TP1 @ 31k sats.
TP2 @ 36k sats.
SL @ 1D close below 24k sats.
SHORT CASE:
Sell @ 24k-23.3k
TP1 @21k sats.
I will post more updates this week on the BINANCE:XTZBTC pair.
Feel free to challenge my TA in the comments, the best way to learn is through discussion!

Tezos (XTZ) - September 7Hello?
Dear traders, nice to meet you.
"Like" is a huge force for me.
By "following" you can always get new information quickly.
Thank you for always supporting me.
-------------------------------------------------- -----
Make sure you can get support at point 2.4614.
You also need to see if it can rise above the uptrend line (2).
You should also check if you can ascend to the critical section of 2.8886-3.2 to gather the force to ascend.
If it falls below the uptrend line (1), it is a short-term Stop Loss.
------------------------------------------
(Bithumb XTZKRW 1h chart)
In order to turn into an uptrend, it must rise above 3679.0 points.
However, if it is confirmed that it is supported by rising above 3324.0 points, I think it is highly likely to rise above 3679.0 points.
(We plan to publish it together with the XTZUSDT chart until the chart period is longer than about 6 months. We apologize for the inconvenience.)
-------------------------------------------------- -------------------------------------------
** Check support, resistance, and abbreviation points.
** Support or resistance is based on the closing price of the 1D chart.
** All explanations are for reference only and do not guarantee profit or loss on investment.
Explanation of abbreviations displayed on the chart
R: A point or section of resistance that requires a response to preserve profits
S-L: Stop-Loss point or section
S: A point or segment that can be bought for generating profit as a support point or segment
(Short-term Stop Loss can be said to be a point where profits and losses can be preserved or additionally entered through installment trading. You must trade from a short-term investment perspective.)


XTZ - time to go back up XTZ finally hit the bottom of the channel. Expecting it to go back up towards the top.
Anything that falls below the channel is a further trap to make you sell what you've been buying on this dump. I've been eyeing this bitch for a while now and think it's time to go.
Not trading advice, and do your own research.
thoughts/comments?
TG


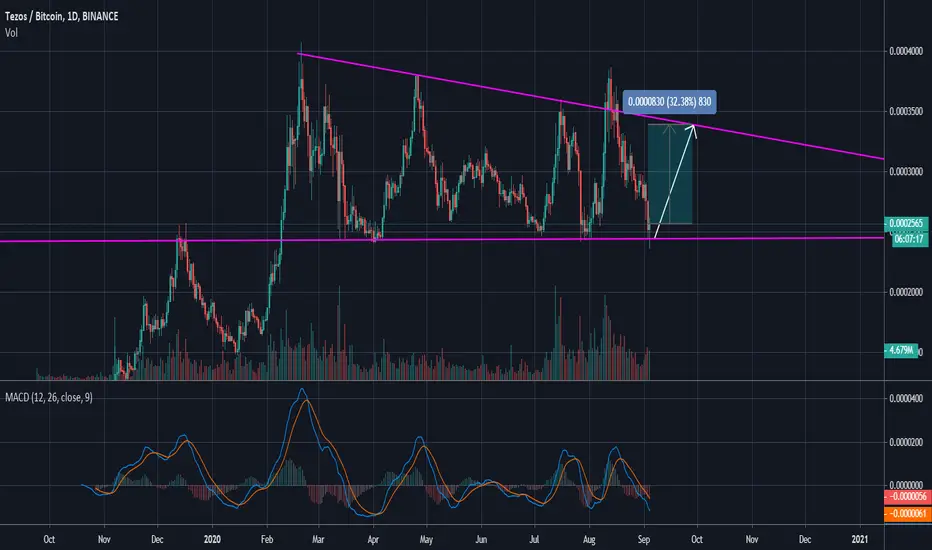
XTZ - Tezos Bouncing Off Strong Support, Long for 32% TargetConsider this long position here. But be mindful of Bitcoin because it could ruin this trade.
Tezos at a key level, retest of resistance inc.XTZ is currently at a key level of $3.3 If we see it hold I believe in the next couple of weeks we will see a retest of $3.9-$4 level.
Got my bags ready!
