XTZUSD to see a downtrend(1D) | Series of HL and LH observedMarket in last 1 week
-XTZUSD saw a downtrend breaking below the midline band
-Price volatility was very high. The market moved ~20.59%, between $3.94 and $3.27
Today’s Trend analysis
-XTZUSD expected to see a downtrend as a series of higher lows and lower highs were observed with Bollinger band squeeze
-Price at time of publishing: $3.63
-XTZ’s market cap: $2.69 Billion
-Oscillator indicators are mostly neutral. RSI at 53
-Moving average indicators are biased towards an uptrend. Ichimoku Cloud is neutral
-Volume indicators saw a decrease in volume as blue candles were observed suggesting a weak buying pressure
Price expected to see a downtrend as a series of higher lows and lower highs were observed with Bollinger band squeeze. Most of the Oscillator indicators are neutral. MACD below the signal line with histogram size decreasing in the negative direction, suggesting a bearish bias. RSI at 53, above the midline still in the neutral region with an up move. CCI is around -30, still in the neutral region. Another interesting point to notice here is that a decrease in volume is observed as blue candles are seen, suggesting a weak buying pressure.
----------------------------------------------------------------------------------------
The analysis is based on signals from 28 technical indicators, out of which 17 are moving averages and remaining 11 are oscillators. These indicator values are calculated using 1 D candles.
DM to get details of the above analysis and list of indicators & their values used to arrive at the above conclusion.
Note: Above analysis would hold true if we do not encounter a sudden jump in trade volume .
----------------------------------------------------------------------------------------
If you find the analysis useful, please like and share our ideas with the community!
- Mudrex
XTZUSD


Tezos Took A Beating — New Target In Sight
XTZUSD hit both our 15% and 25% target... even bumping into our moon rocket icon, as per our previous Tezos analysis:
Then Tezos got dragged back down with the rest of the market and now looks to be recovering upwards momentum as shown here on the 6-hour chart with moving averages now crossing over.
With an 8% target back up to previous resistance, Tezos may then make another attempt at consolidating on top of that level ready for new price discovery beyond the All Time High.
Build and optimise your own trading strategies with the beta version of our algo-assisted backtesting tool.
Note: SparksterSignals (including our technical analysis and our algorithmic backtested signals) are not provided as financial advice.


XTZ.USDT (Y20.P3.E2.v3).Now we enter--- Continuation from the previous post on XTZ, link below ~~~
Hi All,
OBSERVATIONS:
==================
> The 2 Day chart has given a nice bullish candle off a strong support area and fib level in an uptrend on the macro.
> The daily chart below gives indicators as a reversal with upward pressure.
> 21/34 EMA has confluence with the price and trend.
> BTC moving sideways
> SP500 steady and likely to go slowly with some undecided upward direction, some more.
THOUGHTS:
==================
Buy, look at the lower time frames to decide when to go in.
Cheers,
S.Sari
DAILY Chart:
4 HRLY chart: 2 touches to confirm support. You might want to wait for another touch but unlikely.
PREVIOUS POST
Have changed my mind on the ABC pullback, based on what BTC is doing for now.

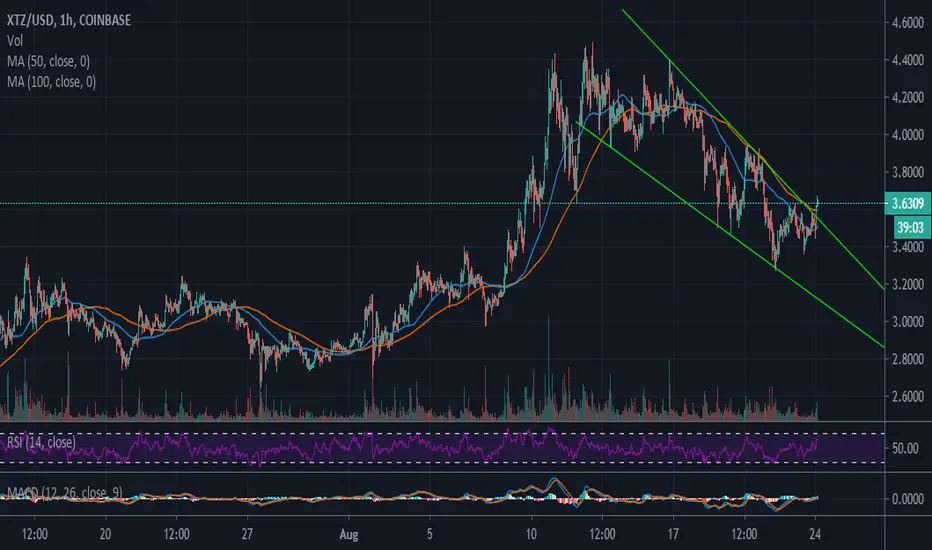
Tezos Price Analysis: XTZ/USD falling Wedge Pattern Breakout
Tezos bulls revive the uptrend after bouncing off support at $3.20.
XTZ/USD could build on the wedge pattern breakout and achieve highs not only above $4.00 but also $4.50.
Tezos bulls managed to defend the support at $3.20 following a continued breakdown from the 2020 high traded recently at $4.50. The downtrend remained unstoppable with the price breaking support after support. The buyer congestion at $3.20 this past weekend was a fresh breath of air into the bullish camp as XTZ/USD commenced the ongoing reversal towards the coveted $4.00.
At the time of writing, the price is trading above a falling wedge pattern following a breakout. Tezos is dancing at $3.61 amid the push to reclaim the inches of the ground towards $4.00. The price is also trading above the moving averages too where the 50 SMA $3.50 and the 100 SMA at $3.59 in the hourly range are in line to provide support in the event a reversal comes into the picture.
Looking at Tezos from a technical perspective, it becomes apparent that buyers are dominantly in control. This is reflected by the Relative Strength Index (RSI) sharp spike towards the overbought region (70). Besides, the Moving Average Convergence Divergence (MACD) cross above the mean line (0.00) confirms the bull’s increasing influence over the price.
Tezos is poised for more action above $4.00 and this will mainly build on the breakout above the falling wedge pattern. Trading above $4.00 will pave the way for gains beyond the yearly high at $4.50.
XTZ/USD Intraday Levels
Spot rate: $3.64
Percentage change: 3.78%
Relative change: 0.1297
Trend: Bullish
Volatility: Expanding

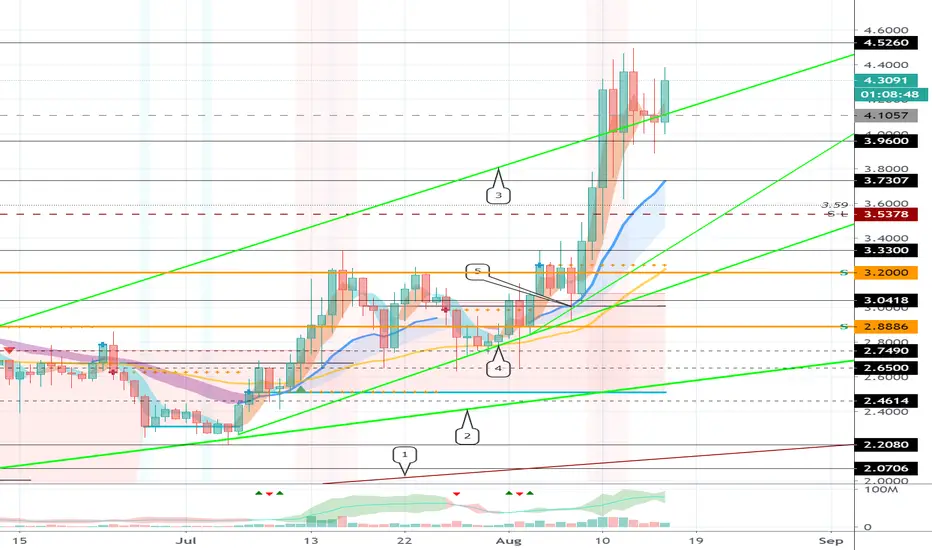
Tezos (XTZ) - August 24Hello?
Dear traders, nice to meet you.
"Like" is a huge force for me.
By "following" you can always get new information quickly.
Thank you for always supporting me.
-------------------------------------------------- -----
You need to make sure you can get support at point 3.5378.
It remains to be seen if it can rise above the uptrend line (5) and gain support at 3.7307.
If you move down at 3.5378, we have to see if we can get support at 3.33 and the uptrend line (4).
If you are supported in the 2.8886-3.2 section, I think there is a possibility to create a new wave.
The 2.8886-3.2 section is a very important section in XTZ price.
-------------------------------------------------- -------------------------------------------
** Check support, resistance, and abbreviation points.
** Support or resistance is based on the closing price of the 1D chart.
** All explanations are for reference only and do not guarantee profit or loss on investment.
Explanation of abbreviations displayed on the chart
R: A point or section of resistance that requires a response to preserve profits
S-L: Stop-Loss point or section
S: A point or segment that can be bought for generating profit as a support point or segment
(Short-term Stop Loss can be said to be a point where profits and losses can be preserved or additionally entered through installment trading. You must trade from a short-term investment perspective.)


XTZUSDT. Short. Trend line & support retest. XTZUSDT 1D. Within an ascending channel which in itself is bullish. That said I am expecting a retest of recent support and will be particularly interested in any activity around the trend line marked 'A'. On the hourly I see it being more bearish than bullish. We had a bear flag break to the downside. From a Fibonacci standpoint 0.5 (which is not in fact a Fibonacci number) looks most likely for a test.

XTZ longLooking to keep the bounce momentum from the local low to propel us to the uppers 3s before coming back down. Long the short term, play it safe long term.

Support everywhere for $XTZ2DAYCHART Linear Regression current price supported by the midline and price resistance (green)
On the 4hr Price has bounced off the bottom channel of the LinReg and the 6 hour price is actually out of it and oversold.
Look at where the current TopCap is placed and you can see previous tops marked, we have a long way to go yet!
Warning: What we need to see is that the MFI start looking upward soon, if not we will continue to go down and do a Full oversold on many other indicators
Thanks That's a wrap
This is based on how I read the charts

Tezos is at Support Offering 30% ProfitTezos (XTZ) just hit its all-time high at $4.48 last week. It now stands at support, which was the high during its last bull run in February this year.
Let’s take a look at Tezos and its likely forecast.
What is Tezos and How Does it Work?
Tezos is a platform designed to provide code correctness and safety for both its assets and use cases. The platform’s smart contract language facilitates formal verification, which is a methodology commonly used in mission-critical environments such as the electric power systems, aerospace, and nuclear industries.
Tezos's architecture and upgrade mechanism allow the network to propose and adopt new technological innovations as they emerge. This capability enables the protocol to remain up to date regarding innovations without sacrificing community consensus.
All stakeholders may participate in network upgrades by evaluating, proposing, or approving changes. Additionally, stakeholders can help to secure the network (via delegating or baking) and avoid being diluted by inflation.
Tezos is thus a multi-purpose platform that supports decentralized applications (DApps) and smart contracts. It is similar to Ethereum in nature, and similar to Ethereum, it has an unlimited supply.
Tezos (XTZ) on the Chart
Last week, XTZ hit its all-time high at $4.48 and currently stands at support. The price may fall further at the support of $3.33-3.15, as displayed by the green rectangle on the chart. If a position is opened just before that support level and closed just below the resistance at $4.3, then it offers an opportunity of around 30% profit.
It is impossible to predict all price movements of a coin or any asset in general. Therefore, professional traders always recommend having a stop loss in place at a level where you feel comfortable.

XTZUSDT, LONG, PAY ATTENTION FOLKS.....GET READYLETS WATCH BTC CAREFULLY BUT I THINK WE ARE IN , ABOUT TO MAKE A RETRACEMENT TO 4.2 - 5.0.... TRADE CAREFULLY...

XTZ Potential Adam Eve Pattern Potential pattern breakout to ATH. I think its XTZ turn to take the throne since LINK is gassing out


Tezos (XTZ) - August 17Hello?
Dear traders, nice to meet you.
"Like" is a huge force for me.
By "following" you can always get new information quickly.
Thank you for always supporting me.
-------------------------------------------------- -----
It remains to be seen if it can rise above the 4.526 point.
You also need to see if you can get support at the uptrend line (3).
With support at the volume profile point of 4.1057, the uptrend is expected to continue.
-------------------------------------------------- ----------
Coin market volatility period (August 14-17).
Therefore, I think careful trading is necessary.
I think it is better to observe the flow rather than rushing to trade according to the price flow.
I think this is a time when only minimal trading is possible to preserve profit and loss.
-------------------------------------------------- -------------------------------------------
** Check support, resistance, and abbreviation points.
** Support or resistance is based on the closing price of the 1D chart.
** All explanations are for reference only and do not guarantee profit or loss on investment.
Explanation of abbreviations displayed on the chart
R: A point or section of resistance that requires a response to preserve profits
S-L: Stop-Loss point or section
S: A point or segment that can be bought for generating profit as a support point or segment
(Short-term Stop Loss can be said to be a point where profits and losses can be preserved or additionally entered through installment trading. You must trade from a short-term investment perspective.)
XTZ finding support at previous resistanceXTZ seems to have found support at previous resistance for now.

XTZ/USD formed Bullish GartleyDust temporarily settled on this pair, while I was surprised by the weakness by breaking down the ascending channel to retest the newly flipped Feb high resistance line, I kind of see the setup now.
This Gartley is a very powerful pattern to the upside and I expect to see the price return to the high range of this consolidation, keep staking Tez warriors!

XTZ bearish fakeout outlookXtz escaped his bullish pennant with a real hard bear work...
however, decreasing volume might hint us about this move to be very weak and not sustained.
Price will most probably catch up later tonight.

XTZUSD to see slight uptrend(1D) | Gap up in Bollinger Band seenMarket in last 1 week
-XTZUSD saw an uptrend and moved sideways thereafter
-Price volatility was very high. The market moved ~23.69%, between $4.49 and $3.63
Today’s Trend analysis
-XTZUSD expected to see a continued uptrend as after riding the upper band gap up is seen with the conversion line above the baseline and green cloud
-Price at time of publishing: $4.1076
-XTZ’s market cap: $3.03 Billion
-Oscillator indicators are mostly neutral. RSI at 62
-Moving average indicators are biased towards an uptrend. Ichimoku Cloud is neutral
-Volume indicators saw a decrease in volume as price started moving sideways with the traded volume decreased from 10.72M to 4.21M
Price expected to see a continued uptrend as with the gap up in Bollinger band and price riding the upper band with conversion line above baseline with green cloud and band expected to squeeze. Most of the Oscillator indicators are neutral. Signal line approaching MACD with histogram size decreasing in the positive region. RSI at 62, above the midline still in the neutral region. CCI is around 67, moved from the overbought region to a neutral region. Another interesting point to notice here is that volume is decreasing in the last few candles as the price started to move sideways after the breakout.
----------------------------------------------------------------------------------------
The analysis is based on signals from 28 technical indicators, out of which 17 are moving averages and remaining 11 are oscillators. These indicator values are calculated using 1 D candles.
DM to get details of the above analysis and list of indicators & their values used to arrive at the above conclusion.
Note: Above analysis would hold true if we do not encounter a sudden jump in trade volume .
----------------------------------------------------------------------------------------
If you find the analysis useful, please like and share our ideas with the community!
- Mudrex

Tezos Ascending TriangleWell lookie lookie we might have a cookie. Do your own research but the target here looks to be around $6 if this thing plays out.
Mind you, first we need to work out way into this triangle so this may be an early call. But the possibilities are there.
Happy trading!

I consider XTZ uptrend confirmedAfter recent break out, we have been witnessing some turbulent consolidation. The battle between bear and bull is strong, but I see early signs of bull having upper hand. This TA isn't complicated and should be quite self-explanatory. First target would be upper trend line of ascending channel whenever it gets touched, but personally I won't even sell at that point - I'm buying and holding!
