Heading to $4 Tezos has been building up volume the last few weeks and wants to push up to $4 range.
XTZUSD

XTZ to $6 - former ATH acting as support S/R flip Long term game, XTZ looking like it's turning its former ATH around $3.95 into strong support, consolidation before the next leg up. Upper end of the channel ~$6, but as we're entering what could be a pretty impressive bull market for much of crypto I'm not gonna put an upper limit on this. Tezos is one of the stronger projects in crypto IMHO, and with continued ETH struggles I expect it to gain a greater foothold amongst layer one projects going forward.


Tezos XTZ/USD Elliot Wave Roadmap to $10 I'm sharing with you guys my first Elliot Wave count, I hope you like it.
This is not financial advice.
Please like and leave a comment.
Peace & Love

Tezos is about to break outLooks good, Im buying at every $4.00 opportunity.
About to reenter price discovery

XTZ might retest supportwith a break of the $4.05 level, other wise if it breaks over $4.35 it is going to $5.
XTZ is very bullish, so buy the dip.

Tezos technical indicating a buy setup!! Margin trade XTZ/USDTThe real play here is Tezos’ development architecture, which allows for the rapid deployment of security token offerings (STOs) onto a highly stable platform.
Let me explain...
STOs are public offerings that use tokenized digital securities. Think of them like stock certificates that trade on a blockchain instead of a stock exchange. You can use STOs to trade real financial assets, such as equities and fixed income. Investors can store, trade, and exchange their STOs on the blockchain.
And we’re already seeing serious financial players turning to Tezos for their corporate needs – especially in real estate, which holds trillions in value.
Plus, you can do things not available in the market today, such as sell a building’s income stream, appreciation rights, and depreciation rights separately.
So you can begin to see the value proposition of tokenizing just real estate alone through STOs is huge. This approach can be applied toward forestry, mining, or any other type of real estate development project.

Tezos (XTZ) - August 4Hello?
Dear Traders, Nice to meet you.
"Like" is a great power for me.
By "following" you can always get new information quickly.
Thank you for always supporting.
-------------------------------------------------- -----
It is rising at the 2.8886 key point.
In order to continue the upward trend, we need to see if we can rise above the downward trend line (4).
If you stray from the 2.557-3.1 section, you are expected to create a new wave.
Short-term Stop Loss when deviating from various trend lines.
-------------------------------------------------- -------------------------------------------
** Check support, resistance and abbreviation points.
** Support or resistance is based on the closing price of the 1D chart.
** All descriptions are for reference only and do not guarantee profit or loss on investment.
Description of abbreviations shown in chart
R: Resistance point or section, where a countermeasure is needed to preserve revenue.
S-L: Stop-Loss point or section
S: A point or section that can be purchased for profit generation as a support point or section

Tezos XTZ D Bullish Analysis$XTZ is in a bullish sentiment holding up HTF support well and consolidating before it is ready for a rally. As shown it the graph it needs to maintain support trend line and break first key resistance $4.53 before a big margin for exponential price growth towards $7.43 range. Having to break that we will then see price actions towards $9.18, $11.149. If the momentum keeps up we have another big gap that goes all the way to $19.15 - $21 range. This needs to have a constant lookout for reversal and new support line. Resistance needs to be broken accordingly in order to go for each higher target

XTZ tezos USD Still Long. Right at the ceiling from this point on though. I think some swings are imminent but will overall recover. Macro. ( I know exact measures matter. But, sometimes keeping it simple goes further.)


Tezos New All Time Highs!Tezos has been pushing up nicely over the last few days, I've been long on XTZ since $3 and I expect higher prices to come. We never know just how far an asset will run when it makes new ATH's. So for now, I would say a good target for XTZ is somewhere between $5-$6. We could go much higher, but for now, it's best to play it conservatively.


XTZ, follow Chainlink my friend!Tezos is following chainlink. Let's wait and see! Staking untill we make it!!

$XTZ / #USD, Retesting ATH $ level around ~4$ w/ volume...$XTZ / #USD
Retesting ATH $ level around ~4$ w/ increasing volume...
UCTS indicator showing buy signals across multiple timeframes.. (bullish)
While #BTC will have an impact on continuation or not above this level, I remaing bullish for 5/6$ per #XTZ

XTZ/USD time to reload Buy opportunityAs i broke down on the previous post about tezos. i will link it below
we saw a beautiful retracement to the support level with nice rejection so we are loading our buying . which i mean you buy tezos and hold. you could margin trade but make sure you manage your risk!!

XTZUSD expected to see an uptrend (1D) | Suggests a breakoutMarket in last 1 week
-XTZUSD saw an uptrend with high as $4.43
-Price volatility was very very high. The market moved ~95.1%, between $4.43 and $2.27
Today’s Trend analysis
-XTZUSD expected to see a continued uptrend as it was riding the Bollinger bands and with the volume not that loo breakout is expected
-Price at time of publishing: $4.04
-XTZ’s market cap: $2.96 Billion
-Oscillator indicators are mostly neutral. RSI at 66
-Moving average indicators are biased towards an uptrend. Ichimoku Cloud is neutral
-Volume indicators saw increase in volume with a slight decrease in the last candle which are above the 20-candle moving average
Price expected to see a continued uptrend as first the price was moving inside the bands with Upper band acting as resistance and lower as support but in the last few candles the price is riding the bands along with a substantial volume is traded suggesting a breakout. Most of the Oscillator indicators are neutral. MACD histogram size increasing in the positive region, with MACD line above the signal line. RSI at 66, above the midline in the neutral region. CCI is around 148, in the overbought region suggesting a bullish bias. Another interesting point to notice here is that volume is increasing in the last few candles being above the 20-candle moving average.
----------------------------------------------------------------------------------------
The analysis is based on signals from 28 technical indicators, out of which 17 are moving averages and remaining 11 are oscillators. These indicator values are calculated using 1 D candles.
DM to get details of the above analysis and list of indicators & their values used to arrive at the above conclusion.
Note: Above analysis would hold true if we do not encounter a sudden jump in trade volume.
----------------------------------------------------------------------------------------
If you find the analysis useful, please like and share our ideas with the community!
- Mudrex

XTZUSDXTZUSD
One of the top coins that will give good growth during the Altseason
I recommend to buy for a long term
f you like what I do, put 👍 and subscribe
Waiting for your comment, what do you think about this?

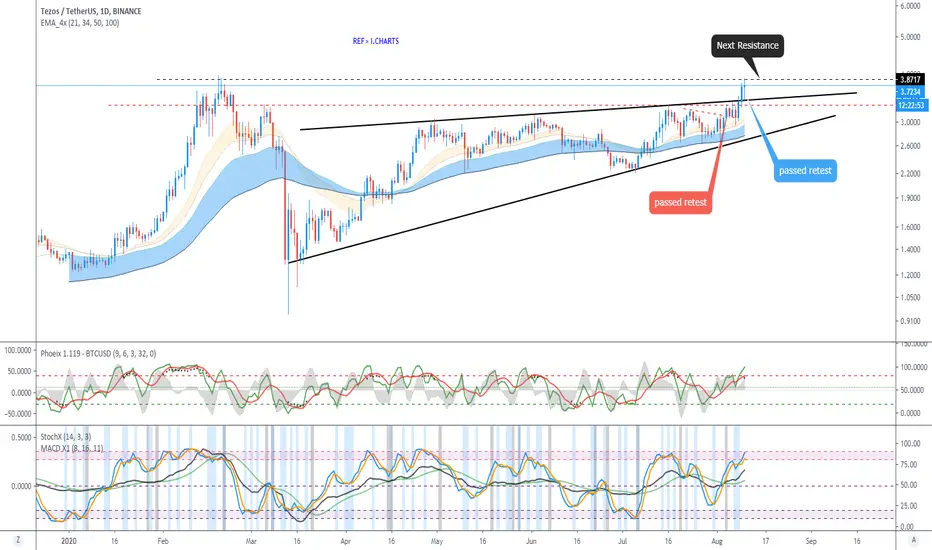
XTZ.USDT (Y20.P3.E3).TA on the Macro StructureHi All,
** This is a additional TA to the previous post on XTZ with BTC pairing **
As we had a strong BTC dominance divergence play out, we had XTZ.BTC price drop and bounce significantly while slowly regaining lost territory.
I did this TA against the USDT to see if its still within the acceptable levels for a next wave up. Happily to say, the restests of the previous resistances passed.
As per chart, we have one more resistance and after that, open roof.
My thoughts:
===================================================
> Daily indicators are positive, bullish with convergence and hence stay in the trade
> I would expect 2 touches to the resistance and 2 touches to the below support before the breakout otherwise its out.
Please give me a tick or like for this post.
Regards,
S.Sari
PREVIOUS POST
I have noted that we have price above the yellow key level meaning my TA is still relevant.
XTZ/BTC - TEZOS - is in a VERY BULLISH TRIANGLE!XTZ/BTC - TEZOS - is in a VERY BULLISH TRIANGLE!
Enter in the green area. If price action falls to the bottom of the triangle, that would be agreat entry.
BTC needs to behave! Keep an eye on Bitcoin and Bitcoin Dominance!
Trade safe my friends....
BINANCE:XTZBTC

xtz growing up to 3.88 in short space of timeXTX in free growing up in short time. 3.88 will be the new resistance. We have to see if maitain that value or make a down to 3


