XTZUSD expected to see an uptrend (1D) | Suggests a breakoutMarket in last 1 week
-XTZUSD saw an uptrend with high as $4.43
-Price volatility was very very high. The market moved ~95.1%, between $4.43 and $2.27
Today’s Trend analysis
-XTZUSD expected to see a continued uptrend as it was riding the Bollinger bands and with the volume not that loo breakout is expected
-Price at time of publishing: $4.04
-XTZ’s market cap: $2.96 Billion
-Oscillator indicators are mostly neutral. RSI at 66
-Moving average indicators are biased towards an uptrend. Ichimoku Cloud is neutral
-Volume indicators saw increase in volume with a slight decrease in the last candle which are above the 20-candle moving average
Price expected to see a continued uptrend as first the price was moving inside the bands with Upper band acting as resistance and lower as support but in the last few candles the price is riding the bands along with a substantial volume is traded suggesting a breakout. Most of the Oscillator indicators are neutral. MACD histogram size increasing in the positive region, with MACD line above the signal line. RSI at 66, above the midline in the neutral region. CCI is around 148, in the overbought region suggesting a bullish bias. Another interesting point to notice here is that volume is increasing in the last few candles being above the 20-candle moving average.
----------------------------------------------------------------------------------------
The analysis is based on signals from 28 technical indicators, out of which 17 are moving averages and remaining 11 are oscillators. These indicator values are calculated using 1 D candles.
DM to get details of the above analysis and list of indicators & their values used to arrive at the above conclusion.
Note: Above analysis would hold true if we do not encounter a sudden jump in trade volume.
----------------------------------------------------------------------------------------
If you find the analysis useful, please like and share our ideas with the community!
- Mudrex
Xtzusdforecast

XTZUSD Update (Potential Breakout)Since the last time I reviewed XTZUSD we saw a breakout and retest on the upper trend line 3 times before making it's first higher high and higher low. We are currently in a crucial moment of whether we can close/hold above ATH in order to continue moving higher. I believe the most likely scenario would be another retest on the upper Fibonacci retracement before continuing the trend. A lot of other coins have been highly price-sensitive at ATH recently and XTZ could just be lagging.
Keep in mind BTC is close to a potential rally as well. Could absorb all the capital from alts if it does.
Hope you all enjoyed the technical analysis on XTZ, I will continue to update my thoughts as we move further into these exciting times. Please consider leaving a like and following for more updates on stocks and cryptocurrency.
Cheers, PsychedCrypto

Tezos (XTZ) Be Ware!!! It Can Be A Bull TrapHi, friends hope you are well and welcome to the new update on Tezos coin. The price action of Tezos coin is moving in a wedge pattern. After hitting the resistance of the wedge on 16th of July so far the move of the price action up to the support is still due. After placing the volume profile on the complete price action moving within this wedge pattern. It can be easily observed that the trader’s interest is high even below the support and if we watch the interest of the traders from the upside then we have the trader’s interest below the resistance that is another bearish signal. Therefore the price action can be moved more down at least up to the support of this pattern.
The simple moving averages are forming bear crosses:
If we watch the different simple moving average it with the time period of 25, 50, 100 and 200 then recently the price action has broken down the 25 simple moving average. We have also received a bear cross between 50 and 100 SMAs. If 50 simple moving averages will move more down to form a death cross with 200 SMA then it will be another bearish signal that will trigger more strong rally to the downside. At this time the price action is trying to break out the 25 SMA again.
Formation of BAT pattern:
In the meanwhile the price action is likely to complete the final leg of bullish BAT pattern. After initial leg the A to B leg is retraced between 0.382 to 0.50 Fibonacci retracement level. Then C leg is projected between 0.382 to 0.886 Fibonacci projection of A to B leg. Now we have received two confirmation for the bullish BAT. And as per Fibonacci sequence of this pattern the final leg should be etraced between 0.786 to 0.886 retracement level. That start from $2.45 and ends up to 2.34 dollars. After a sequence of bearish candles some bullish candlesticks are appeared. Therefore, it can be a bull trap because if the price action will complete the BAT pattern then it can move more down and from the potential reversal zone it can start the next rally to the upside. However, if the price action will not complete the final leg then the pattern will be invalidated and the price action may form an up channel.

Tezos On A Tumble
Short-term moving averages help reveal price swings at any time-frame and produce good signal strategies. Here we can see short-term moving averages on XTZUSD with the yellow line whipsawing downwards into the grey line suggesting negative pressure on price.
MACD is pushing down
Candle formation also showing negative
We are now short-term neutral, even short, on Tezos.

Tezos broked the Trendline upside ! Now wait for a pullback !Tezos broked upside the Trendline or Trend Resistance, although volume is very less, this indicates a Pullback must occur.
Wait for the pullback to occur then Buy/Long
Profit Target : 10-12%
Put stop loss below the previous low.
Risk/Reward : 1 : 3

Tezos; If the symmetrical triangle breaks, a 15% drop will occurTezos (XTZUSD)
Currently XTZ is trading inside a symmetrical triangle pattern !
Recently a bearish MA crossover occured and it indicates that the chance is higher that the breakout will occur below the triangle !
I am already active on this trade; entered on the trend resistance of the triangle.
Stay Tuned !
👍

XTCBTC beautiful H&S short-longWell that might sound a bit of a contradiction by short to long what I meant was: TP1 = 1st green horizontal; short, 2nd long: red is stop for both.
So basic law of averages leaves me with no choice but to keep it neutral.
If you guys want my personal opinion — take the long approach . I ALWAYS read the white papers of every coin/token ever invested in even if it was a quick flip.
Boggles my mind how people don’t do that I know and I guess I could be one of those unique individuals (and not in the good sense — just weird) But at the end of the day the way I look at it: you wouldn’t purchase a produ ct or service w/o knowing what it was so why swing trade coins and tokens when you don’t know what they do?
Fundamentals and indicators aside — This is and always has been an extremely volatile market so Maximizing every step of the way to mitigate risk is the only way to guarantee a steady stream of profits in the crypto game where the house is rigged to win.
I don’t know how many times I say and I know it sounds pompous but God I am a beast... And I’m not gonna say I’m lucky because I worked my ass off and sacrificed every relationship my life every friendship in my marriage to be a great developer a great day and a better trader than anyone right now that I have met personally anyway.
If you think that’s an arrogant & bold statement; it may be, but ask yourself who else In your life do you know sleeps for 3-4 hours every night in a seven-year straight academic binge with an eidetic memory?
You know the saying about nature first nurture well my brothers trauma surgeon first in his class at Princeton and I’m an MIT dropout.
It’s about 50-50 (nature vs nurture) and In that respect I will say I’m blessed to have the genetics to be able to work half as hard as most ppl and do twice as good Or learn twice as much rather.
This might be the most uncomfortable publication I’ve ever made given the fact that this bad taste in my mouth won’t go away as I have never made such a typical stereotype of a millennial arrogance on crack to the point where it’s just so cliché and boring but you know what? DGAF.
What do you say when you’re as nasty as I am? I went on my Twitter rampage today and I want you guys to check it out by rampage I mean I was flexing hard partially because I woke up in a really bad mood and not put me in a bad mood is seeing the same thing that I saw back in 2014 same thing that I saw back in 2017 in the same thing I’m seeing now which is when blue whales become orcas and predators on minnows with shills and pushing affiliates, brands and just overall greedy opportunism. I snapped.
At the end of the day I’m not gonna pay for promotion and the people are always going to have a father to me because I’m not in the visual but guess what you’ll be lucky to be following me because I’ll make you a shit load of money as I have over the years with much other people and I believe the term is “diamond in the rough” And this right here is a gift so you’re welcome.
When I get a publication wrong then you can give me hell but now analytics reveal a staggering 128/130 accuracy of publications posted including 15% stocks/wallst/commodites. Needles to say: right now I'm not getting NEARLY the recognition and engagements I deserve. Don’t get it twisted I don’t want your followers I want you guys to read so you guys can learn so you guys can make money and grow; something called selflessness. That might be a foreign concept in your world, but not mine.
So with that being said you’re welcome good night and word of advise...there’s no point in chasing publications new traders out there
Do me one favor and don’t pay any fucking loser that’s pretending to be a trader for their services.
Told you this was the greatest altseason of 2020 thus far and a Rising tide lifts all boats so what the hell is the point of making publications and then posting about being right when everyone is right? It’s no different than people claiming individuals on Twitter when all they want is a like/follow/retweet— no. That’s not what I did last night was for that. That was make an anonymous GENEROUS donation for a substantial amount to IRC/ST. JUDE'S/UNICEF.
So keep your clout & don’t follow me, don’t like me; but you will respect me. Because I am better than you and anyone you know and I will challenge you to find somebody better.
Rant over.
C'est La vie.
@a1mtarabichi
OUR DOOM TO BLOOM
"Shine, perishing republic"
robinson jeffers
Cumaean Sibyl, charming Ogress,
What are the simple facts of Progress
That I may trade on with reliance
In consultation with my clients?
The Sibyl said, "Go back to Rome 5
And tell your clientele at home
That if it's not a mere illusion
All there is to it is diffusion—
Of coats, oats, votes, to all mankind.
In the Surviving Book we find 10
That liberal, or conservative,
The state's one function is to give.
The bud must bloom till blowsy blown
Its petals loosen and are strown;
And that's a fate it can't evade 15
Unless 'twould rather wilt than fade."
- Robert Frost.
Published on mobile -- edited on web client sorry if chart came out distorted; check comment for re-posted intended/accurate chart
Green lines represent TP 1-2
Timeframe: Mid-Long
Volatility: high asf
Risk/Reward: 45/55
Disclaimer
Note: This is strictly conjecture based on my own technical analysis and not any information based on any sources from the GOP Or federal government/treasury dept / ay institution of any form this example is for educational purposes only and should not be relied upon for any other use. Please invest responsibly and make all decisions based on your head; not your gut. Any projections or figures provided in this analysis are Forward-looking statements And have no basis Other than my own opinion and not information related to the GOP , SEC or wall sf in general. Just the wiz doing what he always did best — Disclaimer must be extended and extensive So forgive me as I need to truly emphasize None of the information obtained in conducting this analysis was provided by insider trading in anyway shape or form.
Certain information set forth in this presentation contains “forward-looking information”, including “future oriented financial information” and “financial outlook”, under applicable securities laws (collectively referred to herein as forward-looking statements). Except for statements of historical fact, information contained herein constitutes forward-looking statements and includes, but is not limited to, the (i) projected financial performance of the Company; (ii) completion of, and the use of proceeds from, the sale of the shares being offered hereunder; ( iii ) the expected development of the Company’s business, projects and joint ventures; (iv) execution of the Company’s vision and growth strategy, including with respect to future M&A activity and global growth; (v) sources and availability of third-party financing for the Company’s projects; ( vi ) completion of the Company’s projects that are currently underway, in development or otherwise under consideration; ( vi ) renewal of the Company’s current customer, supplier and other material agreements; and ( vii ) future liquidity, working capital, and capital requirements. Forward-looking statements are provided to allow potential investors the opportunity to understand management’s beliefs and opinions in respect of the future so that they may use such beliefs and opinions as one factor in evaluating an investment.
These statements are not guarantees of future performance and undue reliance should not be placed on them. Such forward-looking statements necessarily involve known and unknown risks and uncertainties, which may cause actual performance and financial results in future periods to differ materially from any projections of future performance or result expressed or implied by such forward-looking statements.

XTZ/USD - distribution and further downward movement.
As long as we are under the key level.
Everything looks more like shorts.
2.40 acts as local support, break-down and fixation will be a signal for sales.
The exit above 2.60 will be a signal to buy.
At 4h we are under the key level.
The EMAs are directed down.
Next level is 1.82$.
Push ❤️ if you think this is a useful idea!
Before to trade my ideas make your own analysis.
Thanks for your support!

XTZ /USDT - Opinion- narrowing the price inside the triangle, blue dotted line is an alternative resistance;
- key level 2.89$
- the indicators point upwards.
Who's not in position:
Enter after the breakout/resistance retest (dashed or solid).
Stop-loss at $2.58. Profits are marked by green zones on the chart.
If you have your own opinion or thoughts about current market situation, feel free to write it in comment below !

#Tezos / BTC Tezos made a fantastic spike
We still expect that the rise has not ended and will continue to rise to respectable prices, as shown in the drawing
A good buy is on the trend line
If the trend line is broken, this idea will be canceled
Please support this idea by pressing the like button
Take Care

XTZ 1D - Rising WedgeBest target is 0.23 FIB retracement if breakdown occurs.
I've put in Pink SPX price which is going very similar those days.


#Tezos BTC .. New RoundPlease support this idea by pressing the like button
XTZ coin is a very powerful coin
I have made big profits in the long run and I expect more gains from this level
The currency may take a long time to start again, as shown in the drawing


XTZUSD formed bullish Shark | Upto 125% bullish move expectedAn eye on previous bullish harmonic move:
Hi Folks hope you are doing well, this bearish trend is helping many tokens and cryptocurrencies to complete their final bearish legs to form bullish patterns and Tezos (XTZ) is also one of them. This time the XTZ has also completed another harmonic move but before moving to current pattern lets watch the previous move so it will be easy to understand the current harmonic move.
Below was the long term 2 week chart I published on 1st November 2019 and on this chart I found that the XTZ had formed a perfect Gartley pattern. The formation of this pattern was started on the candlestick which as opened on 21st January 2019. The initial leg was completed on the candlestick that was opened and closed on 13th May 2019. After that we have witnessed that the price action has retraced between 0.618 to 0.786 Fibonacci level and completed the A to B leg. After this retracement the price line of Tezos projected between 0.382 to 0.886 Fibonacci projection and this was the Fibonacci projection area of A to B leg. When I published the chart at that time priceline was moving in the potential reversal zone and we had 4th candlestick in this area.
Now from that potential reversal zone the XTZ was suppose to move up and enter in the Fibonacci projection area of A to D leg between 0.382 to 0. 786 Fib level. So there was almost 150% bullish move was expected but we have witnessed that Tezos turned very strong bullish and first the price action entered in the Fibonacci projection area and from December 2019 to January 2020 the price action started a correction rally between the projection area of A to D leg and then broke out the 0.786 Fibonacci level as well and produced more than 348% massive profit.
Failed in breaking out the long term resistance:
After producing such a massive bullish rally the price action found a long term strong resistance at $3.52 and finally the priceline of failed to break out this resistance level and dropped down back in the Fibonacci projection of A to D leg of previous bullish Gartley pattern. At this level the price action is also hitting at the previous support of $1.26 and also using the 0.382 Fibonacci projection as a support.
The Tesoz is hitting at the support that is never broken down:
Now if we move to 2 day chart then it can be observed that the price action of XTZ is now at 200 simple moving average support and at the same time it is also hitting at the 100 SMA. As per Kraken exchange this 200 moving average was first time appeared on 17 November 2019 and since then the price action of Tezos never has hit on the support this time the price line of XTZ is touching at 200 simple moving average support for the first time in its history as per Kraken exchange chart.
A recent harmonic move can produce another bullish rally:
Now if we closely examine on this 2 day chart then it can be clearly seen that Tezos has formed another harmonic pattern. And this time the pattern is bullish Shark. The initial leg of this pattern was started on the candlestick that was opened and closed on 3 January 2020 and this initial leg was completed at the candlestick of 12th Feb 2020. After that the price action retraced between 0.382 to 0.618 Fibonacci level. (there is slight difference to reach up to the level of 0.382 but I have ignored this slight difference because all other legs of this pattern are formed perfectly as required for a perfect bullish Shark. After the completion of A to B leg the price line of XTZ was supposed to be retraced between 1.13 to 1.618 Fibonacci projection of A to B leg and on the chart we can see that the price action has projected up to 1.363 Fibonacci projection. finally the recent strong sell off has helped the XTZ to complete the last leg of this pattern and the final leg is retraced down between 0.886 to 1.13 Fibonacci level as required for the C to D leg of bullish Shark pattern. We can see we have fourth candlestick moving in this potential reversal zone. Now as per Fibonacci sequence method priceline is supposed to take a bullish divergence from this PRZ level to enter in the Fibonacci projection area of C to D leg from 0.382 to 0.786 Fibonacci projection.
As per Fibonacci sequence the potential reversal zone and Fibonacci projection of C to D legs are as below:
Potential reversal zone: $1.4984 to $0.9170
Fibonacci projection of C to D legs: $ 2.0710 to $ 3.2854
So this time Tezos has capacity to produce upto 125%. However if the priceline will manage to cross up the 0.786 Fibonacci projection then it can breakout the $3.52 resistance as well.
Stop loss:
The maximum extent of potential reversal zone at $$0.9170 can be used as stop loss because if this level will be broken down then XTZ can start another bearish rally towards downside.
Regards,
Atif Akbar (moon333)


XTZ/USD LONG TO NEW ALL TIME HIGHS OF $5.50, $7,50, $10.00ENTRY 1 $3.00 & Entry 2 $2.50 SL $1.70
TP.1 $5.50 & TP.2 $7.50 & TP.3 $10.00
Apart from Bitcoin, there is another cryptocurrency that will continue to make a new ATH, Tezos (XTZ). As we reported, XTZ has already made a new high and worked its way into the top 10 cryptocurrencies.
Currently, XTZ is trading at $3.23, with 147% gains on a year-to-date basis, all thanks to the baking frenzy that has nearly 80% of Tezos supply locked up for staking. According to AngeloBTC, the digital asset would also be seeing over 200% of gains to climb to $10.
For the second-largest cryptocurrency, Ethereum, however, AngeloBTC has the least expectation as he predicts a minimum jump of 87%. Currently trading at $263, up 105% in 2020 so far, the trader sees it going to at least $500 moving into 2021.
But for the third-largest cryptocurrency, XRP, the investors are in for the highest gain of 248%. At the time of writing, XRP/USD has been trading at $0.282 and as per the trader, by 2020 we could see $1 finally, which was last spotted in February 2018 during the trip down from the January ATH of $3.92.

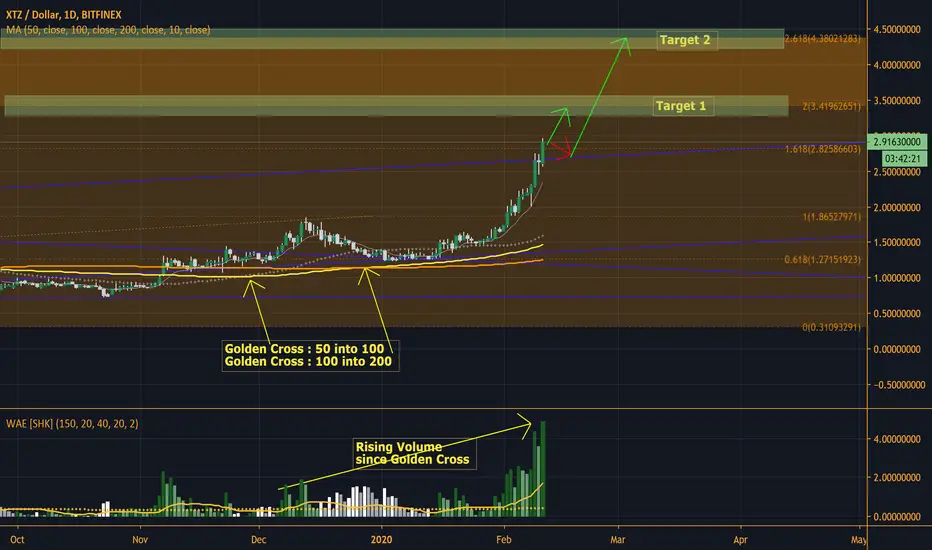
XTZ : Golden Cross to 4.3$ - Bulls' rampageI am a budding FOREX/ CRYPTO trader, with much of my experience coming from trading CRYPTO markets since 2016. In my Full Trade Setups I provide the Market sentiment, Entry Strategies, Stop Loss and Target Points for the Category of trade I will be posting. Discussion section is included to point out to the Fundamental Outlook.
--- FULL TRADE INFO ----
Category : Mid Term --- Spot Trade --- ALTCOIN-USD Pair.
Entry : Enter now or retest of channel
Target Zone 1 : $3.4
Target Zone 2 : $4.3
Preferred Stop loss : Manual
Stop Loss limit : 2 whole body close into the channel with equal or rising volume.
Market Sentiment : Tezos like LINK has sustained an amazing 2020 so far. Annihilation of bears is in full swing. Double Golden Cross blowing off top of the top of the channel.
--- END ---
Discussion : Given the BTC printed a bullish weekly HH disregarding most of the bearish case in coming months, this potential XTZ which such high CT sentiment has high chance to play out.
Please hit the LIKE button friends for more such trades.
Do your own research. I only post trades I myself take. :) Enjoy. Will keep you gyz updated.
Tezos medium term bull scenario (USD)Expect more short term selling pressure as significant buyers remain on the sidelines until price capitulates one final time. The current chart is not appealing at the moment for traders with size - easily shown by the declining trading volume since 2019's high. Watch volume closely. Also, watch the Tezos price trend cycle throughout the day. When daily trading highs are made morning or mid day, and followed by a sell off to close the day -- typically means that more downside is coming. On the contrary, when the day starts out red but closes higher than it began, traders are starting to accumulate and hold positions.
Now to my projection. I am a believer in ascending triangles. I see one in the making with Tezos and believe it will ride the ascending triangle for the medium-term. My price projections are based off of similar moves from Tezos and other cryptoassets as they formed and broke out of their patterns. Typically it takes 3 attempts to break ascending triangle resistance. Once resistance is broken it will immediately flip to support. If support holds I firmly believe that we will not see $2.00 XTZ ever again.
Love to hear your thoughts. Good luck!

Tezos to $2.00 could happen quickA few weeks ago I posted an ascending triangle chart of XTZ/USD when btc was around $7,700. I was of the opinion that bitcoin could head lower, dragging down tezos pair with usd. Things have changed and I am now bullish bitcoin, expect it to re-test ath's in 2020, and believe Tezos will be a huge beneficiary of any upcoming bitcoin gains.
February 9 - 15 looks like a prime time for $2.00 xtz

XTZBTC Symmetry FractalXTZ has been on three major bull runs, each lower than the previous. This leads me to believe that price will decline in a manner that has been seen in the previous two bull runs. Fractal in red.

