XTZUSDT

XTZUSDTXtz breakout the falling wedge.
Now there's different scenarios excited.
If break the resistance at the next level , we may expect a new high level.
This is just an idea.
Not financial advice

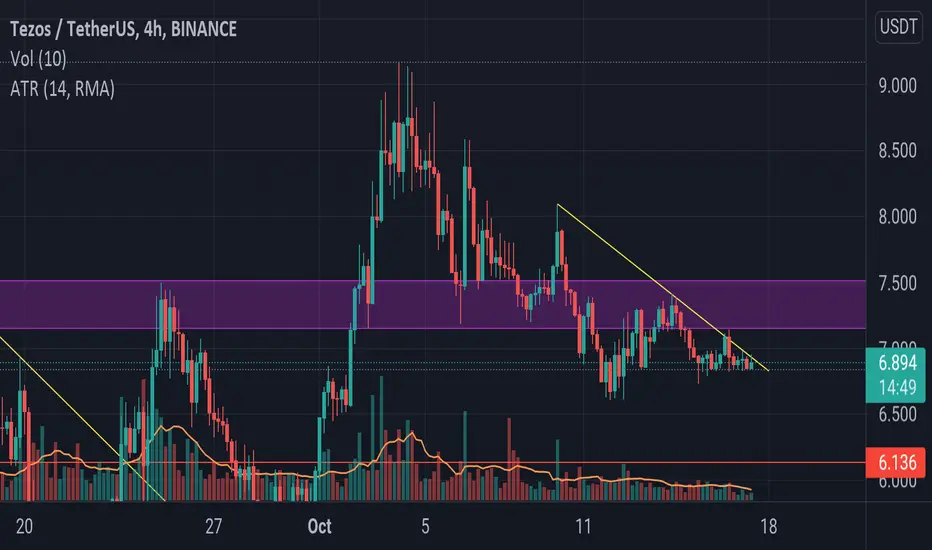
Tezos (XTZ) for Christmas dinner.Tezos has already had its retracement on the daily chart and is already rebounding in the value area as shown by the volume profile and the 55-period EMA, now with patience we will see a bullish run to at least $9 again.

$XTZUSD - Wait for breakout confirmationHello everyone!
Tezos tested an important dynamic support level, and looks to retest 8.30 levels once more.
Currently the uptrend is blocked by a local dynamic resistance, waiting for a breakout at levels near 6.7.

Xtz - Bullsih ChannelXTZ is now at the bottom of the bullish channel, it's a good time to get in.
-----------------------------------------
XTZUSDT
-----------------------------------------
▶️ Buy: $6.5
⚠️ Stop loss: 1D candle under $6
⭐ Target 1: $7.5
⭐ Target 2: $8.3
⭐ Target 3: $9.2
⭐ Target 3: $10.4
-----------------------------------------
Good luck 💗

XTZ Symmetrical Triangle formationSymmetrical triangle formation on XTZ 4Hour Frame. Possible accumulation for a big move.

XTZ/USD ChartXTZ is a interesting coin to invest right now. After two invalidation at the 6.36$ area, we can see a bullish pattern in the daily chart. The coin can easily breakout the 7$ resistance and go full moon. The OBV is also showing a nice comeback, which is also bullish. Whats your thoughts on XTZ? Comment, like and follow.

XTZUSDT LongXTZ is on a good bullish trend in daily Chart channel looks valid with several touches and also PerBTC is on support, on the other hand in 4H we have just broked and confirmed a falling wedge on fundamental side XTZ is undervalued asf and do your own research
Targeting: 10-11-12

STRONGER DEFI COIN ( XTZ / usdtAs we see : there is astrong pattern ( Head and shoulders ) on daily chart..
you can buy in parts at any correction ... or you can wait breaking neck line
Targets :
12 $
17 $
23 $
27 $

XTZ Buy a break setup.XTZUSD - Intraday - We look to Buy a break of 7.502 (stop at 7.277)
Pivot resistance is at 7.500.
Price action has continued to range within a triangle formation.
Daily signals are mildly bullish.
Our profit targets will be 8.141 and 8.341
Resistance: 7.500 / 8.000 / 8.500
Support: 7.200 / 7.000 / 6.600

XTZUSDT - Finally break out?/Trading strategyBYBIT:XTZUSDT
1H trend chart
-
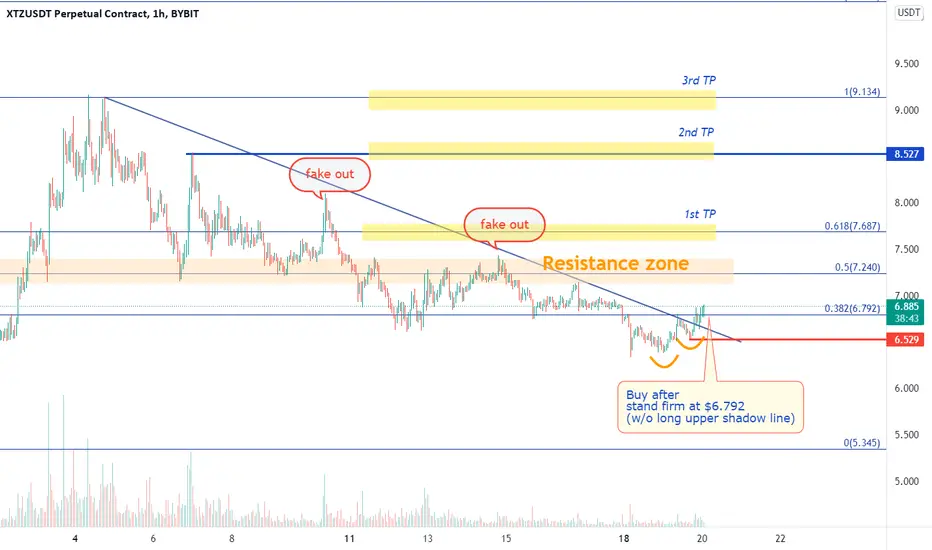
XTZ has been falling due to the upper trend line.
Recently, it eventually broke it out, and can see there is a double bottom.
However, should notice there were lots of fake-out on the way down.(trend line needed to be modified)
So if price can keep standing firm at $6.792(Fib 0.382) in 1H, trading strategy as below.
-
Profit Targets:
a) 7.687----Fib(0.618)
or
7.240(Resistance zone)
b) 8.527----Blue horizontal ray
c) 9.134-----Fib(1)
Stop losses:
a) 6.529-----Red horizontal ray
-
If you like this analysis, smash the "like button" and leave a comment below to share your thoughts
or let me know what crypto you want to see!
Trading is a reflection of yourself. Learn more daily and be ready for every opportunity.
Have a nice trading!
XTZ is going to break up the trendline and explode 🤯🚀Xtz has been going down for a while and has found its support on 6.81. I think accumulation is done and soon it will break up the trendline 🚀
XTZ Ready For a Leg Up!!Tezo's and most of the market has been feeling the BTC rise and the dominance rise in turn pushing altcoins to the downside, XTZ has actually held up very strong compared to some other coins. We are still comfortably in our ascending channel with us just recently pushing into the lower half. Looking at the bollinger bands we are actually sitting right on that midline which is currently support and holding us up, im looking for a daily close above this level tonight and hopefully a bit of a pivot off of here, aswell the bands seem to coming in and could be starting to squeeze down on price action, if this happens we will likely see some sideways movement with momentum building up stronger and stronger each day until we have an explosive move in either direction. Keep in mind BTC is always a huge factor for altcoins so we must watch this aswell. Taking a look at the EMA ribbons we are still moving in the right direction with the green ribbons on top and with some decent separation, if altcoins start to take off to the upside we can likely get a hint from the EMA ribbons by them starting to open up wider and spread out further showing growing bullish momentum! As far as significant support and resistance go we are dead center inbetween the 0.3 FIB (Resistance) and the 0.5 FIB (Support) i think it is likely that before we move another leg up we will probably go to test that 0.5 FIB level and my thoughts are that we will hold it, unless of course BTC crashes the party. Now the RSI, as i always talk about the midline is a very key level, not only does is act as support (Currently) it signals the overall trend we are in, if we remain above this midline we are still considered in a confirmed uptrend, but if we fall below and fail to get back up and above we will be considered in a confirmed downtrend whether its a short term one or longer term one, i would say shorter term is the most likely option as i believe this bullrun is not over for alts. But we are seeing a curl to the upside slightly above this midline and its looking like we could actually hold here going into daily close, and like i said before if we can hold onto the midlline on the BB aswell, we are looking very good! Not financial advice just my opinion!

XTZHammer on a key level indication bull entry......
After TP, if it plays out well and break the purple trendline, buy again at the retest of it with entry confirmation candle.
$XTZ
Trade safe......

Tezos U.S. Dollars (T)Tezos is 1) approaching/already landed on a firm support 2) approaching the 50MA which it has previously skipped off of on three prior occasions 3) gearing up to retest it's September - October pennant.
Wicks are also suggesting a good response to to this support level
Look below for analysis of its BTC pairing
This is all contingent on BTC continuing its uptrend or if Tezos begins to counter trade BTC
RSI is also approaching 50 (Could bounce off)
Nothing is FERCLY confirmed so this is mostly a gamble also considering the previously mentioned contingency

XTZUSDT a Descending wedge and time to open!/Trading StrategyBYBIT:XTZUSDT
1H trend chart
In this trading strategy, I'll provide 2 types of open timing for aggressive and conservative traders, respectively.
-
We modify the patter as a descending wedge from a triangle (refer to last analysis)
Price suddenly plunged while ETH falling, but it formed a good wedge.
In the meantime, price hit Vegas tunnel_576ema, and rallied back to 12ema rapidly.
Also, Fib(0.382) showed a strong support for price.
-
So here is our first timing to open position, and trading strategy as below.
-
*Notice the resistance from upper trend line
=>Based on this resistance, conservative trader could wait for the break-out of upper trend line.
-
Profit Targets:
a) 9.166----Fib(1)
b) 10.187~10.599----Fib(1.272~1.382)
c) 12.918-----Fib(2)
Stop losses:
a) 6.847----Red horizontal ray
-
If you like this analysis, give it a like and leave a comment below to share your perspective
or let me know what crypto you want to see!
Trading is a reflection of yourself. Learn more daily and be ready for every opportunity.
Have a nice trading!

XTZUSDT Keeps convergence and time for entry!/Trading StrategyBYBIT:XTZUSDT
1H trend chart
-
A strong support zone was formed from long-term neckline, and it really seems effective for price while falling.
Moreover, a downtrend line keeps price converging and gradually forms a triangle.
Now, direction is still unknown, but if the upper downtrend line can be broken out, trading strategy as below.
-
Profit Targets:
a) 9.166----Fib(1)
b) 10.048~10.405----Fib(1.272~1.382)
c) 12.409-----Fib(2)
Stop losses:
a) 7.152----Red horizontal ray
-
If you like this analysis, give it a like and leave a comment below to share your perspective
or let me know what crypto you want to see!
Trading is a reflection of yourself. Learn more daily and be ready for every opportunity.
Have a nice trading!

Tezos is preparing the next pump.This is a good moment to make the first entry for tezos.
I think the price could be better, maybe 6.5 usdt, but for the people who sold over 9 usd, buy again in 7 it's ok.

xtzusdtxtzusdt
One of the most basic currencies in the market
It has a good divergence with the bit
Corrected and the target is logically corrected, but if it goes down to the second red line, it is not a concern
Its targets are also characterized by green color

xtz usd 30 min scae it can break it and after the price will be stable bellow the dynamic trend line it should crack dawn very sharply

XTZUSDT TEZOS READY TO PUMPWe saw Tezos reclaim support and now ready for a breakout with 30% return.

XTZ/USDT Elliott WavePossible scenario for xtz 'till the end of the month. Lil Elliott Wave, again I'm not professional trader, charter or whatever.
Good luck n Trade safe!

XTZ - $21.64XTZ is currently trading below the trendline support zone. Once this trendline support is reclaimed, we could start seeing a move towards $8.09 and $8.76. If the resistance at $8.76 breaks, we could start seeing a move towards $10.68, $14.87, $19.05 and $21.64. Failure to claim the trendline support could lead to a drop towards $6.50 and $5.96.
