Retraces are temporary, Tezos is forever. Well, at least until a solar flair...
I called a successful short term top at 3.2 perfectly in my last post and bought back at 2.7. We are not in moonshot territory yet and we are very much dictated by btc and eth. Swings will come and they will be violent but you should use them to your advantage to grow your stack. See my past posts for my strategy.
Tezos is being suppressed. By it's TA, by it's lack of a wacky over the top CEO and a hype team. That is okay. Tezos is the real thing and we are not even in the top 20 yet. When we go into blue sky mode it will be legendary.
Be safe out there, 2021 will be an insane year for us. Anything is possible.
XTZUSDT

XTZUSDTTezos in daily time frame shows a complete trend of bullish so for long term investments are great to put your money in and get high profits
bias = bullish

All eyes on ETHWe are currently in the danger zone of playing with 3.2 while eth tests its all time high. As of right now, ETHUSD is tapping the 1420-1450 level where it is meeting strong resistance.
ETHUSD is currently bearish diverging on the daily which could signal a reversal, dragging the rest of the altcoins with it. However if able to break out of the 1450 range and close, we could see a 2k eth in a week, as well as a 4 dollar Tezos.
I am currently keeping as close eye on the market as I will be acting on what ETHUSD will be doing.
XTZUSD is currently out of the boll bands and RSI is teasing 70, my golden sell conditions. I am deleveraging but who knows what will happen, we are in the wild west.
If we see a pull back I predict support at 2.7 but we may temporarily dump lower. I will be watching. After which we will come back to 3.2 and break it in an amazing fashion :).
Thanks for reading and be safe out there.

XTZUSD D1: BEST level to BUY/HOLD 60% gains.(NEW)Why get subbed to to me on Tradingview?
-TOP author on TradingView
-15+ years experience in markets
-Professional chart break downs
-Supply/Demand Zones
-TD9 counts / combo review
-Key S/R levels
-No junk on my charts
-Frequent updates
-Covering FX/crypto/US stocks
-24/7 uptime so constant updates
XTZUSD D1: BEST level to BUY/HOLD 60% gains.(NEW)
IMPORTANT NOTE: speculative setup. do your own
due dill. use STOP LOSS. don't overleverage.
🔸 Summary and potential trade setup
::: XTZUSD daily chart review
::: accumulation in progress now
::: a/b/c/d/e/f/g repeat fractal
::: wait for the pullback now
::: before buying it
::: Speculative bullish setup
::: reload bulls is near 2.40
::: strong mirror S/R level
::: get ready to BUY low / hold it
::: 60% gains possible from my level
::: strategy: BUY LOW after pullback
::: TP bulls is +60% gains BUY/HOLD setup
::: buy near my level and get rewarded
::: TP bulls is +60%
::: good luck traders
🔸 Supply/Demand Zones
::: dem/supp N/A
🔸 Other noteworthy technicals/fundies
::: TD9 /Combo update: N/A
::: Sentiment short-term: RANGE/MIXED
::: Sentiment outlook mid-term: BULLISH

Tezos (XTZ) - January 18Hello?
Dear traders, nice to meet you.
"Like" is a huge force for me.
By "following" you can always get new information quickly.
Thank you for always supporting me.
-------------------------------------------------- -----
We have to see if we can ascend above 3.3269 points.
If it falls, you need to see if you can get support at the uptrend line (1) and at 2.8221.
If it falls at the 2.4821 point, a Stop Loss is required to preserve profit and loss.
New investments can be bought when they rise between the uptrend line (2)-2.2080.
Also, below the 1.6066 point, I think it is a good section to enter as a mid- to long-term investment.
-------------------------------------------------- -------------------------------------------
** All indicators are lagging indicators.
So, it's important to be aware that the indicator moves accordingly with the movement of price and volume.
Just for convenience, we are talking upside down for interpretation of the indicators.
** The wRSI_SR indicator is an indicator created by adding settings and options from the existing Stochastic RSI indicator.
Hence, the interpretation is the same as the conventional Stochastic RSI indicator. (K, D line -> R, S line)
** The OBV indicator was re-created by applying a formula from the DepthHouse Trading indicator, an indicator that oh92 disclosed. (Thank you for this.)
** Check support, resistance, and abbreviation points.
** Support or resistance is based on the closing price of the 1D chart.
** All explanations are for reference only and do not guarantee profit or loss on investment.
Explanation of abbreviations displayed on the chart
R: A point or section of resistance that requires a response to preserve profits
S-L: Stop Loss point or section
S: A point or segment that can be bought for profit generation as a support point or segment
(Short-term Stop Loss can be said to be a point where profits or losses can be preserved or additionally entered through installment transactions. It is a short-term investment perspective.)
GAP refers to the difference in prices that occurred when the stock market, CME, and BAKKT exchanges were closed because they do not trade 24 hours a day.
G1: Closed price
G2: Market price at the time of opening
(Example) Gap (G1-G2)

XTZ/USDT has good growth potentialHi every one
TEZOS / TETHERUS
XTZ chart seems promising because of the broadening wedge that you can see in the picture we might be lucky to see the pump in the price soon!
Traders, if you liked this idea or have your opinion on it, write in the comments, We will be glad.
Things can change...
The markets are always changing and even with all these signals, the market changes tend to be strong and fast
Thank you for seeing idea .
Have a nice day and Good luck.


#XTZ Breakout, Good Buying opportunity XTZ breakout the ascending triangle and holding it well. There is a lot of accumulation going on XTZ and we see a quick rally soon. Don't miss XTZ.
Buy Zone: Current market price
Target: $2.8-$3.0-$3.25-$3.55-$3.9
Add more in dips


Xtz/usdtEverything is clear in the picture .. I think this pattern will be formed soon ✌😉 .. Please like and comment. Note that all analyzes are my personal opinion and you are the final decision maker ones, good luck❤

Tezos (XTZ) - January 13Happy New Year!!!
Dear traders, nice to meet you.
"Like" is a huge force for me.
By "following" you can always get new information quickly.
Thank you for always supporting me.
-------------------------------------------------- -----
We have to see if we can get support and climb at the critical point of 2.2080.
It remains to be seen if it can rise above the downtrend line (3).
If it falls from the 1.9735 point, it is a short stop loss.
If it falls from the 1.6066 point, a Stop Loss is needed to preserve profit and loss.
However, you need to trade carefully as you can gain support and climb in the 1.3336-1.6066 range.
If you get support in the 1.3336-1.6066 section, I think it's a good place to buy.
-------------------------------------------------- -------------------------------------------
** All indicators are lagging indicators.
So, it's important to know that the indicator moves accordingly with the movement of price and volume.
Just for convenience, we are talking upside down for interpretation of the indicators.
** The wRSI_SR indicator is an indicator created by adding settings and options from the existing Stochastic RSI indicator.
Hence, the interpretation is the same as the conventional Stochastic RSI indicator. (K, D line -> R, S line)
** Check support, resistance, and abbreviation points.
** Support or resistance is based on the closing price of the 1D chart.
** All explanations are for reference only and do not guarantee profit or loss on investment.
Explanation of abbreviations displayed on the chart
R: A point or section of resistance that requires a response to preserve profits
S-L: Stop Loss point or section
S: A point or segment that can be bought for profit generation as a support point or segment
(Short-term Stop Loss can be said to be a point where profits and losses can be preserved or additionally entered through installment transactions. It is a short-term investment perspective.)
GAP refers to the difference in prices that occurred when the stock market, CME, and BAKKT exchanges were closed because they do not trade 24 hours a day.
G1: Closed price
G2: Market price at the time of opening
(Example) Gap (G1-G2)

Top 4 ALTCOINS that retested on the last BTC dumpWe can say that todays dump made some of us sweat a bit.
Last week we had a lot of altcoins breakout. They were for most on the 4h and daily time frame.
Wich means it takes a bit of time to develop.
Today the king made them retest in a big way. And they held the trend!
Here is my top 4 of altcoins that broke out and retested AND are ready to fly.
IF it holds, IF the king doesnt continue down, IF god is with us!
Trade safe, tight SL.

After some real bullish movement, correction mode in the wayAn AB=CD pattern maybe can explain a correction mode in the near future.

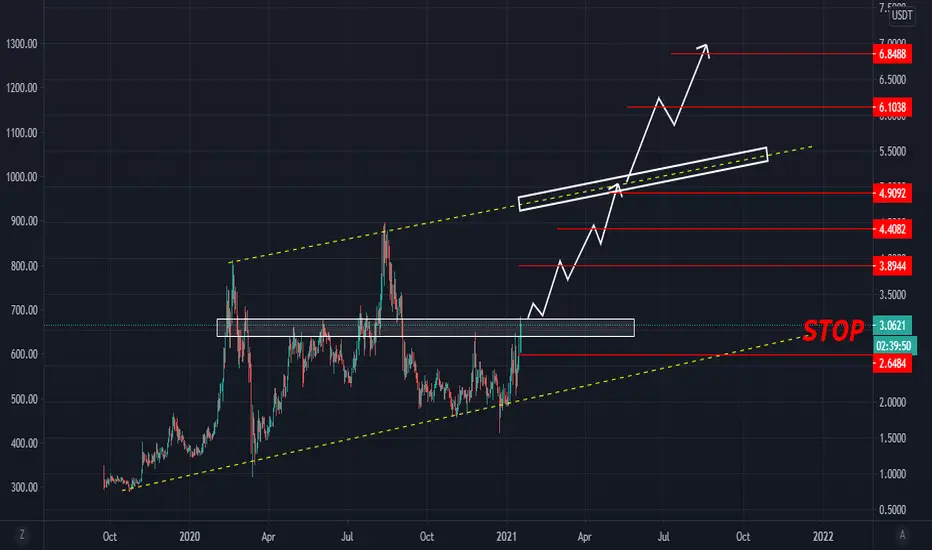
Tron and EOS above us?? Are you kidding me?? TOP 10 here we comeUnfortunately it is impossible to predict everything. The XRP crash ripped us from our course and set us back a few months. HOWEVER, we are on track to get back in the top 10 this year. We need to wiggle our way out of of this giant ascending channel and then get that blue sky breakout which I predict will be like Ethereum's 2017. Not financial advice but I will be trying to grow my stack before we leave predictable zones which means selling when my signals are hit and buying back at resistance turned support.
If you followed my last post I took advantage of the last spike and crash around thanksgiving and grew my stack considerably. I have two rules.
1. When inside the bol bands: if the RSI hits 70 be on the lookout and start selling at price targets aka small resistances gradually. (This is what I did during thanksgiving).
2. When the candles leave the bol bands: the RSI can go over 70 but this will indicate a parabolic run. In this situation I will sell when it returns into the bands.
A simple but effective strat that won't always work but history has proved itself effective thus far.
Dankeschön für Ihre Aufmerksamkeit and may your Tezies be safe.

XTZ/USD - Waking and aiming for $4-5XTZ has been sleeping for three months (Oct-Dec 2020) in a range around $2, however now it seems we have a good chance to push higher towards $4-5.
Targets are on the chart. Question is will XTZ be able to push above $6 with a new ATH?
MACD on weekly also did a bullish cross, hence, we're due for some nice gains for this coin. We also established a nice support line as presented in the chart.
Like and follow!


XTZ Break its Falling Wedge : LongXTZ finally broke the correction falling wedge that it had formed in 190 days, and I think it has a long position and a proper buy setup for long term .
Yellow rectangle is a support level and It had potential to pullback.

Last Tezos resistanceOnce tezos closes above the grey box look for buying to accelerate rapidly. Good chance it retests and breaks USD ATH's soon after resistance is taken out.

XTZ/USDT : Pulled back from Critical support zoneBINANCE:XTZUSDT
Hello everyone 😃
XTZ had a pullback from Current and Also EMAs had a Bullish crossover, On First view It's very good !
But Volatility Indicator had Bearish crossover and we expect a retest on EMAs or 1.955$ support line.
Below 1.955$ support line, Will cause another fall till support line at 0.178$.
🔴 XTZ seems Bullish but watch for incoming correction on whole market, Whole market have a divergence now.
📍 AS XTZ is above 1.955$ support line, It's Safe to take long on it, Don't forget to set STOPLOSS !!

XTZ just hit my TP1 ..the full trade insideXTZ / USDT (SIGNAL in channel)
Target 1 done giving us quick 6% Profit in spot alone 🔥
You can check Full trade BELOW👇👇
BUY :
Around 2$ now (50%)
Around 1.8$ (50%)
STOPLOSS :
4H candel closed below 1.77$
SELL TARGETS :
2.17$ ✅
2.39$
2.63$
3.91$
5.00$

XTZUSDT - Potential buy entry 🔼XTZUSDT is printing an ascending channel on the Daily timeframe.
Price is testing the ascending channel support.
RSI is printing a bullish divergence signal.
Price is printing a falling wedge pattern.
Buy entry ⬆️ - breakout above the falling wedge resistance.
Target 🎯 - resistance levels.
Setup invalidation ❌ - breakdown below the ascending channel support.
