+100% Profit with XTZ by the end of October 2020? (Updates)Updates on my old idea (LEVEL 0.786 almost always works with XTZ).
The chart is looking good. I am even more confident right now.
* You owe me a coffee if this prediction works.
XTZUSDT

Xtz Making Head & Shoulder#XTZ 2 Hours Chart.
Do Your Own Anylysis....
After U Can Take Any Decision.
It's My Personal Opinion..
This Pattern Will Be Valid,
If Xtz Beakout The Lower Yellow Neck Line.
After Breck Below The Neckline With Confirmation Then We Can Go For Short.
Are You Get My Point ? Ok. Then Watch The Neck Line.

XTZ going beyond LINK BINANCE:XTZUSDT
Hello everyone.
As we can see :
- ascending channel
- broke above bottom flat triangle
- major support at 1.965$
- ascending line on RSI
- resistance at 2.265$
- making top flat triangle below 2.265$ resistance
Here we have 3 options :
pullback into ascending channel : if XTZ, go through channel then we have to break 2.265$ resistance till the price touch the top of channel.
making top flat triangle : then we will trend into a bullish zone actually there would be a high chance to break resistance and take hold above it !
reject from resistance : there is low chance for it but if it happens then we will see a ranged trending under resistance and a retest for major support at 1.965$
Our view is bullish but we will take look at this resistance and channel also.
Attention : this is not a financial advise we just try to help people on their own vision.
HAVE A GOOD DAY
- Helical_Trades

XTZUSDT, Possible bounce off...The price is under the Key Level and can bounce off.
You can use this situation for the trade.
Use predictable risks and set you to take profits above the lower levels.
Dear followers, the best "Thank you" will be your likes and comments!
Before to trade my ideas make your own analysis.
Thanks for your support!

XTZ imoIf flip 2.20 level targeting 3 to 3.20. if not, I'm not taking this trade and will look for buy at next support. #DYOR

Tezos (XTZ) - September 25Hello?
Dear traders, nice to meet you.
"Like" is a huge force for me.
By "following" you can always get new information quickly.
Thank you for always supporting me.
-------------------------------------------------- -----
It has declined from the uptrend line (1), and most of the uptrend that began on March 13 was returned.
It remains to be seen if it can quickly rise above the uptrend line (1).
If it falls from 2.0706, it is likely to touch 1.6549 or less.
(Fibonacci retracement point indication 1D chart)
We'll have to see if we can get support from 2.0797-2.3331 and climb above the 2.84 point.
If you move down from the 2.0797 point, you're likely to touch below the 1.3193 point.
-------------------------------------------------- -----
(HITBTC XTZUSD 1W Chart)
We have to see if we can get support and climb in the critical section, 2.15156711-2.26900450.
If you decline from the 2.15156711 point, you are likely to touch below the 1.73723670 point.
-------------------------------------------------- -------------------------------------------
I think it is a period of volatility from September 21st to October 1st.
Therefore, I think careful trading is necessary.
** Check support, resistance, and abbreviation points.
** Support or resistance is based on the closing price of the 1D chart.
** All explanations are for reference only and do not guarantee profit or loss on investment.
Explanation of abbreviations displayed on the chart
R: A point or section of resistance that requires a response to preserve profits
S-L: Stop-Loss point or section
S: A point or segment that can be bought for generating profit as a support point or segment
(Short-term Stop Loss can be said to be a point where profits and losses can be preserved or additionally entered through installment trading. You must trade from a short-term investment perspective.)

XTZ/USDTI've been in this position for a while, I'm really losing my patience here.
When I lose my patience, I chart. Tezos is actually looking pretty good. The whole market seems shaky, so this only works if the total market cap and BTC cooperate of course.
Testing the trend line and possible S/R flip. I will hold this and have added a very small (very small) amount to my current holdings. Buy the dip in a bull trend right? right?

TEZOS ...A Self-Amending Crypto-Ledger❇️what is tezos?
Like Bitcoin and Ethereum , Tezos is a decentralized ledger that makes use of blockchain technology. Like Ethereum , Tezos is designed to make use of smart contracts. The term “Tezos” is ancient Greek for “smart-contract,” according to the developers. However, Tezos goes beyond previous offerings.
Tezos is a blockchain platform that supports smart contracts and dapps, based on the idea of a digital commonwealth, in which governance is democratized in an efficient and sustainable manner to avoid costly hard-fork scenarios.
In 2017, the Tezos ICO raised $232 million in BTC and ETH, making it one of the largest ICOs in the industry. Based in Switzerland, the Tezos Foundation spearheads efforts to support wider adoption of the protocol.
Within the network, XTZ is the token used for all operations. With the incorporation of features such as Liquid Proof-of-Stake and on-chain governance, throughput is traded for a higher level of decentralization.
Tezos relies on Liquid Proof of Stake (LPoS), with full support of Turing-complete contracts. In the Tezos network, block generation is referred to as baking while validators are known as bakers.
------------------------------------------------------------------------
❇️Technical analysis
The XTZ is on the $ 2 support line and has fallen in the last few days, and I expect it to fall again with increasing sales pressure and fall to the next support and go back to the bull in a few days and week...
-------------------------------------------------------------------------------------
👉This analysis is my personal opinion and you are responsible for your own trades or invests.
❤️with Best Regards and successful trades.

XTZ/BTC (1600 Sat Major Support?)💎Technical Analysis Summary💎
BINANCE: XTZBTC
-Tezos is trading inside a descending channel
-The pattern is Bullish if breakout to the upside
-The major support area is at 1600 range
-That zone is tested support twice and saw an upward move
-If XTZ will continue its downtrend, it will likely test this region
-I recommend buying the breakout of the channel to reduce the risk
-Midterm target is up to 2400 sat previous support area
``````````````````````````````````````````````
Trading Involves High Risk
Not Financial Advice
Please Exercise Risk Management
``````````````````````````````````````````````
If You Like My Daily Published Ideas
A little Help By Supporting My Channel
Through Leaving A Thumbs Up, Comment & Follow
Happy Trading! --> Thank You! :)
``````````````````````````````````````````````

+100% Profit with XTZ?It looks like I was right with my predictions. Right now it's a perfect time to make some good money with Tezos.
You are welcome!

XTZ longXTZ is dumpping from sept 3 due to BTC drop and Dominance Pump Finally It has Reached It's Support level It may pump from here or else it may one more leg down we can expect Long on this After one more leg down to Support line
I"m Sure it Will pull Back to support lines

XTZ/BTC - ATS SWING BACKTESTScript settings for 6H timeframe:
· Signal calculation type - "high"
-TP for Long - 35%
-SL for Long - 4%
-TP for Short - 30%
-SL for Short - 6%


Pick up more at BUY levels, sell off at SELL levelsThough it may seem that XTZ is plummeting and rolling straight to the hell, the asset is going to recover faster than one may think.
Tezos has strong support from its community and VCs (e.g. the Draper foundation) who back the asset.
On the graph, I marked levels of support and resistance. I personally go bullish on the asset, however, you can play it safe and pick up more XTZ on the levels of support.


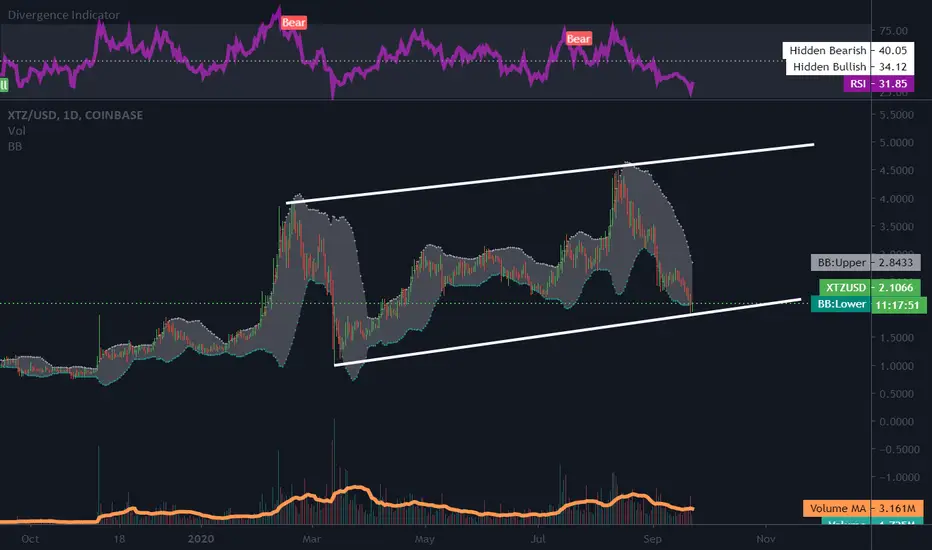
XTZ seems at support levelSeems like XTZ already at support level .
RSI at oversold and now going up.
Near the lower Bollinger Band (BB).
Entry: around $2.10
Target Price: around $5
Support: around $2
Long idea - XTZ/USDHello!
We advise that you pay attention to XTZ, a coin with a strong base and chart.
Globally, it has been in an upward trend for almost two years.
Within the framework of this trend, the zone for buying is located in the area of $ 2
Just wait confirmation from ATS

LEVEL 0.786 ALMOST ALWAYS WORKS WITH XTZ!If you are LONG on XTZ, keep holding until the asset reaches FIB LEVEL 0.786.
It almost always closes with Tezos.
* If you haven't bought anything yet, check out my previous post on XTZUSDT to review the entry points.


XTZUSD, Bullish Accumulation formingBullish Accumulation forming... If it continues down then we going to 2.1-2.2.

tezos everyones least favoriteTezos has proven to be a failure for many traders. Its quickly become one of the most popular revenge traded charts and ultimately rekking everyone who trades it.
I actually think xtz has bottomed, and there is no where but up from here, as it gains momentum it should rocket it to new highs because everyone will buy it to "get their money back".


Tezos on it's last leg?Mixed signals. with higher volume then couple months before. Bearish red wave continuation till mid september. Long if support trades on time above the blue line in. Short if it falls or consolidates longer.
Hard to say a target, since it consolidated for a long amount of time.
Just to point out. The longer it consolidates, the more bears losing momentum
