XTZUSDT

XTZ TEEEEEEZOOOOOOOOOOOOOOOOOSSSSBREAAAAKKK ITTTTTT
REEEEEEEEEEEE
or retest support.
Have fun guys!
Please like and follow!

$3.10 must be brokenTezos finds itself at a most critical juncture. $3.10 is possibly a more challenging resistance level for Tezos than $2.00 was earlier this year. The fact that xtz has not pumped above $3.10 yet during the recovery gives me hope that many of the would-be sellers on the ride up are exiting here. Thus, if we can get past this level many of the sellers will have left, clearing the way for buyers to take over the market.
The longer the battle for $3.10, the greater the odds that $3.10 shifts to firm support. Sustain a break above $3.10 and this is where things should become fun.


XTZUSDT ANALYSISI am bearish as long as the candle is below the support line. When the candle is one-day open close above the support line I am buying the coin with a target of $3.61

XTZUSDT AnalysisI am mostly positive about Tezos. There are both Bull and Moon signals and Engineering Robo 1 is giving a Buy 1 signal. The candles are going up and the next candle will most likely break the 2.77 resistance level. When the candle breaks the 2.77 resistance level, I will buy it.

Time to XTZAfter the correction, XTZ is going to forming new up trend. The nice hold on tow supports and formed the bullish divergence between price & RSI (daily TF), says that time to long. Entry & target points suggested on the chart.

XTZ ready for a breakout to test previous highsThe Orange Line has been a strong support and resistance line so far in 2020. Yesterday's close broke above the resistance line and we retest it again now. Holding a close above the line should allow us to move towards the next resistance around $3.16 and if that breaks, then to test the previous highs around $3.6-$4. There is room in the RSI on the daily for a run up as we now break the resistance line in bullish territory but not overbought. Look for a big parabolic run in the next week.

Tezos [XTZ/USDT] on July 8 (#XTZ #XTZUSDT)XTZ increased strongly after touching the MA 200. We could consider buying in the 2.3 - 2.4$ zone, the target will be the 3 - 3.2$ zone, even 3.8 - 4$
This analysis will be invalid if price breaks below 2.2$


Unhealthy price action XTZIt can be seen that XTZ is extended way beyond the Gaussian channel on the monthly chart
Meanwhile REP can be seen to be sitting directly in the middle of the channel, which I consider healthy.
This is the monthly chart, momentum may carry XTZ. But I wouldn't be going long.

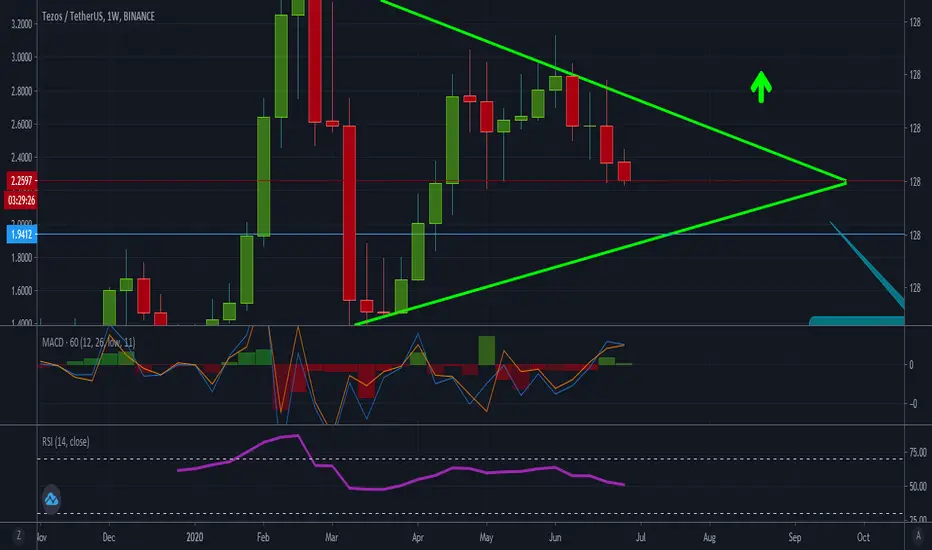
XTZ- Week ChartXTZ/USDT throwing a beautiful flag on the week chart. If this plays out it will be a sustained increase to the price action for weeks when it breaks out of the top of this flag. Optimal buy in would be the bottom of the triangle bounce.
Tezos (XTZ) - July 4Hello?
Dear Traders, Nice to meet you.
"Like" is a great power for me.
By "following" you can always get new information quickly.
Thank you for always supporting.
--------------------------------------
You should see if you can get support on the downtrend line (2).
If it rises, I think it is possible to make a U-turn with support after rising above 2.4614.
If you fall on the downtrend line (2), you are likely to touch below 2.18.
If you get support in the 2.0706~2.18 section, there is a possibility of sideways.
If sideways is possible, I think there is a possibility to shift to an upward trend.
-------------------------------------------------- ----------------------
** Check support, resistance and abbreviation points.
** Support or resistance is based on the closing price of the 1D chart.
** All descriptions are for reference only and do not guarantee profit or loss on investment.
Description of abbreviations shown in chart
R: A resistance point or section where a response is needed to preserve revenue
S-L: Stop-Loss point or section
S: A point or section that can be purchased for profit generation as a support point or section


Tezos (XTZ) - June 25Hello?
Dear Traders, Nice to meet you.
"Like" is a great power for me.
By "following" you can always get new information quickly.
Thank you for always supporting.
--------------------------------------
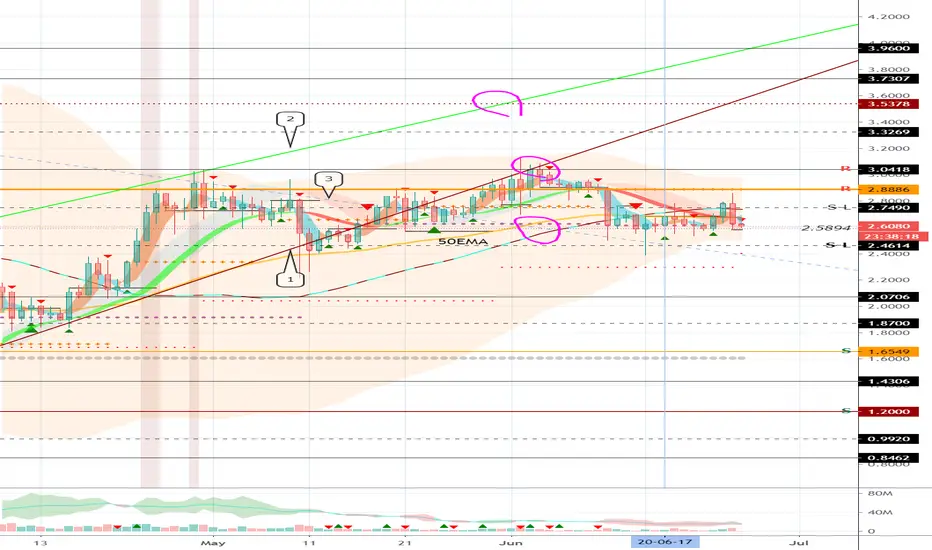
We need to make sure we can get support at point 2.5894.
In addition, you should also be able to climb above the 2.7490 point.
If you fall from the 2.5894 point, you must get support at the 2.4614 point.
If you don't get the support, I think you are likely to fall below the downtrend line (3).
-------------------------------------------------- ---------------
** Check support, resistance and abbreviation points.
** Support or resistance is based on the closing price of the 1D chart.
** All descriptions are for reference only and do not guarantee profit or loss on investment.
Description of abbreviations shown in chart
R: Resistance point or section, where the counter is needed to preserve revenue
S-L: Stop-Loss point or section
S: A point or section that can be purchased for profit generation as a support point or section
XTZUSDTXTZUSDT, the trend is currently slightly increasing. If you plan to buy, watch the candle if it moves up the uptrend lines.

XTZ trend along the trendSome spirals emphasizing the previous rally and showing a strong fibonacci support level for XTZ

TEZOS Double top prevailsDouble top prevails as strongest chart structure
this structure will likely push the price down

XTZ Long.Ready for a New Leg upXtz forming a Huge Bullish Pennant..And Respecting its Major Trendline..What i am seeing is ,it is ready for a new move soon.

Tezos (XTZ) - June 16Hello?
Dear Traders, Nice to meet you.
"Like" is a great power for me.
By "following" you can always get new information quickly.
Thank you for always supporting.
--------------------------------------
It fell below 50 EMA.
If you can't quickly rise above 50 EMA, you're likely to fall below 100 EMA.
One hope is that it is still on the downtrend line (3).
We need to see if we can get support and rise in the 2.4614~2.5894 section.
------------------------------------------------
** Check support, resistance and abbreviation points.
** Support or resistance is based on the closing price of the 1D chart.
** All descriptions are for reference only and do not guarantee profit or loss on investment.
Description of abbreviations shown in chart
R: A resistance point or section where a response is needed to preserve revenue
S-L: Stop-Loss point or section
S: A point or section where purchase is possible to generate profits as a support point or section

XTZBTC Best Entry for Long setup and I can expect New ATH#XTZBTC TA Update:-
#XTZ still looks bullish and i can expect Big Spike from here.
So i am buying more at this level.
New entry: - 2900-2950 Satoshi
Targets:- 3156/3930/ATH
Stop Loss: - If any Big Time frame candle close below 2850 Satoshi then better to safe Exit.
Otherwise hold for huge profit.
Huge Profit > Minor Loss.
Support: - If 2850 Satoshi breakdown then I will Extremely bearish on #XTZBTC and My Target for Short would be 2400/1600 Satoshi.
Resistance:- No big Resistance we need to breakout only 3200 Satoshi for New ATH.
Please LIKE and Follow me For Latest crypto Updates.
Must follow for real time crypto Updates.
Thank you.
