XTZ/USD - distribution and further downward movement.
As long as we are under the key level.
Everything looks more like shorts.
2.40 acts as local support, break-down and fixation will be a signal for sales.
The exit above 2.60 will be a signal to buy.
At 4h we are under the key level.
The EMAs are directed down.
Next level is 1.82$.
Push ❤️ if you think this is a useful idea!
Before to trade my ideas make your own analysis.
Thanks for your support!
XTZUSDT

Tezos (XTZ) - May 14Hello?
Dear Traders, Nice to meet you.
"Like" is a great power for me.
We will try to reciprocate with better information.
By "following" you can always get new information quickly.
Thank you for always supporting.
--------------------------------------
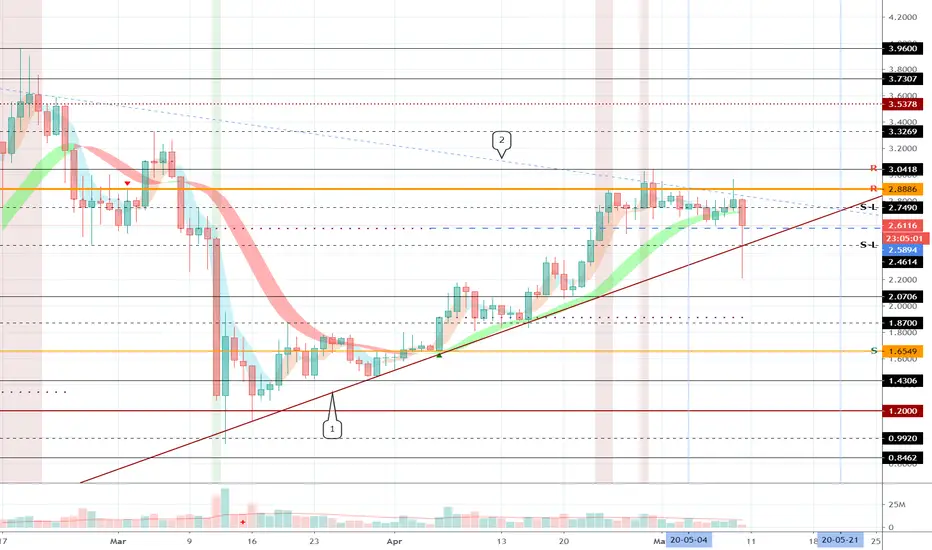
You need to make sure you can climb above the 2.5894 point.
If it falls below the uptrend line (1), we believe that trading is needed to preserve profit and loss.
If it rises following the rise of the BTC, it is expected that near 2.7490 is the maximum ascent.
In May, we marked the date you should be interested in.
----------------------------------------
See support, resistance, and abbreviation points.
Support or resistance is based on the closing price on the 1D chart.
Description of abbreviations shown in chart
R: A resistance point or section where a countermeasure is needed to preserve revenue.
S-L: Stop-Loss point or section
S: A point or section where purchase is possible to generate profits as a support point or section

XTZ-USDTHi Traders
I believe XTZ is in a descending channel.
My target mid term on chart.
Safe trading.
CM

XTZ /USDT - Opinion- narrowing the price inside the triangle, blue dotted line is an alternative resistance;
- key level 2.89$
- the indicators point upwards.
Who's not in position:
Enter after the breakout/resistance retest (dashed or solid).
Stop-loss at $2.58. Profits are marked by green zones on the chart.
If you have your own opinion or thoughts about current market situation, feel free to write it in comment below !

XTZ/USDT (Bearish Pattern ~ Confirmed)XTZ/USDT
-the bearish pattern is confirmed
-downside target is almost reached
-we either see a retest of the neckline
-or continue down to previous support at 2.1s
-short term sentiment is bearish


More Bearish momentum on XTZAfter a strong rally the past few weeks i expect that there will be a period of profit taking witch brings more downward pressure! I stay long on XTZ but on resistance i go short to cover the bulk of my position.

Tezos (XTZ) - May 10Hello?
Dear Traders, Nice to meet you.
"Like" is a great power for me.
We will try to reciprocate with better information.
By "following" you can always get new information quickly.
Thank you for always supporting.
--------------------------------------
Bitcoin Halving has about 3 days left.
I think it is necessary to prepare for the sudden movement of BTC.
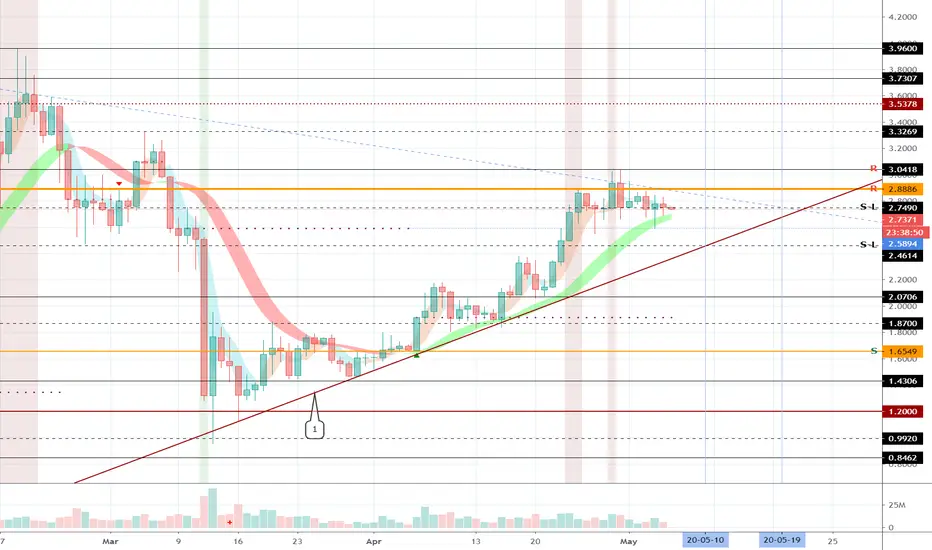
We need to make sure that it rises above the 2.7490 point and creates a closing price for the 1D chart.
You should also check if you can get support above 2.5894.
I think there is a good trend to see if the balance of power can change from the selling trend to the buying trend.
In order to ascend, the closing price of the 1D chart must be created above 2.4614.
However, if the closing price is generated near the 2.4614 point, it is not expected to increase much.
I think it is likely to fall again near the downtrend line (2).
----------------------------------------
Rather than deciding to which point it will rise, I hope now that we can decide where to keep our profits and losses and close the upward trend with good results.
----------------------------------------
See support, resistance, and abbreviation points.
Support or resistance is based on the closing price on the 1D chart.
Description of abbreviations shown in chart
R: A resistance point or section where a countermeasure is needed to preserve revenue.
S-L: Stop-Loss point or section
S: A point or section that can be purchased for profit generation as a support point or section
#XTZ & #LINK - New Update! $XTZ price has broken the bullish triangle. However, Tezos is getting weaker and weaker, so the retest can be failed. If the price falls under the support level, $XTZ is dead. If not, the target is $2.94.
$LINK is much more bullish and bullish formation looks solid. The priority is upward and the main target is $3.9.

XTZ is giving us a bullish sign hereXTZ is giving us a bullish sign here, Entering a long here.
Please note : This is a chart analyse, Not a financial advice.

XTZ/BTC : Bull Run ahead?RSI shows a clear sign of exaggerated bullish divergence, with a falling wedge forming since April. Breakout from this wedge will take us above 3$! I'm All in on XTZ

Tezos (XTZ) - May 6Hello?
Dear Traders, Nice to meet you.
"Like" is a great power for me.
We will try to reciprocate with better information.
By "following" you can always get new information quickly.
Thank you for always supporting.
--------------------------------------
Bitcoin Halving has about 7 days left.
It is expected that this week will be flown to decorate the finale of Bitcoin Halving.
We need to make sure we can get support from our current location, 2.7490.
I think it is an important location for future direction determination.
If you fall below the uptrend line (1), you are likely to touch below 1.6549.
----------------------------------------
Rather than deciding to which point it will rise, I hope now that we can decide at what point we should preserve our profits and losses and close the upward trend with good results.
----------------------------------------
See support, resistance, and abbreviation points.
Support or resistance is based on the closing price on the 1D chart.
Description of abbreviations shown in chart
R: Resistance point or section, where a counter is needed to preserve revenue
S-L: Stop-Loss point or section
S: A point or section that can be purchased for profit generation as a support point or section
XTZ (Y20.P3.E1).Macro.Back on trackHi All,
Looking at the MACRO level for tezos, it seems its regained its macro uptrend level.
I haven't looked at it for a long time, now looking at it, its done a beautiful inverted BARR structure.
I do have XTZ on the day with a slight downward tone, not much so it fits the narrative that it will be in this zone for a while as long as it maintains above this bottom level of this channel for the coming days.
For the short term, I don't see it going up much, just sideways.
However lets revisit it a few days from now and see how its tracking as its a good performing crypto.
Note: I have two targets in amber, but how soon, I need to see another 24 to 48 hrs to gage what's going on with BTC in the short term.
Cheers,
S.Sari
Ref: A.Charts
12 HRLY chart shows indicators with hidden bullish divergence and hence gaining momentum
Monthly (left) and Weekly (right) charts>
Demonstrating that we are just above the main resistance but if can have the weekly candle close above the previous undecided red candle, spinning top? then its xtz season.
If it can't and we go down the strong support of 1.8 to 2.2 range.

Tezos Bullish Engulfing candlestick pattern.Hello Traders,
XTZ is showing us a bullish engulfing candlestick pattern after reversal at 0,5 fibonnacci level, but we still bellow the short term resistance line,
For now we must wait to see if we broke the short term resistance line, but we see this asset on a bullish momentum.
Please push like button and follow us on our social midias.
Best regards Sandro and Gustavo.


Tezos (XTZ) - May 3Hello?
Dear Traders, Nice to meet you.
"Like" is a great power for me.
We will try to reciprocate with better information.
By "following" you can always get new information quickly.
Thank you for always supporting.
--------------------------------------
Bitcoin Halving has about 10 days left.
It is expected that the upcoming week will flow to decorate the finale of Bitcoin Halving.
It is close to the important point, 2.8886.
Therefore, if you rise above the 2.8886 point, I hope you will judge well and get good results.
----------------------------------------
Rather than deciding to which point it will rise, I hope now that we can decide where to keep our profits and losses and close the upward trend with good results.
----------------------------------------
See support, resistance, and abbreviation points.
Support or resistance is based on the closing price on the 1D chart.
Description of abbreviations shown in chart
R: Resistance point or section, where a counter is needed to preserve revenue
S-L: Stop-Loss point or section
S: A point or section that can be purchased for profit generation as a support point or section

#Tezos / BTC Tezos made a fantastic spike
We still expect that the rise has not ended and will continue to rise to respectable prices, as shown in the drawing
A good buy is on the trend line
If the trend line is broken, this idea will be canceled
Please support this idea by pressing the like button
Take Care

XTZUSDT, short to 2.69, 2.63. Fake growth.Hi, friends. Lets look on XTZ. We see fake growth. Big volume undistributed sells. So we go down to 2.69, 2.638. Keep your wallet guys! Levels thanks to X-Lines indicator. If you want try X-Volume free trial write in private. Link to X-Volume below.
Waiting your likes!

Tezos Possible RejectionPossible rejection at 2.618 fib line
looking for a retracement to form the H&S head
Looks good for short
another H&S pattern for XTZ

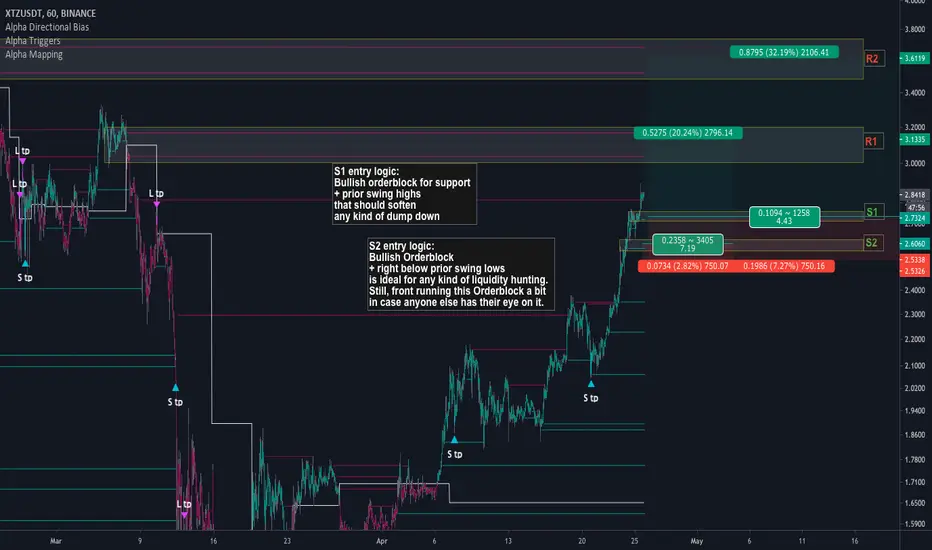
Tezos (XTZ); Can the Bears Stop this Tezos Run?
✨ We provide charts every day ✨
Like and Follow to help us grow family! 🎉
---
Hey gang! Today we see Tezos in an uptrend and showing no sign of stopping. Let's take a look at some levels and see if we can't find an entry.
---
STRATEGY USED:
Range Retester
Trend Confirmation = Directional Bias
Entry Signal = Orderblock Mapping with or without retest of Directional Bias Range
Exit Signal = Triggers OR Directional Bias OR Orderblock Mapping
---
1. Directional Bias is showing an uptrend (Teal bar color) for XTZ/USDT on the 1 hour chart.
2. With this strategy we want to enter on retests of ordeblocks while in an uptrend (Teal bar color).
3. We are first and foremost looking at S1 support for an entry due to the bullish orderblock and prior swing highs that should soften any type of dump to that level.
4. Next level we would be looking at S2 support. The idea here is to front run the top order block to ensure an entry at that level in case anyone has their eye on it.
5. Either setup is valid and depending on what risk:reward you are looking for, R1 and R2 are both valid ranges to consider an exit using the bearish orderblock clusters.
6. Alternatively we will exit if Directional Bias shows a downtrend (Maroon bar color) or scale out if we get an L tp (long take profit) signal from Triggers.
XTZ and its mission to Andromeda!Hy guys!
Tezos is very bullish and it looks to me that price could repeat a Februar 2020 situation, where a triple EMA cross happened right before
this parabolic price rise to nearly 4USD.
In the current situation we could see a Pullback to the 2.58-2,60USD zone which aligns with the 0.381 Fib level and is also a flipzone, indicated by many touch points in the past, which could make this a great area to fill your bags! Eventually, this area also could be the end of a potential wave 4, however, yesterdays daily wick nearly touched this area already!
Currently price also forms a bullish Pinbar on the daily.
In my opinion, the chances are higher to see a trend continuation and that a correction that many are waiting for, already had happened!
See the screenshot for more details!
Please comment, share and like this idea if you get out some value from it. This will keep me motivated to eventually post more ideas in the near future. Thank you!
PS: Always use a Stop Loss!

XTZUSDT Short thesisXTZ went on a multi day run nd topped out at 2.90.
I was waiting for first red day to start building a short position as soon as it go red on daily.
My avg short is 2.8
Risk lvl is 2.90
Target to cover is 2.5 or 2.45

