Long order in for TEZOSI put a long in on Tezos, here's another opportunity for a long.
entry - whenever you want ( i entered in at 1.5386)
tp - 1.6110
SL (3% or 5% of your entry) ( my SL is at 1.4925)
XTZUSDT

XTZUSDTHello Crypto Lovers,
Mars Signals team wishes you high profits.
This is a one-day-time frame analysis for XTZUSDT
In this chart, we have R2 as our resistance line and the disability of the price to rise is seen. R1 used to be a support line and even S1 and S2 are our other support lines that express the support of the price at some points. At the present, the price is fluctuating in R1 area and we believe it will fall toward the bottom of this area and then it will experience a rise to R2. The lowest amount of R1 is the point that we can consider our long position. If the price fixes over R1, then we predict more rise for it to R2. Even it is possible for the price to face more decline when it reaches S1 and it can move below it (which is not so probable at this time).
Warning: This is just a suggestion and we do not guarantee profits. We advise you to analyze the chart before opening any positions.
Wish you luck

XTZHello everyone. its my expected scenario of XTZ. I myself set alarm for taking position for Tezos.

Imbalance on XTZ chartThere's an imbalance on the Tezos $XTZ charts that need and will be filled.
Expect sharp price movement upward!
Entry: your choice
Exit/TP: 1.432
SL: 3% of your entry
good luck!

will open a xtz short.Stops about the equal Highs and 50% of the consolidation convince me that this trade is useful. 15 minute timeframe has to be blessed.


#Tezos Resistance at $1.54, XTZ Prices in a Bear Flag FormationPast Performance of Tezos
Tezos prices are trailing the USDT after a relief rally. At spot rates, the coin remains within a bear breakout formation, sliding six percent in the last trading week. In the immediate term, the primary support and resistance levels lie at $1.22 and $1.54, respectively.
#Tezos Technical Analysis
From the daily chart, sellers are in a commanding position. XTZ prices are tracking lower in a descending channel within a bear flag. With sellers unwinding gains, traders can wait to trade the breakout in either direction. Preferably, the surge in either direction can be with rising trading volumes. A close below $1.22 will nullify the bullish outlook, confirming sellers of June 13. In that case, XTZ may slide to $1.20 and even $1.10 in the medium term. Conversely, gains above $1.54 may see Tezos bulls drive prices towards May 2022 lows at $1.64.
What to Expect from #XTZ?
Buyers are confident, but bulls are struggling to tame the wave of recent liquidation. While recent gains may slow the sell-off, a break above $1.54 is required to restore traders’ confidence.
Resistance level to watch out for: $1.54
Support level to watch out for: $1.22
Disclaimer: Opinions expressed are not investment advice. Do your research.


XTZ Potential Reversal SoonXTZ is one of the most legit projects in the crypto space.
I have a short term price target of $1.86 and $3 by the end of the year.
Looking forward to read your opinion about it.

XTZUSDTHello Crypto Lovers,
Mars Signals team wishes you high profits.
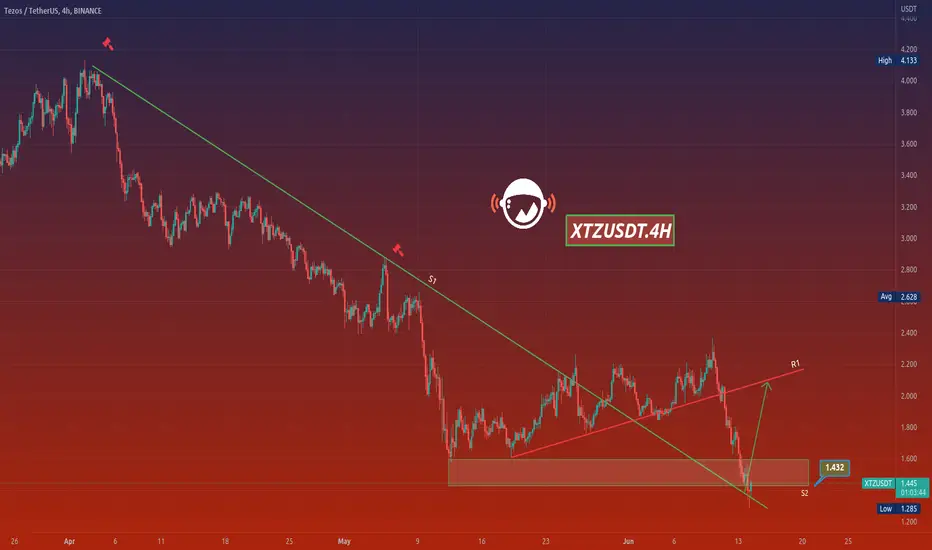
This is a 4-hour-time frame analysis for XTZUSDT
As we predicted a falling trend in our last analysis on May 29, we observe here that it came true. In the current chart, we have S1 which used to be a resistance line and also R1 used to be a support line which shows the well support of the price at several points. Now the price is fluctuating below in S2 area and on S1 line and we expect this is a pull back of the price to S1 and then we will have a rise for it to R1 line. But if the price moves below S1 and fixes there, then we will have more decline for it.
Warning: This is just a suggestion and we do not guarantee profits. We advise you to analyze the chart before opening any positions.
Wish you luck
XTZUSDT: Bearish Channeling, Bearish Bias doesn't end yet?Hello Fellow Tezos Coin Investor/Trader, Here's a Technical outlook of XTZUSDT!
Support our content by smashing the like and follow button, you also can share your opinion in the comment section below.
XTZUSDT is creating a bearish channeling. Furthermore, The MACD indicator created a death cross, which confirmed a potential downside momentum to the target area.
All explanations are presented on the chart.
The roadmap will be invalid after reaching the target/resistance area.
"Disclaimer: The outlook is only for educational purposes, not a recommendation to buy or sell the cryptocurrency"

XTZ is in a Rising Wedge...what will Happen?XTZ is in a Rising Wedge Pattern. This is Of course a bearish Pattern which means we Should Expect the Price to Reach Lower Levels Even From Now! The Price can Decrease and It Should be Clear To you That No Break Out Has Happened yet So It is not Safe to Take Short Position (For Now!) There is also a Regular Bullish Divergence (-RD) on MACD which Strengthen The Idea Of Tezos Being Bearish! The Expected Target and Support Point Right now Is around 1.600$
-XTZ is in a Rising Wedge Pattern
-No break out yet
-(-RD) on MACD
-Expected Price and Support Point 1.6$
_ _ _ _ _ _ _ _ _ _ _ _ _ _ _ _ _ _ _ _ _ _ _ _ _ _ _ _ _ _ _ _ _
Thank you for seeing idea .
Have a nice day and Good luck

XTZ AnalysisXTZ Analysis
This is my idea. I have tried my best to bring the best possible outcome to this chart, Do not consider it FINANCIAL ADVICE.
So let's see how the market reacts in the coming days.
This chart is likely to help you in making better trade decisions
I am not a market maker I could be wrong.
Everything is on the chart.
Everything Depends On BTC Movement
Thank you

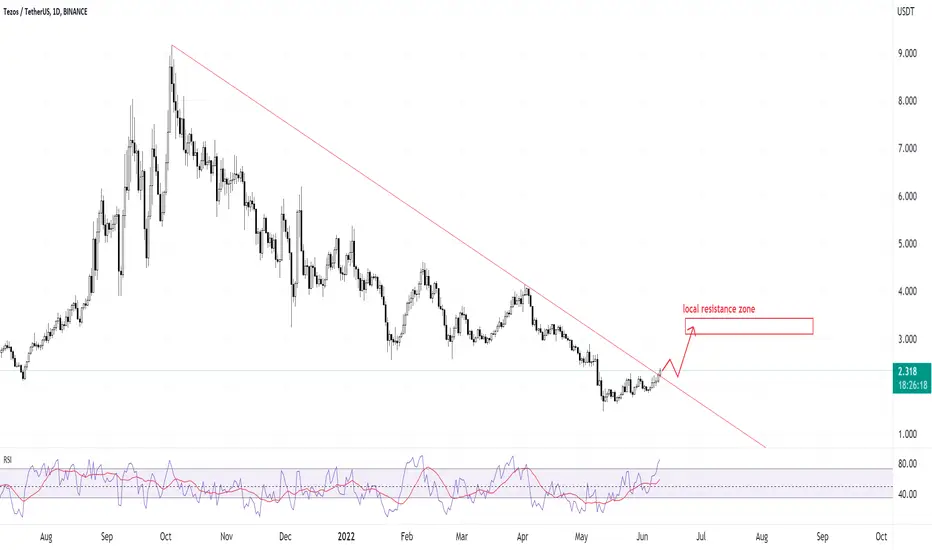
XTZ has broken the long resistance - time to go upFirst thing, red resistance line has been broken coming from many months back. Price is indicated to have a good bullish +30% to +40% in the coming month, depending on BTC stability.
In that case, I have marked the local resistance zone.
For a quicker time frame we are actually in a resistance zone right now, and it's very much possible that it will go down towards $2.00 before finally going up. But please keep in mind, overall XTZ is bullish on long term. (4-6 months)
I am linking the shorter time frame (45 min candles) chart below, so you can keep track. With the daily chart above, now you can keep track of important zones.
Good luck!
P.s. I walk the talk, and my trade performance can also be seen on the 45 min chart below. Scroll to the bottom to see my net profit in one year! and my success rate.
XTZUSDT 1D🔥 Breakdown of the ascending wedge!!!Now the asset is in the zone of an ascending wedge on the daily timeframe, the pressure goes to the lower limits of the wedge, thereby I expect a breakdown of the pattern, I think you can go from the lower limits of $ 2 to set a take profit of $ 1.7
Good trading to all!
✅Do not forget to visit the channel there is a lot of useful information about trading.

Xtzusdt long ideaXtz break the 2.14 dollor resistant level and long term falling wedge (you can see it on weekly chart)
Long scenario shown by green arrow

XTZ Update - short pullback to $2.08 coming soon - then bullish XTZ oversold on Daily and 4hr time frames. Expecting a nice little pullback to $2.08 range or to the local support zone. Strong coin overall, and it is trending up for the long term. Bullish overall on daily.
Previous idea linked below

XTZ - Tezos. The Next BIG thing!? XTZ Tezos, the self-amending cryptographic ledger now has been backed by the biggest stable coin USDT.
This will help XTZ succeed further more. Tezos fundamentals are very strong as its already ahead of the POS competition.
"Tezos is also unique because of how it has started to be used by high-profile businesses. In September 2020, it was announced that the French banking giant Societe Generale planned to use this blockchain for experimenting with a central bank digital currency."
"Big cryptocurrency exchanges such as Binance and Coinbase have also unveiled support for Tezos staking, meaning users can receive rewards based on the XTZ that they hold. This is not a feature that’s seen too widely across digital assets."
"Tezos aims to offer infrastructure that is more advanced — meaning it can evolve and improve over time without there ever being a danger of a hard fork. This is something that both Bitcoin and Ethereum have suffered since they were created. People who hold XTZ can vote on proposals for protocol upgrades that have been put forward by Tezos developers."
If Tezos can bounce from this support and consolidate. It may be the next BIG thing long term.
My future price target is - 30.00 approx.

XTZ pattern breakout XTZ / USDT
Price broke-out the bullish pattern on its fifth try
the overall market still in bear/ sideway
However this is bullish momentum for XTZ
if price able to hold above resistance line for next few hours expecting more bullish movements and first resistance is around 2.55$ (first TP )
Best of wishes

#Tezos Prints Higher, Will XTZ Edge Past $2.2?Past Performance of Tezos
The dominant trend in the short term is bullish. Gleaned from the formation in the daily chart, buyers have the upper hand. Risk-off swing traders may find loading opportunities to buy the dips with targets at immediate key resistance levels. In the past 24 hours, XTZ is up four percent and stable in the previous trading week.
#Tezos Technical Analysis
Tezos is inching higher, trending inside a rising channel above the middle BB in a bullish breakout formation. Even though prices are within an ascending channel, traders may find entries to buy Tezos above the flexible support line and $1.80. On the other hand, risk-averse traders can wait for a clean break above $2.2 and last week's highs before riding the wave with targets at $2.5 in a possible retest. A recovery is likely following the 57 percent correction from 2022 highs. Depending on the reaction at $2.5, the move up would be a retest or a buy trend continuation pattern. Conversely, losses below $1.80 and the ascending channel would invalidate the bullish preview, setting sellers in motion.
What to Expect from #XTZ?
Buyers are optimistic, as per the arrangement in the daily chart. However, a close above $2.2 will be crucial in determining the immediate term price trajectory following double-digit losses from the beginning of the year.
Resistance level to watch out for: $2.2
Support level to watch out for: $1.8
Disclaimer: Opinions expressed are not investment advice. Do your research.

XTZUSDT - SETUPXTZUSDT price is trying to hold its critical level, if the price holds this level we may see an upside. Otherwise, the price may go towards highlighted support areas.

Trading opportunity for XTZUSDT Based on technical factors there is a long position in :
📊 XTZUSDT Tezos
🔵 Long Now 1.930
🧯 Stop loss 1.850
🏹 Target 1 2.000
🏹 Target 2 2.100
🏹 Target 3 2.260
💸Capital : 1%
We hope it is profitable for you ❤️
Please support our activity with your likes👍 and comments📝
