XAUUSD ShortXAUUSD has completed its 3rd wave and going to complete 4th wave as we can see it has fallen into a ending diagnol now after the 4th wave completes am seeing for a short trade on retest of trend line
Xuausd

GOLD BTC OR S&P500?18 Months after COVID-19 surfaced, the world economy is on its knee's. We are looking at inflation close to that of 2008/2009 in many countries. A recipe for disaster. Stocks struggle earlier this year as many expected inflation to be sky high since Uncle Sam at the FED printed 21% of all circulating dollar in history. Yes you heard that, Since the dollars creation 21% of the dollar that exists was printed due to covid. Weird, were is the money going? Everyone still broke right? People have less, well i can say for sure the poor(us) are definitely poorer and the rich well unaffected or richer as usual. Covid was a beautiful beautiful scam. Not saying it was fake as thats pure stupidity, but for sure countries and governments decided to monetize this tragedy. While most lost family and friends the rich made more as usual. The evidence is clear. Regardless, US bonds yields which we expected to react to the inflation news took the opposite affect. Instead we saw NASDAQ jump an insane 1.7%. Which in stock terms is insane. This is due to the fed promising to keep borrowing interest rates at zero. Essentially the US market which leads the world, sadly, (like the way BTC is leading crypto again sadly) is surviving on printing more. The government or the FED to be more accurate print money and buy stocks and borrow to the rich owners of business's. This is not a secret its called QUANTITIVE EASING. There is no evidence this works, only been tried once in 2008/9 but its not clear if it made us recovery since many techniques were tried. All in All most may have got here and thought what is this young man waffling about. Well look, The US market is showing strength when it really shouldn't i don't believe this quantitive easing will work and if it does its a matter of delaying the explosion of the bubble which is the American stock market. Also the terrible USD will probably lose a lot of value which it has been doing for years now. So WHATS THE SOLUTION YOU ASK? B T C. Love it or hate it. It is digital gold. Anyone disagree's with me is doing so out of pure ignorance. BTC is clearly more significant than gold in all aspects of Money storage or hedging against inflation. The S&P500 which was the old hedge will go to shit and if it doesn't 5-10% a year isn't that appealing is it? Long term BTC has proven to be the best hedge and In my opinion is better valued than the bubble which is the US stock market. I also believe in buying gold as a hedge. All in all we MAY see some what of a super cycle with this terrible US mess of a market which is slowly unravelling. 2020-2021 will have movies about it. How so many profited from Covid crash and the market crash which is approaching. Meme stocks and crypto will feature. Be a part. Anyways ima go back to enjoying the sun.

XAUUSD Swing Long and then potential ShortXAUUSD is in its correction part completed its A and B part and is in its C part ,
i has also followed wolf wave in which it will still go down a little and then will move upward minimum toward tendline resistance or maximum daily resistance and will short potentially..
fingers crossed , keep enjoying , happy trading

xauusd - GOLDI HAVE PLACE A BUY @ 1860!!!
HUGE Descending Broadening Wedge !! IF this 4hr correction was just a break and retest on the daily for a breakout. this could lead to massive gains !!
LONG TERM BUY:
en: 1860
sl: 1840
tp: 1940
this correction has only been 2.8% a bigger drop can still happen.
because im bullish on gold and its trending up i BUY

xauusd - GOLD 1hrGOLD is still making higher highs and higher lows on the 4hr n daily which is very bullish
but...
creating a upwards wedge with decrease in volume is not bullish.
taking a look at the 1hr we see big red candles! bearish short term.
look for liquidity
price action: (sell)
en 1902-1905
sl 1912
tp 1881
if price continues to follow the trend then price should very well buy after touching the 50ma
watch the 50MA
trend: (buy)
en 1903
sl 1893
tp1 1920
tp2 1927
early entry RIGHT NOW buy @1897 and hold to a higher high. tight sl @1893


Sell Silver !!!!!!!!!!!STRONG RESISTENCE POINT !!!! SELLLLLL NOW
RESISTENCE PUSHES PRICE DOWN
OPEN FOR OPINIONS ALWAYS GOOD OR NEGATIVE
FOLLOW FOR MORE

XAUUSD 1W TIMEFRAME ANALYSIS Hello Traders, here is the full analysis for this pair, let me know in the comment section below if you have any questions, the entry will be taken only if all rules of the strategies will be satisfied. I suggest you keep this pair on your watchlist and see if the rules of your strategy are satisfied

What's coming for dollar and linked pairs to it.(EurUsd, Xuausd)If we observe the US dollar index on monthly timeframe, we can observe that currently it's in the correction phase. If we look at the past support and draw a Fibonacci retracement it shows that support levels falls at 38% of that which gives us a clear picture of it too. So as soon the dollar index completes its correction it will start going up which will affect the pairs linked to dollar like, eurusd, xuadusd, etc. As soon it will start going up better position for these pairs will be to sell.
I hope you like the analysis. If you something more to share go ahead.


xua/usd idea short long grab *UPDATE MARKET MAY PUSH PASS SUPPORT TO O.618 ON FIB WAITING FOR SUPP TO BECOME RESIS THEN RETEST OR A BOUNCE OF THE CURRENT SUPPORT

Gold is Bearish!Gold trends have bearish sentiment over the long run. We might be headed lower into the buy zones until gold starts seeing bullish pressure accumulating in the buy zones and having another spike inro our sell zones before dropping lower..

Gold potential longGold very recently dipped in to a pool of liquidity (last significant low before a large move up) that led to the parabolic rally that printed new highs.
As soon as the violation happened we saw rally that violated the bearish market structure on the daily timeframe giving very bullish signals.
This correction might not be over but there is an opportunity to buy gold and ride it to 2000.00 and potentially higher.
I don’t know what the market is going to do long term but for now PA is pointing me in that direction.
I’m waiting for a dip in to the zone I highlighted below. I would have a limit order be I haven’t been following gold long enough to be sure of its levels/zones just yet.
I will have to watch this carefully and monitor price when it reaches my levels.
Let’s see how this one plays out.

XAUUSD/Gold USD finally might be breaking outGold is testing 1874 resistance for the third time in the past month.
Waiting for the confirmation to break the resistance before taking it long to the next resistance at 1896.
If it breaks 1896, the next level we are looking at is 1911.
My interpretation of the charts. All feedback and observations welcomed!


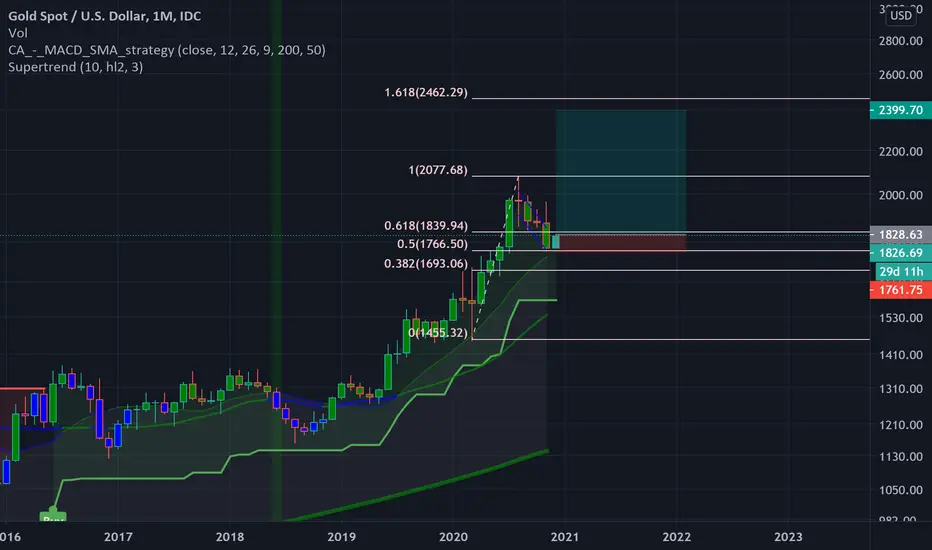
A look at the monthly chartHello friends
Today I took a look at the monthly gold chart and I think gold hit a beautiful pullback to the previous ceiling and you will reach the peak soon.


Nears the buy zone (~1750)Hi... we can wait for the 1750$ and then, set up a position with good profit
