XVGUSD


XVGBTC Trade AnalysisI personally chose XVG as one of my top privacy coins. They have had a great run since launch, good team, healthy technicals and bright future.
Analysis:
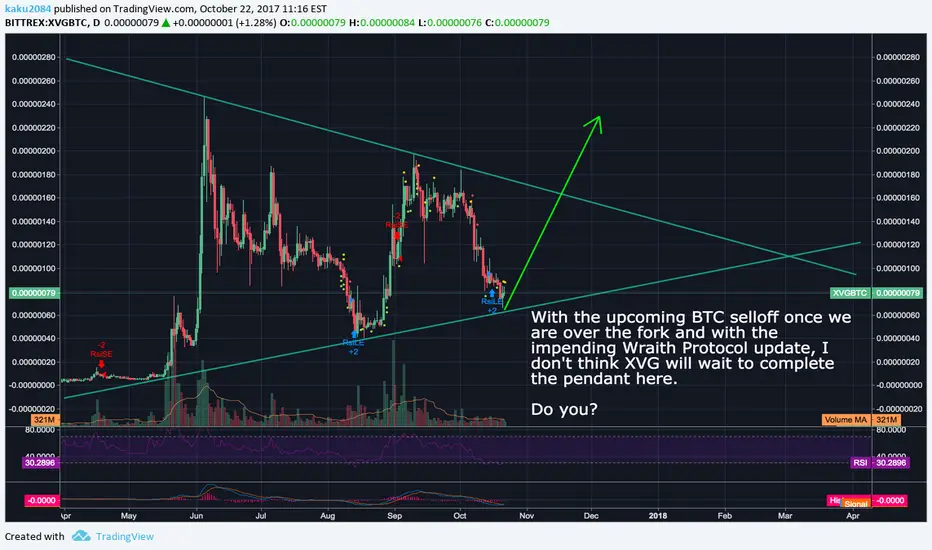
XVGBTC is currently in a symmetrical triangle pattern. This is a famous trend continuation pattern, in this scenario breakout would favor a bullish run but breakout to the downside and below bottom line of triangle can be a STRONG SIGNAL of trend reversal or potential bearish movement.
Symmetrical pattern breakout has been known to breakout:
Full height of triangle from initial inception
half height of triangle, or measure from apex -> top of triangle at inception.
These breakout ratio's are popular for bearish movement as well.
Blue boxes are price ranges and measure both of these.
Fibonacci Retracement shows previous 2 cycles' retracement targets (0.786 - 1)
Stoch RSI Shows overbought. It has not reached the top of the channel yet but with the way RSI is looking shows that there is room for movement back to the bottom of channel.
This may be due to XVG Wraith protocol release today, I know many crypto-enthusiasts traded off this fundamental, so many are taking profits at this zone, giving it a little resistance and therefore, potential bearish movement.
MACD Histogram shows it can potentially support upward movement.
What did I do?
I bought XVG at 90 sats and sold today 50% of my position at 133 sats for 48% profit half way up channel due to stoch RSI showing heavily oversold.
I am currently holding the rest and set an alert for bearish movement at 120 sats. If It triggers, I will reanalyze and reconsider my position.
I may consider selling the rest to re-enter at the bottom channel and ride the last swing or 2 up before we reach the apex & breakout.
If it goes up, there is not much I can do but manage my emotions and make a concrete decision to either re-enter or find a better trade to allocate some holdings.
Notes:
Watch volume spike for indicator of strong bullish movement.


Verge (XVG)Very good buy setup, be careful of the heavy resistance at $0.007 With verge we usually see massive momentum off these supports.
Best of luck to you.
Current price-$0.005045/0.00000091 BTC
Market Cap-$71,275,139/12,867 BTC
Volume (24h)-$1,699,860/306.87 BTC
Circulating Supply-14,127,680,833 XVG
Max Supply-16,555,000,000 XVG


On the Verge of Eruption........I own Verge in XVG/USD, Ive been looking for an opportunity to buy more and I think I just found a good one if it pans out. I usually Chart against the Dollar when possible, but this XVG/BTC deal is too good to pass up. Another reason I am going with the XVG/BTC is that I am counting on Bitcoin being bearish for a bit and this may help fuel a move up in XVG/BTC. This stuff is dirt cheap so its Time to Stock up on Dirt Baby!! I put in 2 targets, but I am holding long term.
The Rules
1. (BEFORE YOU BUY) You want to see this rise well above the .50 retracement and close up there, It can even go as far as .75 extension or spike above it, I do not want to see it close above the .75, if it leaves some wicks behind, no problem, but I really want to see it go into the .75 area and get rejected and fall back down near .50.
2. (GET Ready To BUY) We buy the pull back to .50 area, it may overshoot .50 from panic selling, it could overshoot .50 cause it wants to, the point is to buy .50 or around it, unfortunatly this is an Art, not an exact science. The range to buy is 177 Satashi to 189 Satashi, .50 is sits on 182 Satashi. this setup is forgiving, you dont have to be exact.
3. (Stop Loss) For you short term day traders, set a stop loss at 148 Satashi or lower if you see fit for your style, if it closes below .50 on the retracement, it may be failing.
Dont forget,
Be Patient.....
and
Let the trade come to you!!! If it does not come to you, it wasnt meant to be, or I am a really bad Analyst :-)
- Netrunner


