Topglove possible 1 years + roadmap ahead . 20/Nov/22.For studies purpose only. Topglove possible next 1 years plus roadmaps..
Xyz3dtrading

DNEX. Elliottwave updated 18/Nov/22DNEX probably completed its zigzag correction ABC ( Red Circled).

Gold just completed wave A of triangle. 11/Nov/22So! Gold and equities market went to “Eureka moment!” Yesterday night. As US latest CPI reading lower than expected. That give FED to less hawkish to do only 0.25 in Dec and “halted” after that?.. maybe not..Maybe the near “collapse” is not about “inflation/CPI”..p/s there is only abc 3 subwave inside any impulsive waves not 5 waves in written “Textbook”..

Tencent probably “bottomed” as China’s major stock. 8/Nov/22.Tencent stock’s downtrend price probably stalled @ confluence zone of 1) lower support of parallel line 2)Demand Zone

Supermx. Why it already @ multi year “bottom”? 7/Nov/22.Supermx. “Why” its stock price having “high probability “ @ multi years “bottom”?! The “answer” lie within this “bunches of” ema crossover! BUT it’s not “a simple” so called ema’s crossover / ema’s act as support/resistance “ strategies. You got to “see/check” stock’s price “whole pic” from yearly to 1 min chart..It might take you > 10 years / 10k hours to find the answer as I did. EMA is the ONLY indicator I still keep it now to “confirm my entries on the empty right space of any chart” after “trial and error/ back testing,super” few hundreds even thousand indicators/system. You probably won’t see my past analysis with “bunch of ema’s” because it “look messy” as “most expert traders” will tell you try to keep your chart “ as simple as possible “..But to be honest there is nothing is “simple” chart in trading. As a “simple ema system” is not just a “simple” ema crossover/support/resistance strategies”... Those “master traders” said so because only they have tried hundreds if not indicators but system only they could come into “zen / zone” stage by “throwing” unnecessary staffs. But novice will learn the piece by piece only by reading “simple chart”..Tips : Always try to “discover” with why/ how.. As human’s most “inventions” get inspired by “discovery/ explorations” ..To have “discover” new things Once a while we need to break the rules. E.g. The world “most laws/rule/standards protocols” is set by westerners so to have “innovative ideas” we must “break their rules” once a while as they break their own ancestors’s “rules”..

HangSeng waiting to “boom” = Bright future HongKong. 6/Nov/22Hong Kong’s Hang Seng Index have backed to “square one”?.. As its price slightly below its 25 years level ( 2020 - 1997 ).. BUT chart tell me different stories as I trade what I see “first” then what I think “second”.. where my “thinking” possible have bias and prejudice. You probably see lot of “doom” comments from western media or “westerner educated” Chinese’s “expert “ themselves...

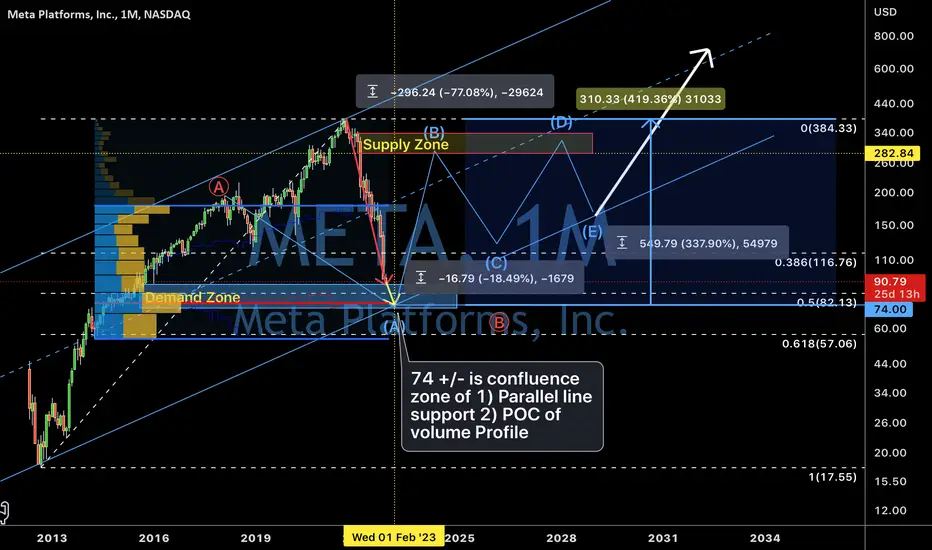
META/Facebook how “low” it can go? 5/Nov/22Meta / Facebook share price have dropped more than 70% ( 77.08%) Since A.T.H.. Probably another -18.49% +/- to reach 74+/-...AND probably ranging ( flat, triangle etc) for few years after after previous years of strong rally..
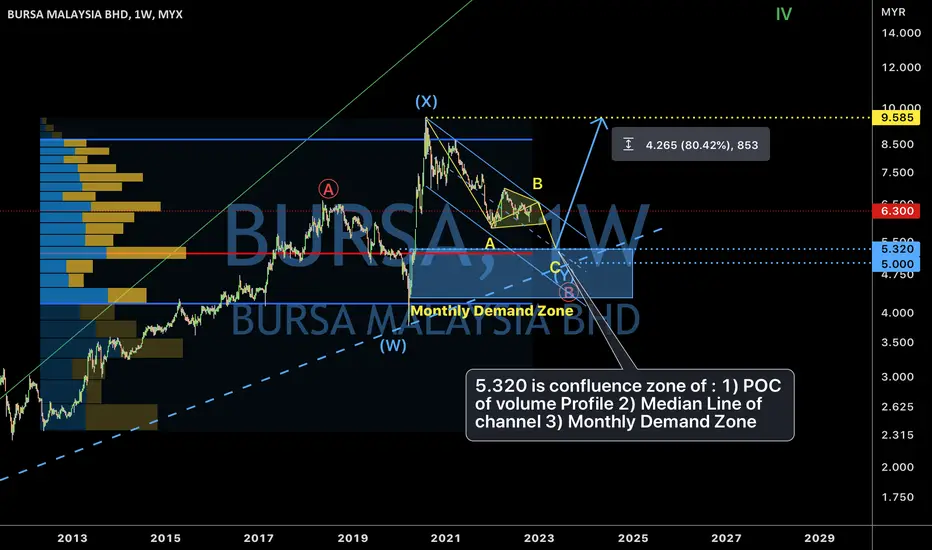
Bursa probably not “bottom” yet. 4/Nov/22.Bursa probably “bottom” @ 5.320 +/- or 5.00 ( major trend line ). 5.320 is confluence zone of : 1) POC of volume Profile 2) Median Line of channel 3) Monthly Demand Zone.
Gold long @ 1633 +/-. 4/Nov/22.Gold having a bearish “trap” as it occur very often during ranging/sideway market e.g triangle pattern. We always see expanding flat ( which seldom mentioned in textbook elliottwave rules) occur in 1 of its triangle’s wave just to “trap” buyers/sellers. Gold probably continue its short term uptrend probably right before/after today US NFP.
P/s it seem like Gold and equities start backing to “normal” correlation which is negative correlated.

SP500 otw to 3000 +/-. 3/Nov/22.FED already give a hint, he will “pull” an “emergency hand break/reduce “oil” by mid of Dec ..So probably the last F1 formula race track of the year!

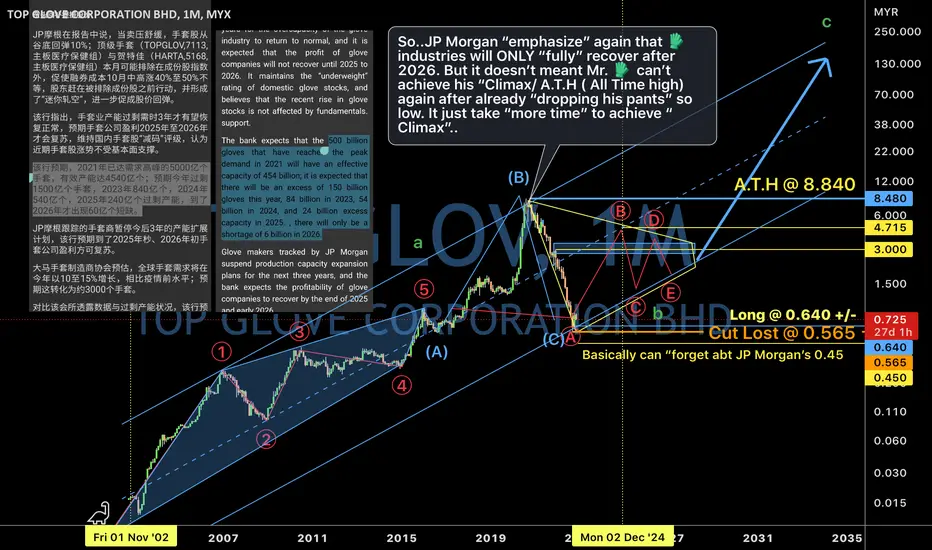
Topglove. Glove’s “long term” gloom?!. 3/Nov/22So..JP Morgan “emphasize” again that glove’s industries will ONLY “fully” recover after 2026. But it doesn’t meant Mr. Glove can’t achieve his “Climax/ A.T.H ( All Time high) again after already “dropping his pants” so low. It just take “more time” to achieve “ Climax”..
Gold long @ 1626 +/-. 3/Nov/22.Gold’s 1626 is confluence zone of 1) Demand Zone 2) Parallel line support 3) 3 drives Lower trend line support.

Gold long @ 1635 +/-. 2/Nov/22Gold’s 1635 is confluence zone of 1) lower trendline support of 2 channels 2) Lower limit area of Volume profile.

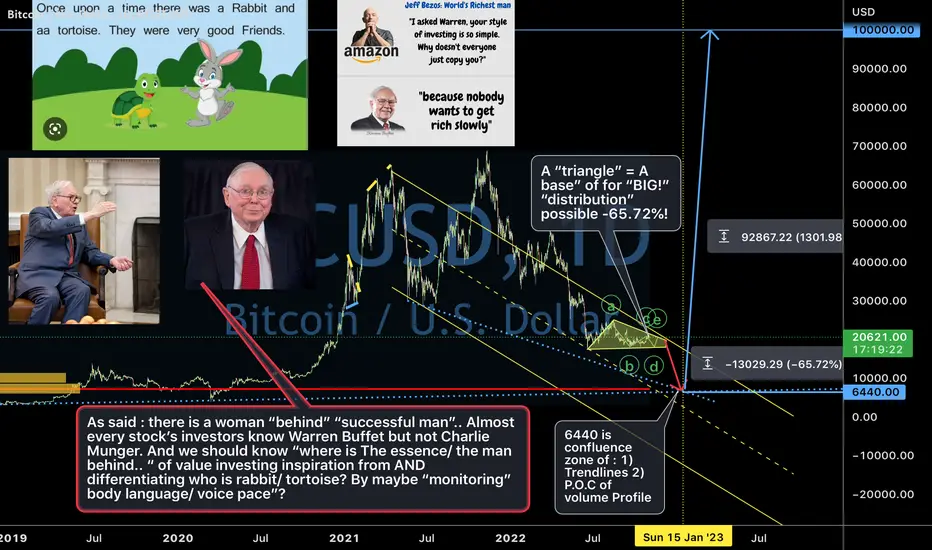
Bitcoin. Everyone “can’t wait 100k”. Me too. 1/Nov/22Bitcoin. As “value investor” Warren Buffet never encouraged bitcoin investment : a get rich quick /get poor fast scheme probably for most spectacular..
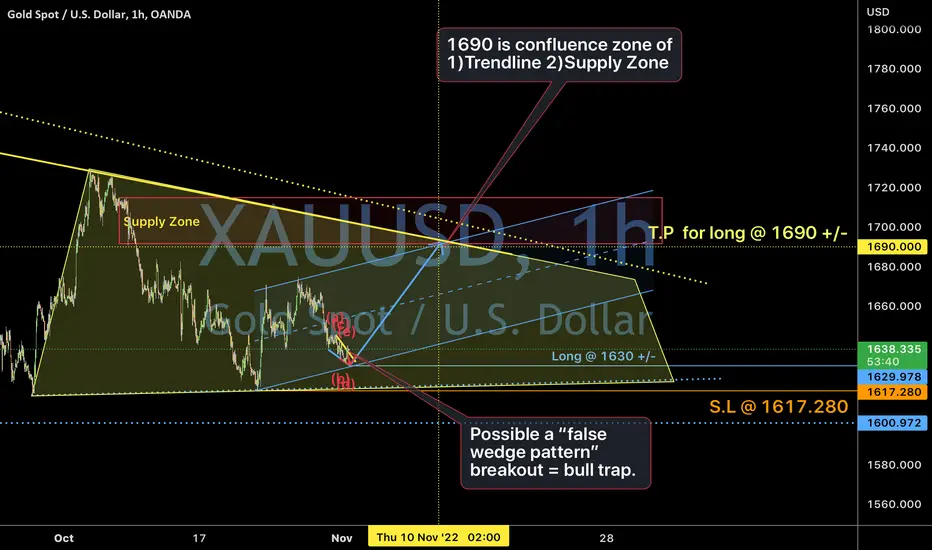
Gold. Possible “false wedge breakout”. 1/Nov/22Gold hit previous ideas stop lost but price seem “squeezing” by forming a reversal “wedge pattern” But there could be 1 more leg down as “wedge pattern” could be a “triangle wave 4 in wave structure “ before trending up to 1690 +/-..So..So gold possible trending up after coming FED rate hike decision on 2 /Nov/22..
SP500 almost complete its “triangle”. 31/Oct/22SPX emini / ES1! Probably complete its expanding triangle pattern @ 4045 +/-..

Topglov. FOMO @ “bottom”? 31/Oct/22.Topglove probably @ its “temporary top” after surging up (38.02%) from last posted ideas. Many traders/investors might feel “the urge” as FOMO ( fear of missing out) “ the boat “..BUT its price might retrace -20.99% to around 0.640 { a confluence zone of 1) Demand Zone 2) lower trendline support of channel 3) Volume Profile’s P.O.C }..while waiting for FED rate decision or after Hartalega next quarter result on 9/Nov.

Gold long @ 1640 +/-. 29/Oct/22Gold probably found base at Demand Zone. Long toward 1707 +/- which is confluence zone of 1)Trendline 2)Supply Zone 3) Volume Profile value Area upper limit

SSE (Shanghai stocks index ) probably “bottomed”. 28/Oct/22SSE ( Shanghai Stocks Exchange ) index probably now as “leading indicators” for world’s economic not US anymore..As its index “crashed / bottomed” much “earlier than US markets like its individuals stocks e.g BABA, Tencent, Xiaomi, NIO etc..

Gold. watch out 1645 +/-. 27/Oct/22 Gold probably forming a running flat pattern in Wave b (green circled) where Price might hold @ around 1645 right before/after today US Advance GDP.

KLCI probably bull out / bear in. 25/Oct/22KLCI future Index aka FKLIi probably resuming its bearish trend anytime soon.


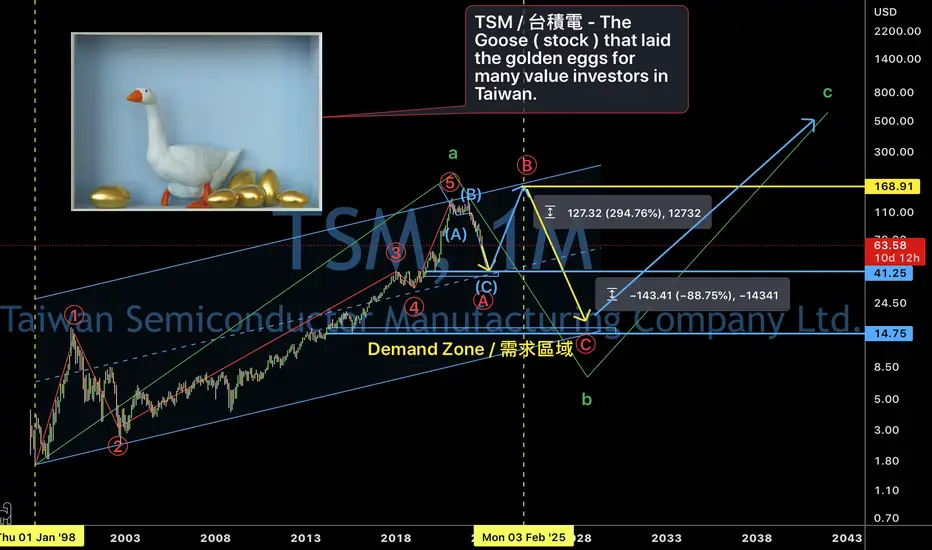
TSM ( Taiwan Semiconductor ) analysis. 21/Oct/22TSM ( Taiwan Semiconductor Manufacturing). The world largest semiconductor foundry. TSM .The Goose ( stock ) that laid the golden eggs for many value investors in Taiwan probably only found its base @ around 41.25