Gold. Short term “conventional “ ew v.s “real” wave. 5/August/22Gold. Although “conventional “ elliottwave might view there might be 1 more leg up for gold to reach around 1800 just to complete impulsive wave 1 ( yellow). ..
Xyz3dtrading

Gold.medium term Conventional” E.W v.s “real” waves. 5/August/22Gold medium term “conventional “ Eliott wave counts V.s. “real” waves counts..E.g..: Based on the “speed / Z-factor” Plus + Price “contained “ within the Red parallel Channel = ( is corrective waves) :- “Real” wave counts = (W)(X)(Y)(cyan/light blue)

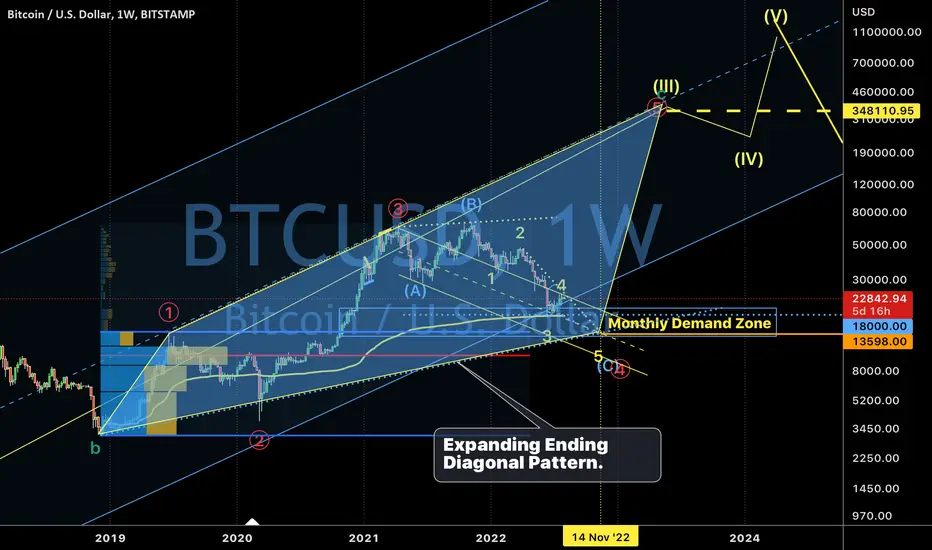
Bitcoin probably drop to around 13598 by end 2022. 2/August/22 Bitcoin probably going much lower than 18000 as previous idea due to its expanding flat pattern (A)(B)(C) ( cyan / light blue ) haven’t completed yet.

Nasdaq. She definitely good in timing” the market. 2/ August/22.Nasdaq. It’s probably untold “fake news” that she has “good portfolio” in stocks....Crisis was “created” by human not dinosaurs or tigers. Or Mars hitting Venus where no human living there. So “ mini boss” “visiting” Taiwan will make e-mini crashed another -31.30% ??!!

Bitcoin probably drop to around 13598 by end 2022. 2/August/22Bitcoin probably going much lower than 18000 as previous idea due to its expanding flat pattern (A)(B)(C) ( cyan / light blue ) haven’t completed yet.
Apple “disproved ” Newton’s law of Gravity? 1/August/22.Apple. AAPL. The world's biggest companies by market cap. Is he breaking “ Newton’s law of Gravity = stop falling down? Probably not.. Maybe another -35%..@ around 103.80? (F=ma)

DNEX elliottwave analysis. 28/July/22.DNEX a Piotroski F-Sore 8 out of 10 ( fundamentally “good” ) company. Possible forming a running flat pattern ABC ( yellow) where price possible resuming its uptrend ONLY @ around RM0.55 - RM0.56..

Tenaga. Is it “bottom”? 23/July/22.Tenaga while investors can earn average 6% dividend per annum + PLUS possible > 100% profit gain from stock price in long term...probably only “bottom” by years end of 2022 @ around RM7.50 on median line (dashed red) of parallel channel.

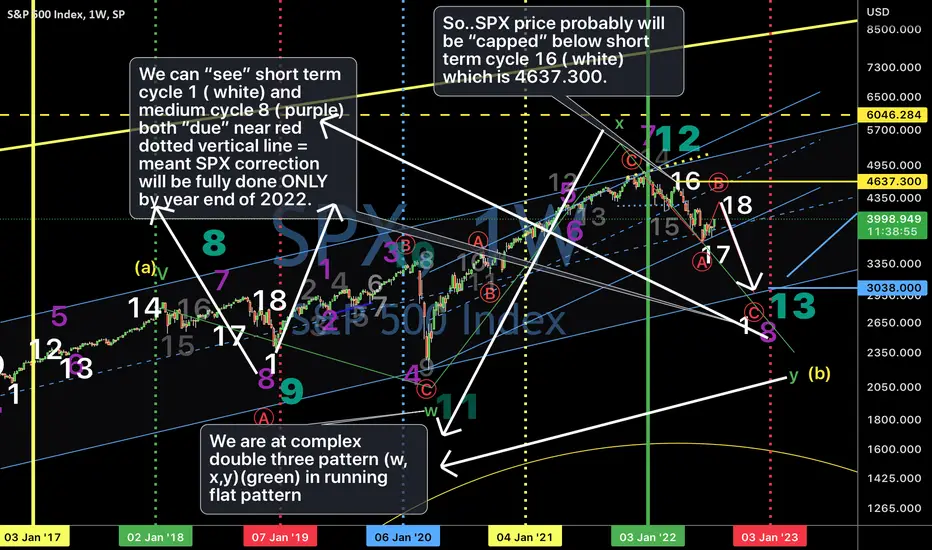
SP500 done correction? Cycle & Elliott wave analysis. 22/July/22SP500 probably on its pullback from unfinished bearish trend. Its price structure “tell” us that in high probability it will only done its “crash” at around 3038 near lower support line of long term channel (cyan)..( Definitely not Chinese are playing the “games” e.g .as Bitcoin was stalled “temporarily” at around 18000 and Gold’s at around1680...
Grab. Trading in elliotwave & wyckoff method. 21/July/22Grab. A unicorn “big player” in South East Asia e-hailing which also just “owned” local “supermarket called Jaya Grocer” few months ago..Its stock price structure look “attractive “..

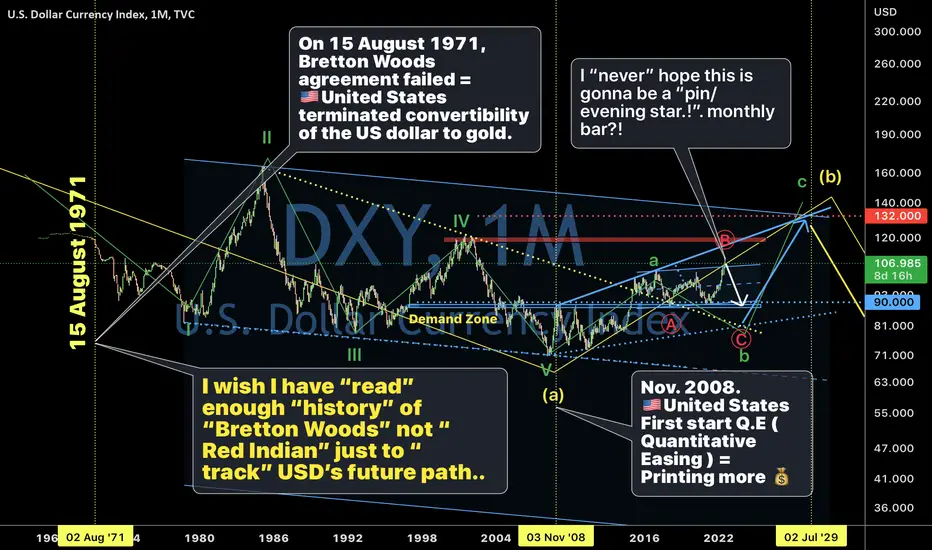
USD index otw to 90 or below?! 21/ July/22.Dollar Index aka DXY have very “strong “ upward moves for past few months! “Slaughtering” all ......When “he” want to take “profit”!?...
EURUSD to 0.800?! But only after 1.300? @ 2030?! 21/July/22.EURUSD. Some analysts predict EURUSD will dropped till 0.800?! Really?! Maybe after 1.300 first then 0.800 at around 2030?...

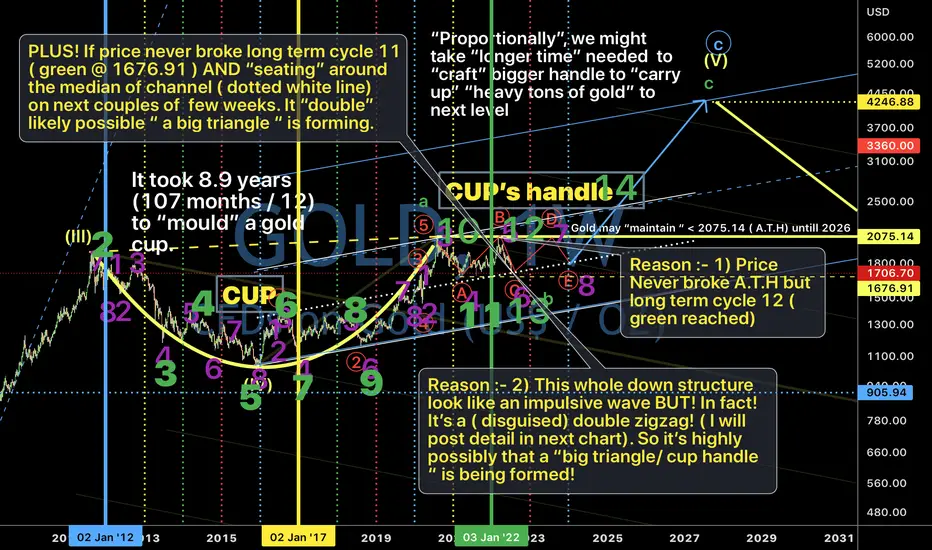
Gold. I’m reholding bigger cup’s handle tighter. 16/July/22.Gold. I’m “ re- holding” my bigger golden cup’s handle ideas “tighter” with 2 reason at chart. Sorry unlike Conventional Technical Analysis e.g RSI, MACD, MA or support/resistance, today I gonna talk about the ideas/ concepts of cycle on charts which is the x- axis of any charts. just to “find” the “probability “ of gold’s next “moves”..
Topglove’s medium cycle analysis. 15/July/22.Topglov’s medium cycle 7 ( Purple) will be due anytime soon (as it was always between green/red vertical line ) and move up to cycle 8 ( purple) which is due by year end of 2022.

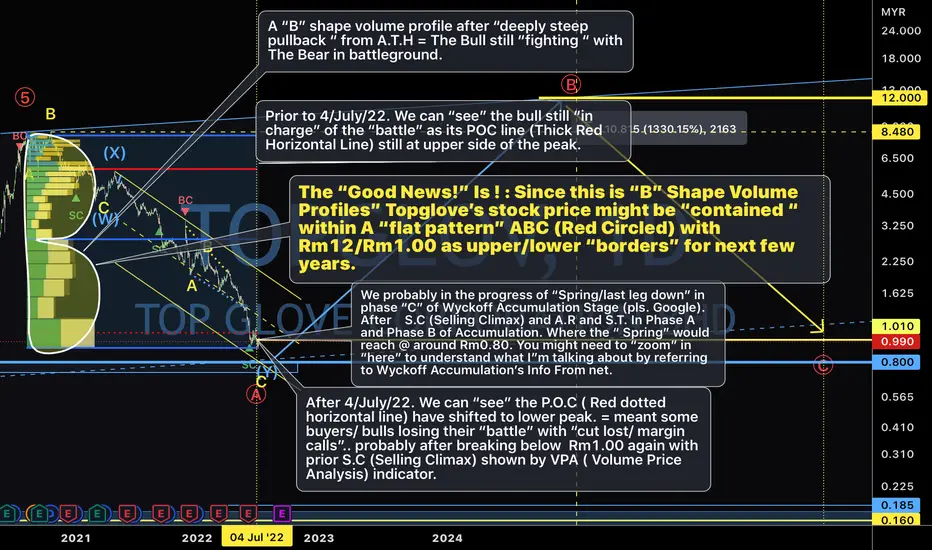
Topglove. Wyckoff Accumulation Stage. 15/ July/22.Topglove. Probably in “Phase C” of “ Wyckoff’s Accumulation Stage” moving down to Spring.( @ around RM0.90). With 3 Drives chart pattern.

GOLD.better or Never trade against trend.? 15/July/22.Gold’s downtrend haven’t “bent” yet, it’ s “no good” to “make enemy” with your “buddy trend”..So...you are “responsible” for the “high risk” consequence by against him/her( the downtrend)..by going long.

Supermx. Finding its ying/Yang force with channel. 14/July/22.Supermx. Today I gonna “bullsxxxing” a “myth” about ying ( seller force ) , Yang ( buyer force ) AND neutral force ( median line of parallel channel) again “represented” with parallel channel. P/s Since tradingview “free user” don’t have enough data feed. I have to “superimposed image” by using 3rd party apps to have more “history data” for “whole view” of its chart where it is still publishable in tradingview.

Kossan. Finding its ying/Yang force with channel. 14/July/22.Kossan. Today I gonna “bullsxxxing” a “myth” about ying ( seller force ) , Yang ( buyer force ) AND neutral force ( median line of parallel channel) again “represented” with parallel channel. P/s Since tradingview “free user” don’t have enough data feed. I have to “superimposed image” by using 3rd party apps to have more “history data” for “whole view” of its chart where it is still publishable in tradingview.

HARTA. Finding its ying/Yang force with channel. 14/July/22. HARTA. Today I gonna “bullsxxxing” a “myth” about ying ( seller force ) , Yang ( buyer force ) AND neutral force ( median line of parallel channel) again “represented” with parallel channel. P/s Since tradingview “free user” don’t have enough data feed. I have to “superimposed image” by using 3rd party apps to have more “history data” for “whole view” of its chart where it is still publishable in tradingview.

Top glove. Finding its Ying/Yang force with channel. 14/July/22.Topglove (again). Today I gonna “bullsxxxing” a “myth” about ying ( seller force ) , Yang ( buyer force ) AND neutral force ( median line of parallel channel) again “represented” with parallel channel. P/s Since tradingview “free user” don’t have enough data feed. I have to “superimposed image” by using 3rd party apps to have more “history data” for “whole view” of its chart where it is still publishable in tradingview.

Topglove long term cycle analysis. 13/July/22.Topglove as the chart. Its long term cycle 13 (Green) is due slightly after green vertical line = it will be “bottomed” anytime now or by early 2023. Cycle 14 high ( Green) is @ the “middle” of vertical green and red line = Topglove will have “uptrend” until 2024/2025 min after it completed Cycle 13 ( Green) low.

KLCI Cycle & elliotwave analysis. 11/July/22.KLCI “based” on its cycle analysis. KLCI is still forming its expanding flat pattern in (A)(B)(C)(cyan) in wave 2 ( Red Circled) which probably ONLY completed by end of 2022 as long term cycle 8 (purple) alway reached near by the red vertical line. (Year end).

Topglove’s volume profile & Wyckoff method. 11/July/22.Topglove chart again!? It must be very “boring” as I “re-access ” my ideas again and again on Topglove chart..BUT since I personally invested on it I never treat my hard earned money lightly..