Supermx may found its “base” soon. 19/ June/22Disclaimer : All past, present, future charts are all for illustration, research, studies purpose ONLY.. Supermx May start building its base soon before deep pullback from “downtrend “ as price now @ 1) major demand Zone 2) Major up trend line ( Cyan dashed line )..
Xyz3dtrading

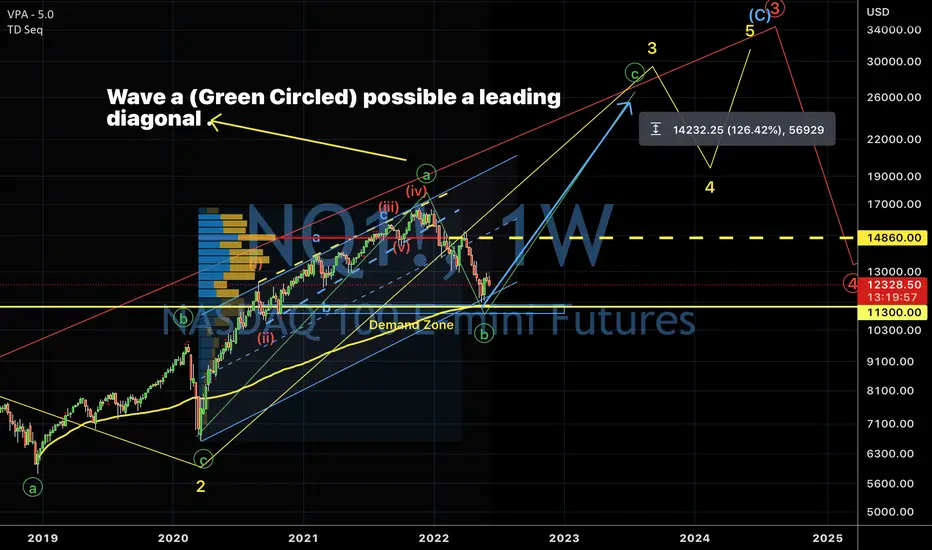
Nasdaq “so far” has been “dumped “ for 33.99%..17/June/22Nasdaq after -33.99% “drawdown “..”officially “.has been “declared “ as “small crash” ..Most traders probably now at “extreme” “low” level before “euphoria” for ATH ( All Time high ) again? until forgot...BUT. maybe “the worst” yet still waiting to “come”..Another “pump” and more “heavyweight” “dump” probably 50% waiting?!

Bitcoin. Where “bottom”? Answer worth of millions! 17/Jun/22Bitcoin. The question million of traders asked might be where could its “base/bottom” built before rallying up to 100k?. Maybe the answer is 18000. where “all” meet..1) The Lower trendline ( cyan/ light blue) of wedge pattern 2) POC of Volume Profile ( Red Horizontal line) 3) VWAP ( yellow MA line ). 4) Demand Zone.. AND good luck! In your trading!

Nasdaq probably last leg down. 16/ June/22.Nasdaq probably on its last leg down toward around 11140 after US 0.75% rate hike..AND. completing its bearish correction since 22 Nov 2021.

Nasdaq and “great wall”. 15/June/22Nasdaq weekly chart and “the Great Wall” = comprises of 3ema 233 (Fibonacci) ( high, low, median) Average curve Great Wall...Will it hold the “ invaders “ this time?

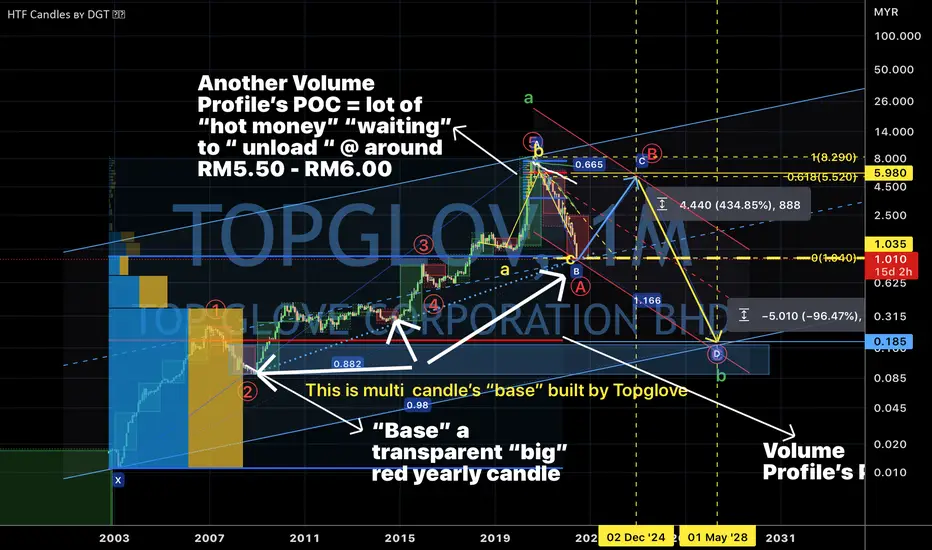
Topglove May <Rm 0.2 BUT maybe RM5-Rm6 first. 15/June/22Disclaimer : All past, current, future analysis are purely for “entertainment, research, studies” purpose only..TOPGLOVE. after “reviewing “ its price’s structure the initial expanding abc ( yellow) waves pattern idea which might “finished “ its “bearish correction “ most likely won’t happen. The current downward price movement from all time high look more like an downward impulsive 5 waves which is wave A ( Red Circled).. So..so.. there is a high “possibility” that Topglove will have another “deeper” leg down which is wave C ( Red Circled) where Price could ONLY “complete “ its “long term” correction probably @ around RM0.185. !!!!!??? BUT..but wave B ( Red Circled ) could “retrace” “ up to” around RM5.50 - RM6 which is Fibonacci 0.618 and Volume Profile POC....
Gold watch out! 1800! 15/June/22Gold possible forming an expanding flat pattern ABC ( yellow circled) as on chart. Price may “reverse “ right before/after FOMC possible 0.75 or even 1.0000 rate hike?!...@ around 1800 which is QM level and 3 drives pattern....or tell us what “ any interesting chart pattern “ you “ have discovered” ? E.g harmonic chart pattern etc...

KLCI. Finding its “Yin & Yang” forces. 15/June/22KLCI index currently “reside” @ around the “terminal/ center of gravity “ of universal Yin ( seller’s force) and Yang ( buyer’s force”..What do you “see first?” Or “think second?”....

KLCI “Finally” reached 1490. 10/June/22KLCI Finally break below 1500 and reached 1490 as last wave e or last leg of bullish triangle as previous ideas. But “maybe” still having some “space” for downside until around 1480? As its “big brother” composed “stock” which is Tenaga still waits to break RM8.570 before “bottoming”?..

Nasdaq maybe “bottom” without “touching. 11300.? 10/June/22I like to study stock index even I dun trade it maybe unlike individual stocks. Stock index as net “combination “ of hundreds stocks is “hard” to “manipulated?”..Anyway Nasdaq possible “found “ its “yearly “ support near 11300 as previous posted ideas. As price possible making higher low near.. 1)Demand Zone 2) lower parallel channel support 3) VWAP ( yellow MA line)..
Tesla possible “bottom” with Head & shoulder. 10/June/22Tesla / TSLA possible found its “yearly” bottom with “head and shoulder “ pattern.. “Look” like A “ u turn” not “V turn” near demand Zone..

Topglov “hit” 3 times “stop lost”! 27/May/22..Gosh! Topglove have hit 3 times stop lost from previous 3 ideas.. I just “found” but “not expected”. 4 valid “points” (as remark 1p to 4p in chart)..to keep my long positions.. Maybe..maybe Rm1.35 (again ) will be “bottom “ for many few years ahead..

Bitcoin watch out 26500. Updated 27/May/221)On Charts : Charts consist of 3-Dimensions - The X-factor ( Time or Cycle ), The Y- factor ( Price Geometry ), AND The Z-factor ( The Speed ).. 2)On Elliot Wave / Market Structure : Unlike Textbook written rule : ALL Impulsive wave comprise of ONLY a-b-c sub-waves NOT 1,2,3,4,5 waves.. AND there is NO Truncated 5th wave BUT ONLY wrong wave counts...
Disclaimer

Gold watch out 1815. Gold CFD & future different. 27/May/221)On Charts : Charts consist of 3-Dimensions - The X-factor ( Time or Cycle ), The Y- factor ( Price Geometry ), AND The Z-factor ( The Speed ).. 2)On Elliot Wave / Market Structure : Unlike Textbook written rule : ALL Impulsive wave comprise of ONLY a-b-c sub-waves NOT 1,2,3,4,5 waves.. AND there is NO Truncated 5th wave BUT ONLY wrong wave counts...
Disclaimer

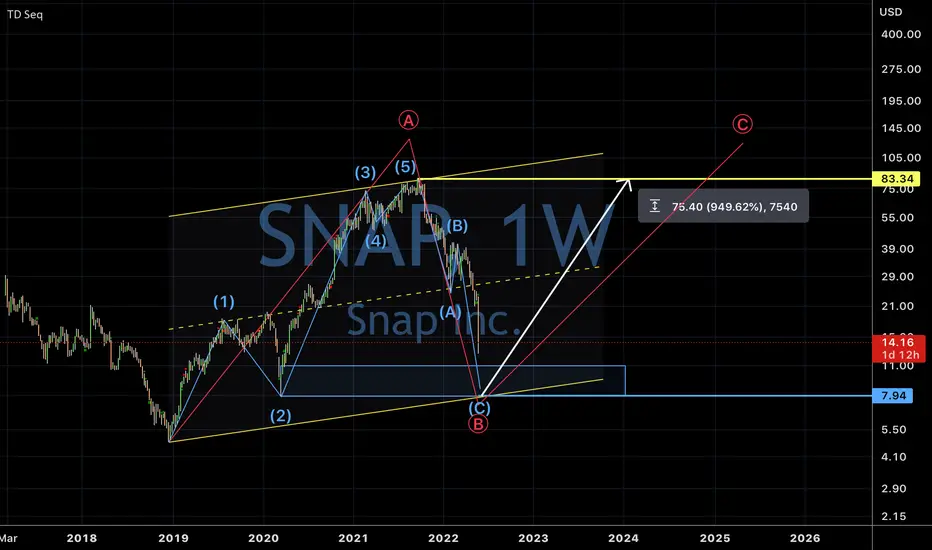
SNAP elliotwave updated 26/May/221)On Charts : Charts consist of 3-Dimensions - The X-factor ( Time or Cycle ), The Y- factor ( Price Geometry ), AND The Z-factor ( The Speed ).. 2)On Elliot Wave / Market Structure : Unlike Textbook written rule : ALL Impulsive wave comprise of ONLY a-b-c sub-waves NOT 1,2,3,4,5 waves.. AND there is NO Truncated 5th wave BUT ONLY wrong wave counts...
Disclaimer
Cypark. It’s not easy to catch “a falling knife”..26/May/221)On Charts : Charts consist of 3-Dimensions - The X-factor ( Time or Cycle ), The Y- factor ( Price Geometry ), AND The Z-factor ( The Speed ).. 2)On Elliot Wave / Market Structure : Unlike Textbook written rule : ALL Impulsive wave comprise of ONLY a-b-c sub-waves NOT 1,2,3,4,5 waves.. AND there is NO Truncated 5th wave BUT ONLY wrong wave counts...
Disclaimer

USDMYR toward 6.25?! By 2029/2020?.. 22/May/22Do you think US dollar could “convert to” around Rm6.25 by 2029-2030 ?.. Sound “good” or “bad”?...But RM might “getting strong” for time being till around Rm4.035

Gold’s Major trendline + 1800 broken! What next? 14/May/22Gold have been heavily “smashed down/ manipulated “ by XxD, what is the next possible stop to build “base” after 1800 and major trend line ( cyan / light blue dotted line ) was broken? From this chart 1790 possible is the zone to build “base” considered where 1790 is the confluence zone of 1) VWAP (thick yellow curve line) and 2) Volume lme Profile P.O.C ( Red thick horizontal line )..

Topglov reached 1.48! Either death or glory! 13/May/22Topglov price have reached Rm1.48 a “ border” of “ 4 = Death ( in Chinese ) or 8 = Glory ( in Chinese )..A possible 3 “touch & go “ or 3 drive pattern or wedge pattern’s lower trend line.

NIO or TSLA chose one? Or both? 12/May/22NIO. A major E.V ( Electric Vehicle ) player in China. Its price structure probably found its “base” @ around 9.38 after filling up the previous “price gap”..

Tesla long @ ≈ 550. Potential of 660% growth. 12/May/22Tesla is still forming a running flat (A)(B)(C)( cyan / light blue) in wave 4 ( Red Circled).. Current “pullback “ is an expanding ending diagonal ( some traders views it as triangle) ..1,2,3,4,5 ( yellow) in wave (B) ( cyan / light blue )..”Downtrend” May found its “base” @ around 550 before “rallying “ to > 1243.49 ( target around 4180 )..

Gold probably found its multi months base @ 1831.86. 12/May/22Gold checking from its lower time frame price structure, most likely it has reached wave 4 (yellow) @ 1831.86 not 1820.. Just 1 day before the Core CPI (consumer price index)..news release....

Tenaga still waiting @ 8.50-8.30. 11/May/22Tenaga price still waiting to complete building its long term “base” at around RM8.50 RM8.30 where is the “multi” confluence zone for price landing to build a “concrete base”..
