Gold maybe a triangle in wave 4 (yellow). 20/April/221)On Charts : Charts consist of 3-Dimensions - The X-factor ( Time or Cycle ), The Y- factor ( Price Geometry ), AND The Z-factor ( The Speed ).. 2)On Elliot Wave / Market Structure : Unlike Textbook written rule : ALL Impulsive wave comprise of ONLY a-b-c sub-waves NOT 1,2,3,4,5 waves.. AND there is NO Truncated 5th wave BUT ONLY wrong wave counts...
Disclaimer
Xyz3dtrading
Bitcoin. A replacement of US dollar by F..D?! 20/April/22. 1)On Charts : Charts consist of 3-Dimensions - The X-factor ( Time or Cycle ), The Y- factor ( Price Geometry ), AND The Z-factor ( The Speed ).. 2)On Elliot Wave / Market Structure : Unlike Textbook written rule : ALL Impulsive wave comprise of ONLY a-b-c sub-waves NOT 1,2,3,4,5 waves.. AND there is NO Truncated 5th wave BUT ONLY wrong wave counts...
EURUSD medium term T.A updated 14/ April/ 22Eurusd possible completed wave C ( Red circled) of triangle..Long at round 1.805 at right shoulder of reverse head and shoulder shown on lower time frame e.g 1 hour chart..

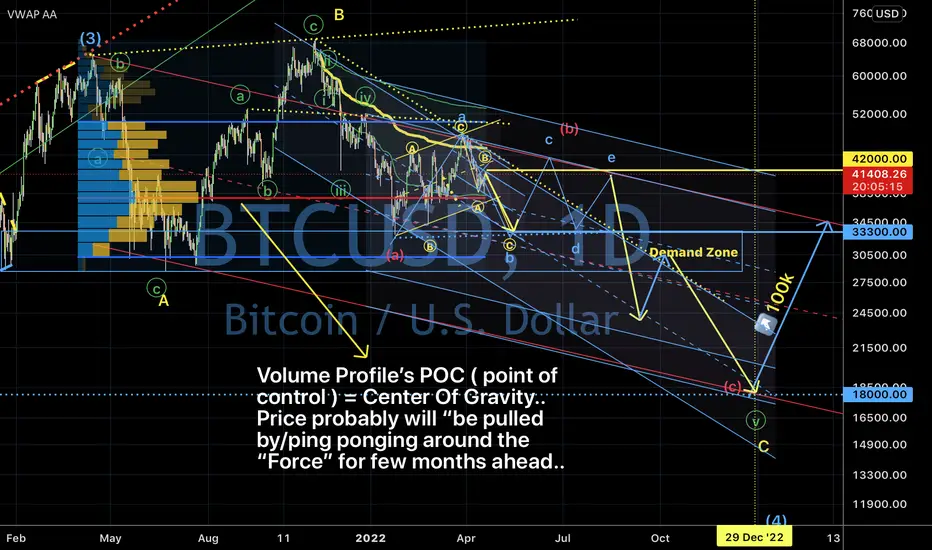
Bitcoin may only found its based @ 41000. 11/April/22Bitcoin may for a triangle in abcde (cyan/light blue) in wave (iv) (Red). .current down move may temporarily find its “ base” @ around 41000 which is wave (A) (green) of wave (c)(cyan/light blue) of triangle..before a pullback to wave (B) (green) at around 45700 and resuming its down trend for wave (C) (green)..

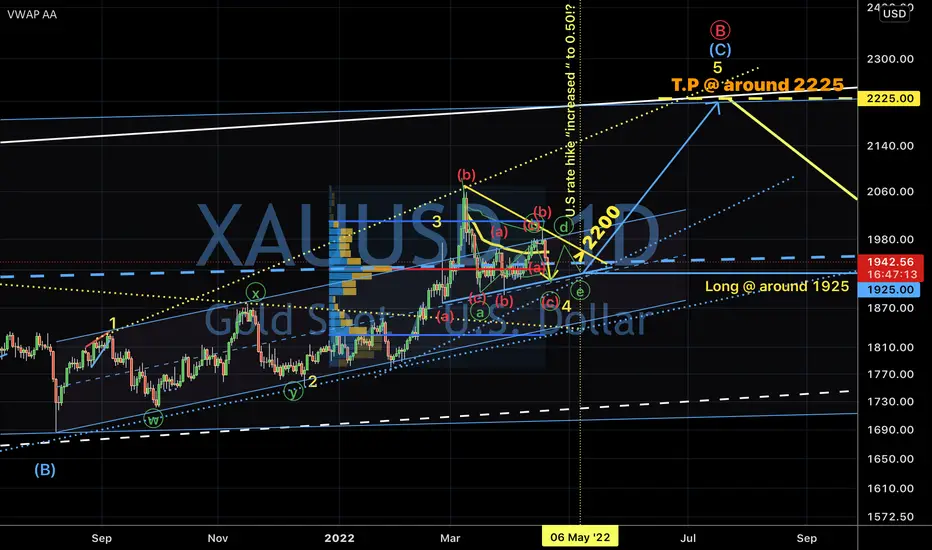
Gold short again around 1960. 11 April 22Gold possible forming a contracting triangle abcde ( cyan / light blue ) in wave (iv) (Red)..

SERBADK T.A updated 11/ April/22While waiting Serbark “resuming” its trading activity.. It seem like previous (stalled ) pricestructure having a potential to form a triangle in wave 4 (yellow)..

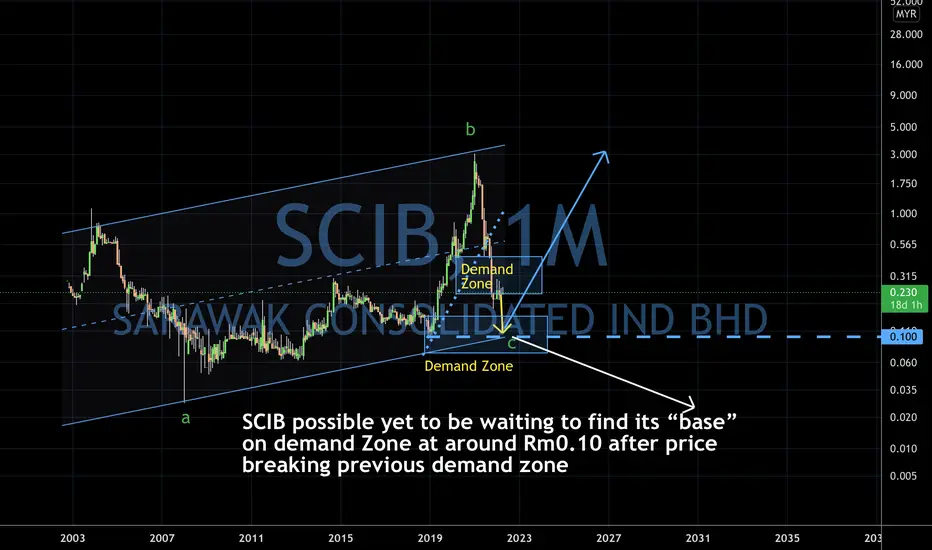
SCIB T.A updated 11/April/22SCIB possible yet to be waiting to find its “base” on demand Zone at around Rm0.10 after price breaking previous demand zone..
Kpower TA updated 11/ April/22Kpower possible found its “base” at Rm0.315 on demand zone. Price have potential growth of 419.64% from current Rm0.560 to Rm2.910...

GBPJPY. Watch out 168 lvl!. 10/April/22GBPJPY Possible forming an expanding Flat Pattern (A)(B)(C)(cyan/light blue) on wave 4 (Red Circled ) AND Reverse @ around 168 by around 26 April 2022.

Topglove’s short term elliotwave updated 6/April/22Topglove’s price might have “pullback” toward wave 2 (yellow) @ around Rm1.820 which is 1) Fibo 0.618 retracement level 2) Volume Profile P.O.C ( point of control ) level Red thick horizontal line before.. A “strong” upticks..

Maybank short term “avoiding FOMO” trade. 6/April/22Due to FOMO ( fear of missing out ) factor most traders/ investors always bought stock @ ( high price ) on “breakout trading strategy “ etc..To avoid such problem ..one of the methodology is waiting for “pullback” and buy at “retracement confluence zone” .. A “ confluence zone” @ 1) Parallel Channel 2)Fibonacci level etc...

Maybank long term elliotwave updated 5/April/22Maybank possible completed its bullish triangle abcde ( Red Circled) while waiting its price “exploding” to the upside after so many years of “ squeezing “ its price..

IJM elliotwave updated 1/April/22IJM as one of the construction’s “conglomerate” in Malaysia probably “reflected “ earlier on economy slowdown and “react” slower on economy recovery....
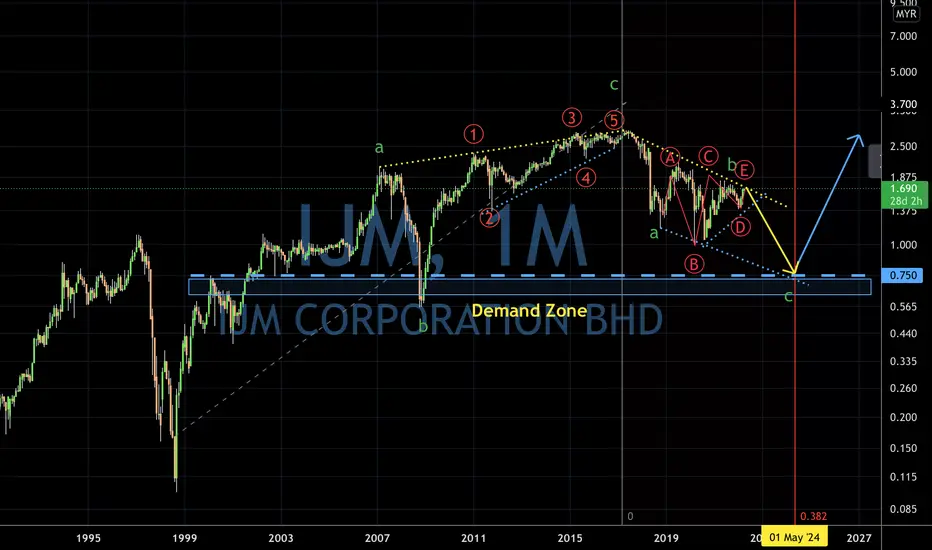
IJM elliotwave updated 1/April/22IJM as one of the construction’s “conglomerate” in Malaysia probably “reflected “ earlier on economy slowdown and “react” slower on economy recovery....

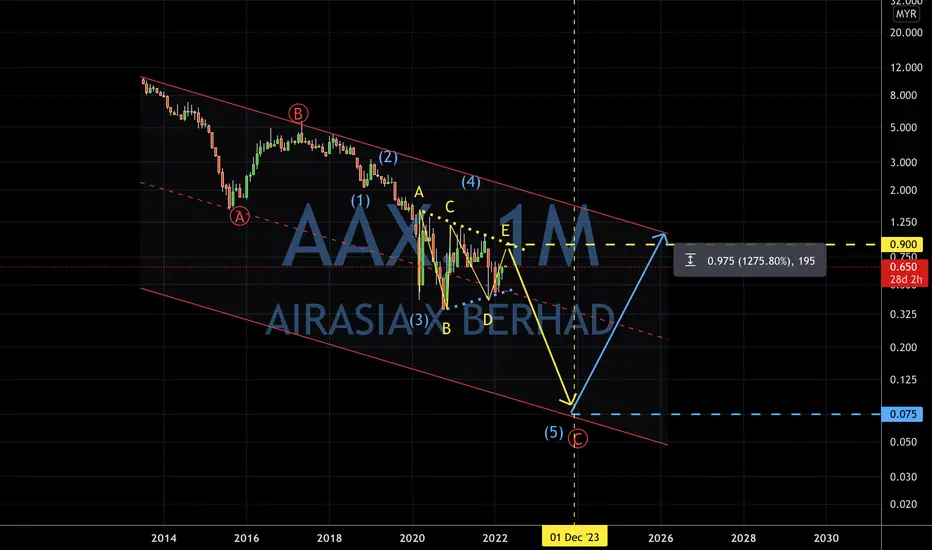
AAX elliotwave updated 1/April/22AAX let everyone can “fly/fry” “again!”.. We probably just need to “tightening up” our “tummy” for few more months “saving more fuels” before “taking off” to the moon!!
CapitalA (airasia). Updated. 1/April/22CapitalA (formerly know as AirAsia) let everyone can “fly/fry” “again!”.. We probably just need to “tightening up” our “tummy” for few more months “saving more fuels” before “taking off” to the moon!!

Gold medium term updated 30/Mar/22. Long @ around 18351)On Charts : Charts consist of 3-Dimensions - The X-factor ( Time or Cycle ), The Y- factor ( Price Geometry ), AND The Z-factor ( The Speed ).. 2)On Elliot Wave / Market Structure : Unlike Textbook written rule : ALL Impulsive wave comprise of ONLY a-b-c sub-waves NOT 1,2,3,4,5 waves.. AND there is NO Truncated 5th wave BUT ONLY wrong wave counts...
Disclaimer

Gold short term updated 30/Mar/22. Short @ around 19451)On Charts : Charts consist of 3-Dimensions - The X-factor ( Time or Cycle ), The Y- factor ( Price Geometry ), AND The Z-factor ( The Speed ).. 2)On Elliot Wave / Market Structure : Unlike Textbook written rule : ALL Impulsive wave comprise of ONLY a-b-c sub-waves NOT 1,2,3,4,5 waves.. AND there is NO Truncated 5th wave BUT ONLY wrong wave counts...
Disclaimer

Bitcoin possible drop to around 18000..30/Mar/221)On Charts : Charts consist of 3-Dimensions - The X-factor ( Time or Cycle ), The Y- factor ( Price Geometry ), AND The Z-factor ( The Speed ).. 2)On Elliot Wave / Market Structure : Unlike Textbook written rule : ALL Impulsive wave comprise of ONLY a-b-c sub-waves NOT 1,2,3,4,5 waves.. AND there is NO Truncated 5th wave BUT ONLY wrong wave counts...
Disclaimer

Bitcoin seem like to >10k from @ 37250. 27/ Mar/22Bitcoin seem like done its multi months correction at around 33250 which is the “confluence zone “ of Volume Profile POC and Demand zone..

Gold start downtrend?! 26/ Mar/22. Gold possible is forming a “variation “ of triangle in wave 4 ( yellow) now as chart. The “shocking impressive downward” move from around ( 2075 ⬇️ 1890 ) indeed “confused” many elliotician as they “were now” riding an downtrend impulsive wave?!

Topglove . Why “bottom” reversal? 21/Mar/22Topglove most likely won’t reach Rm1.60 as “projected target price” by some “Big Institutions”. Rm1.650 bottom most likely would be “bottom” for many years ahead..as mentioned on larger time frame chart on previous ideas. Here we checkout from smaller time chart. We have seen Topglove forming a triangle patter “ABCD” ( yellow) on its chart. Where triangle mostly happen on last correction in wave 4. ...Plus++ we have a deeper pullback than wave b (yellow) now.. confirmed a long term reversal from its last leg down of last subwaves abc (yellow)
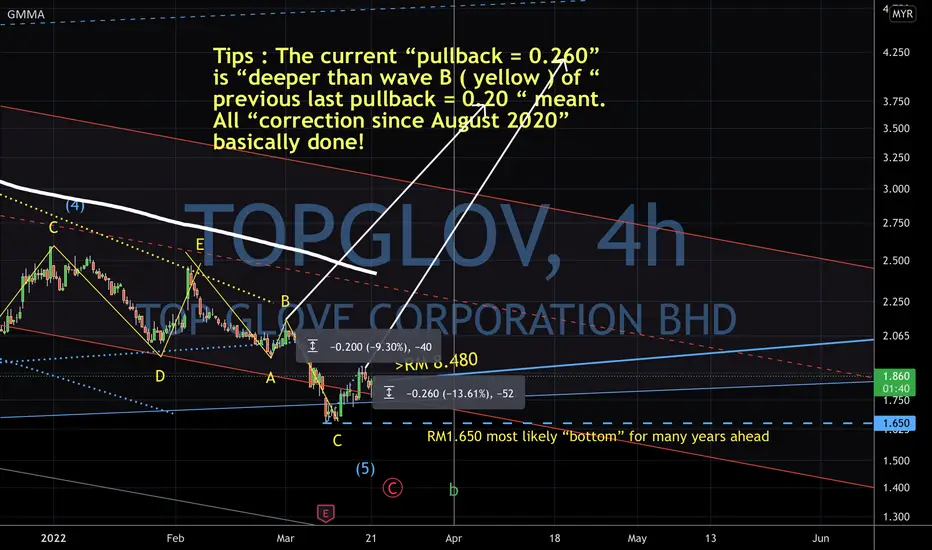
Topglov most likely “bottom “ @ 1.650. 21/Mar/22Topglove. Checking from it’s smaller time frame wave structure, topglove most likely done its bearish correction since August 2020.. Beside “reversal pattern in smaller time frame) Topglove monthly Price was stalled at around lower support line of long term uptrend parallel channel ( cyan ) plus POC ( Red thick horizontal line ) of volume profile.
