BrentCrudeOil may completing running flat at around 90. 4/10/21Gosh! Jesus! Wallstreet bet 100USD- 200USD on Brent Crude Oil???!!! aka UK Oil might be completing running / expanding flat (A)(B)(C) ( Cyan/Light Blue) pattern soon at around 90..
Xyz3dtrading

SPX Shake it up!,shake it down! baby! 3/10/21SP500 index probably forming a triangle in wave IV (green) before last leg up for major crash?!

Wallstreet cheat sheet = Market Cycles of SP500?! 3/10/21Do we have find any "similarity" between " Wall Street Cheat Sheet and SP500 century old chart? .. E.g .. Robert Have been "talking" about crash for many decades and He "Speed up" his "speaks" more to "annually"...Robert :- The hedge against inflation is debt (real estate), oil(???) gold and silver. #richdad

GOLD short @ ≈ 1775 for end of running flat. 2/10/21GOLD Probably forming a running flat pattern (a)(b)(c)(Red) in wave x (Green Circled).. Where price could reach at around 1775 which is the confluence zone of : - 1) Deviation of 233 EMA ( 2 EMA white line) 2) Upper Line of Channel (red) 3)At Resistance of the Re-action Line (Red Dashed) 4)At Supply Zone ( Red Rectangle Zone) .. Stop Lost for the running flat pattern setup is at 1787.05 which is the High of wave (a)(Red)..The First leg up of running flat pattern.

KLCI may on final leg up to complete leading diagonal. 26/9/21KLCI may on last leg up to complete leading diagonal pattern in wave a (Cyan/Light Blue Circled). Where price could reach at around 2144 before more than 50% crash!? on Mid of 2022?

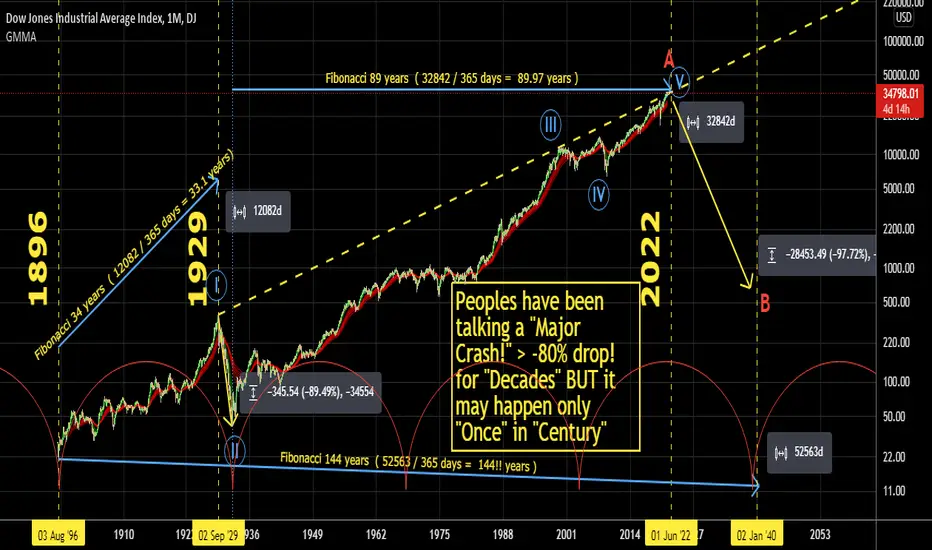
DJI. Fibonacci Years and When "Market Crash!? > -50%" ? 26/9/21People have been talking about "Major Stock Crash!" " 50% even 80% ! drop" for many decades. BUT it may happen ONLY "Once" in "Century"...Maybe 2022?!
INARI breaking all time hi again. 25/9/21INARI on "waiting List" as a 1 of the 30 "Components Stock Index" in KLSE..as its market cap surges after price have broken all time high again. Its price structure may show it has completed wave iv (green circled) BUT price may retrace soon for expanding flat in wave (b) (Red) where price could reach around RM 3.355..

TSLA may reach around 900.40 again. 24/9/21TESLA price may reach near 900.40 again where there is a "possibility" to form flat pattern in wave 2 (Red Circled) AS Price now may trending up toward wave (B)( Cyan/ light Blue) of the flat pattern..

RUBBERREX near Major Support 0.560.. 24/9/21RUBBERREX price near major weekly demand zone and resistance/ flip as support zone near 0.560...

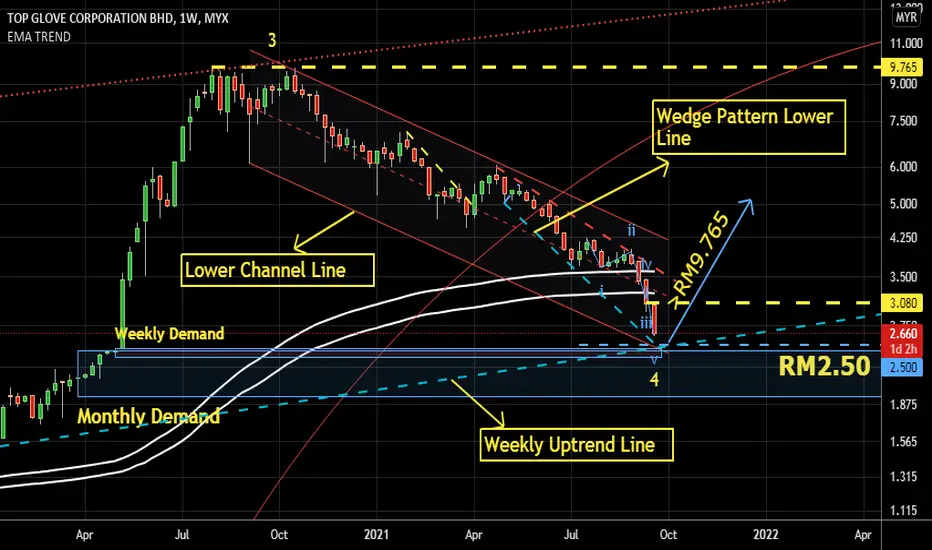
TOPGLOV. Why 2.50? Not Maybank 1.80?! 23/9/21Why TOPGLOVE's RM2.50 price is the "MOST CRITICAL SUPPORT"?! It doesn't matter "Everyone" got to know RM2.50 is the BEST "OFFER SALE PRICE" It's "No secret"..Because even it's "disclosed secret" .. Still lot of traders won't believe it ...Show your chart Why Maybank Projected RM1.80 is "reasonable" ..
"TRADE WHAT WE SEE.. NOT WHAT WE EXPECTED" ...What I "See" RM2.50 are the confluence of 1) Weekly Demand Zone 2) Monthly Demand Zone 3)Weekly Uptrend Line (Cyan/Ligh Blue)..Support 4)Lowe Channel Line (Red) Support 5)Wedge Pattern Lower Line Support (cyan/light blue).. etc.. What else can we "see"?
KNM one of top 3 most traded stock recently.. 23/9/21KNM (Oil & Gas ) sector...as 1 of top 3 active (volume) traded stock recently in KLCI.. What "could" be its next movement? "Maybe" a "ranging triangle"? ...

BINTAI "A Dead Cat is Bouncing" ? 23/9/21BINTAI stock price "suddenly" spike up with high volume with "fundamental News" it's a "meow meow" AND "fishy" scenario ?! Previous Analysis of Bintai at comments below

BITCOIN possible 10k by end of year. 23/9/21BITCOIN possible forming an expanding flat pattern ABC wave (yellow). Where price of wave B (yellow) "May" reach around 10,000 by end of 2021.. Price may complete sub wave b (Green Circled) of the uptrend wave B (yellow) correction.

BURSA Short Term View. Maybe double bottom. 21/9/21BURSA price near to previous low at major demand zone. Probably forming a double bottom ...

BURSA Long Term View. 21/9/21BURSA probably now moving up to wave b (green) of the running flat (a)(b)(c)(yellow) pattern. Whereby wave b (green) could reach at around RM20.00 on upper trend line of a parallel channel (Cyan/Blue)...

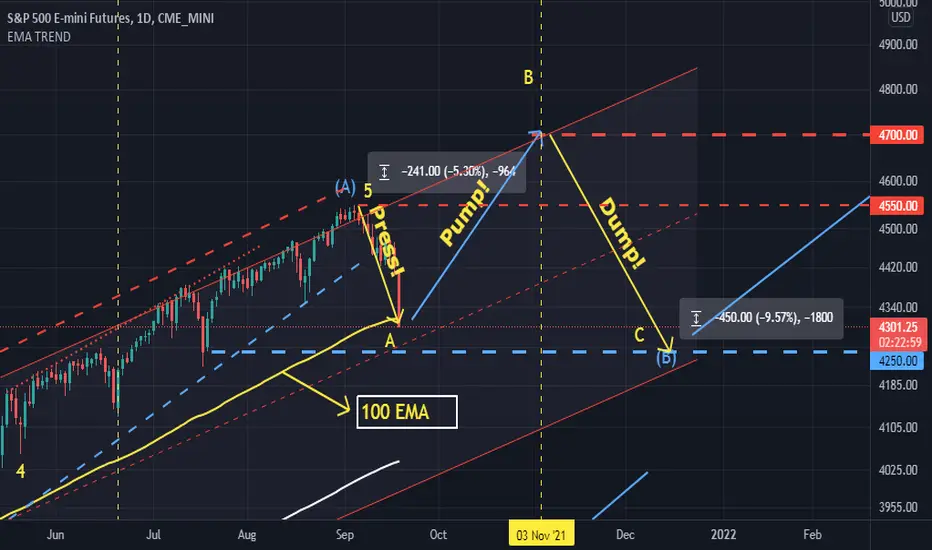
SPX. Maybe(5%) enuf warm-up for the "PUMP!" and "DUMP"! 21/9/21SPX price have just reached at 100 EMA an about -5.3% "warm-up".... Probably ( A standard 5% deviation) for the "Press" "Pump" and Finally "Dump!" Effort!!....
TOPGLOV's 2.50 is a call "to" Sell"? or "For" Sale"!? 21/9/21A Prominent Fundamentalist have called TOPGLOV price for RM3.50 and RM2.80 in "Excel" format on TopGlove Website. Is This a call to "Sell" OR..For "Super Sales"?! .. RM2.50 ="Super Bargain Sale Price" could come much earlier in this few days than expected.. Where RM2.50 Got lot of "Bargain Hunter":--- 1)"Cyan Rectangle Box""Demand" Buyer 2) Lower Parallel Channel (Red) (Buyers) 3) Up Trend Line (Blue Dashed Line ) Buyers...4) A Fixed monthly "Cycle Buyers" (below cyan time cycle)

KLCI 1515 is the "key" support. 20/9/21KLCI may found major support at around 1515 where there is a confluence zone of 1) trend line (yellow dotted) resistance/support flip zone 2) Major Demand Zone

TOPGLOV's wyckoff analysis. 19/9/21I've just been "dissecting" TOPGLOV chart structure. It seem like we've just completed wave 4 (yellow) of wave 3 (Red Circled) ONLY!!..Just about 20%-30% left to complete wave a (Green)..So topglove price most likely will break RM9.765 within 6-12 months ..

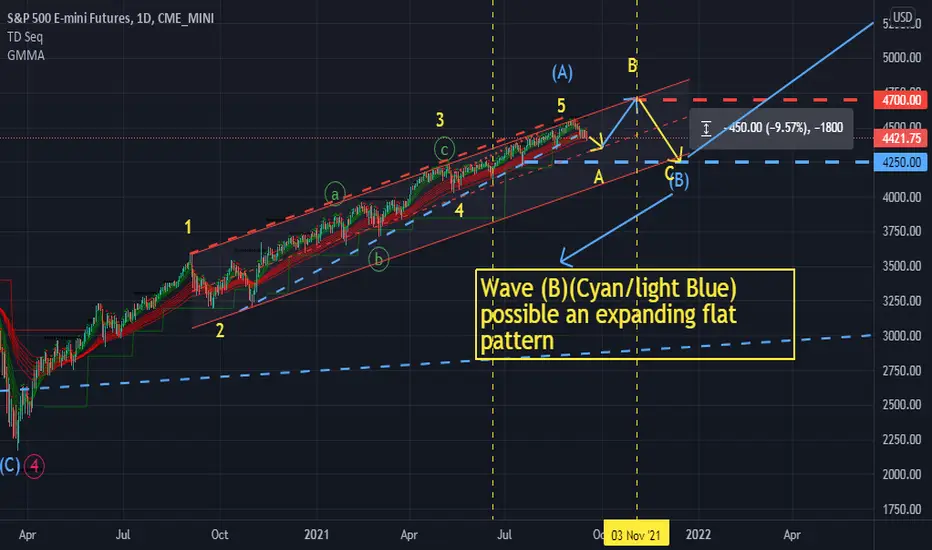
SPX possible forming an expanding flat pattern. 19/9/21SPX possible forming an expanding flat pattern in wave (B)(Cyan/Light Blue). Where SPX might have (A Healthy ) "correction" about -10% ( -9.57%) from wave B (Yellow) of around 4700 → wave C (Yellow) of around 4250
PBBANK still triangle. Maybe 3.93 is the "Fair Value"? 18/9/21PUBLIC Bank back to triangle idea. Price probably on last leg down to wave E (yellow). Where price could resuming its uptrend at around RM3.93

MAYBANK seem like still inside triangle. 18/9/21MAYBANK Price seem like at the last leg down of triangle toward wave E (yellow). Where price may ONLY resuming its up trend at around RM8.00

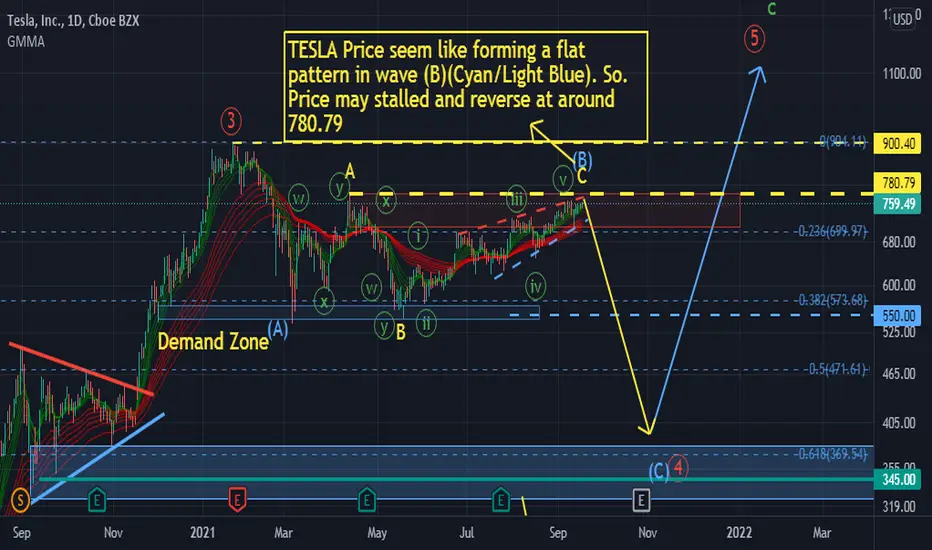
TESLA seem like forming a Flat Pattern. 18/9/21TESLA Price seem like forming a flat pattern in wave (B)(Cyan/Light Blue). So. Price may stalled and reverse at around 780.79