YFII SHORTBearish momentum in both lower timeframes and higher timeframes targets are placed at the next support levels
Yfii

YFIUSD Plateau above 0.618YFI has been bullishly rejected twice above .618
Looking for the third bullish rejection and a breakout
A triangle can be formed against the fib line

💮YFII- More support coming in, RSI/MFI bullish divergenceAfter the pump in August YFII has been cooling off for the past 3 months consolidating on key level. 200EMA is now getting close to the price creating additional support, and the price is approaching lower trendline of the channel. On lower timeframes we can see that the peaks are getting shorter and shorter which means the price is soon gonna get squeezed between support and resistance. Bullish divergence is visible on both RSI/MFI indicators(1d). In case key level is lost we can expect the price to find support at 3316. Remember that BTC correction might not be over yet.
Entry: buy at current price (3800)
Targets:
4091
4552
4893
5188
5281
5702
6216
6948
7880
-----------------
About YFII:
DFI.MONEY, also known as YFII, is a fork of popular decentralized finance (DeFi) aggregator platform yearn.finance (YFI).
Launched in July 2020, it aims to optimize returns for DeFi investors while adhering to changes proposed in an upgrade plan called YIP-8.
In addition to protocol changes, DFI.MONEY has also released new products, chief among which, the Vault, it describes as its “killer product.”
The native token of DFI.MONEY is YFII, a fixed-supply token which liquidity providers earn in accordance with their network interaction.
Source: coinmarketcap

YFIIUSDT 1D BUY SETUPThis beast is about to take off. buy here and hold for some days.
BUY SETUP:
BUY: 3900-4090
SELL:
Target 1: 4300
Target 2: 4500
Target 3: 4900
Target 4: 5500(mid term)
Target 5: 6000 (long term)
STOP LOSS: 3640
Give a like and Enjoy your profit.

YFII is ready to go higherNice longing opportunity on YFII/USDT
Good entry at completing 'W' pattern and trendline breakout.

YFII/USDT TRADING PLANNING WITH OUTLOOKYFII accumulation for 58days, soon YFII get rekt! *LOL*
I hope my outlook can give you the suggestion
Enjoy the weekend, please dont over trade!
#indonesia #tipsfortradingplanning

YFIIUSDT 4H long setup; Breakout of the desc trendlineTA explained
YFII broke out of the descending trendline. Bounced strong form the bottom with an engulfing bullish 4H candle.
Trade setup
Best entries: 3738.2 - 3810.0
TP1: 4010.7
TP2: 4105.4
TP3: 4286.1
SL: 3621.9
RR: 3.33
Max leverage: 3
—————
MDSquared Crypto Lounge
—————
Do Your Own Research (of course)
Trade at own risk (of course)
Only trade what you can afford to lose (of course)

YFII/USDT - potential trade 🚨A trend line has formed on the YFII chart.
The bulls have already tried to break it but it ended up being a trap. Now the price is back again and under the trend line.
A good buying opportunity would be a squeeze and a breakout.
Write in the comments all your questions and instruments analysis of which you want to see.
Friends, push the like button, write a comment, and share with your mates - that would be the best THANK YOU.
P.S. I personally will open entry if the price will show it according to my strategy.
Always make your analysis before a trade.

YFII - another risk free tradeBuying at support is the perfect Buying opportunity and setting a stop loss right below it makes it a risk free trade. Get ready for solid gains in yfii if this goes perfectly else keep a stop loss right below it so you wont loose anything.

YFII +10000As long as YFII is above the support price of 3600, it has an upward trend for me.
Buy at the support price of 3600 or after the failure of the resistance 4500
Note: below 3600 everything is down


YFII BREAK OUTFOR A 500$ -3000 UPSIDE AND 300 $ DOWNSIDE...
YFI is all set to bounce back after a pull back, best time to invest for a quick 15-35% uptick

YFII 10k inbound soon! Defi money is about to blast! +10k is more then realistic by end of December atleast.

YFIIUSDT - its time to enjoy the ride.Its time to enjoy the ride, good news for bulls.
*not a financial advice.
*be your own bank.


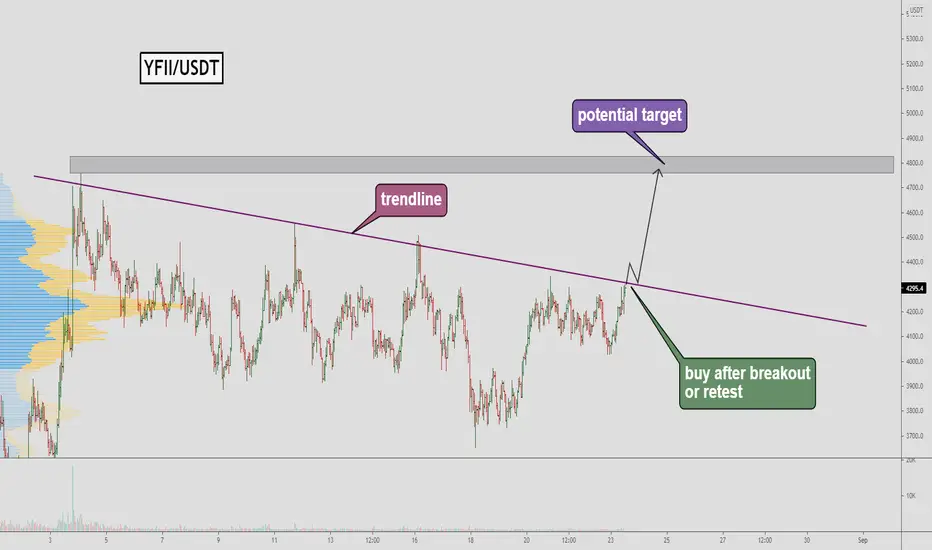
YFII/USDT - potential trade 🚨There is a beautiful picture on the YFIl chart. You can see the trend line, the price has already tested this trend line 5 times. With each test, the resistance becomes weaker, and maybe this time the price can finally break this resistance level. A good buying opportunity will be after the breakdown or retest of this trend line.
Write in the comments all your questions and instruments analysis of which you want to see.
Friends, push the like button, write a comment, and share with your mates - that would be the best THANK YOU.
P.S. I personally will open entry if the price will show it according to my strategy.
Always make your analysis before a trade
$YFII is ready to move to $5kBull flag pattern
The bull flag pattern is a continuation chart pattern that facilitates an extension of the uptrend. The price action consolidates within the two parallel trend lines in the opposite direction of the uptrend, before breaking out and continuing the uptrend.
$YFII Bull flag breakout.

Yfii financeYFII/USDT is showing a nice bull flag . Price action shows bullishness.
Good risk/reward ratio.
Price needs to close higher than the 4500USD (last weeks candle high)
RSI resistance seems to be broken. (need a candle close for confirmation)
Always us stop losses or you will get your ass burned!
N.1 mistake traders do is not to use them
-Jebu

YFII the flippening is coming YFII will be the next orchestrated pump by the FTX and Tether cabal.
Binance collapsing soon so be cautious.
YFII has some serious potential here but can get risky so manage some stop losses.
YFII will flip the garbage YFI.
Enjoy.


YFII - GO UP to 10000$ ???A_V_I_A_T_O_R think YFII - GO UP to 10000$ !!! What do you think about it idea?


🔥 YFII Break Out From 10-Month ChannelTogether with the rest of the crypto market, YFII is currently seeing a very strong upward move. Furthermore, YFII has been one of the best performers since the low of end June. Since then, YFII has seen over +175% increase in value.
The current immense price action has launched YFII towards the resistance area of the 10-month channel in which it has been trading since October 2020. Assuming that the current price action will hold, I foresee a $6500 or even a $8500 YFII in the long term. Wait for a confirmed break out before trading.
Might be the case that YFII will need some time to cool down after such a run-up. I'm eyeing the $3000 area for a potential bounce.
Happy trading!
